Available Online atwww.ijcsmc.com
International Journal of Computer Science and Mobile Computing
A Monthly Journal of Computer Science and Information Technology
ISSN 2320–088X
IMPACT FACTOR: 5.258
IJCSMC, Vol. 5, Issue. 7, July 2016, pg.498 – 508
Improving Quality of Web Services
by Using a Proposed Model
Ahmed Adnan Mohammed AL-AZZAWI
Department of Human Resources Management, university of Diyala, IraqAbstract— The aim of the study can summarized by three main points, the first one increases the QoBiz without violating the SLA for the user, it increases the QoE by providing service according to the needs of the user. Second, facilitate processing of service requests such that both service provider and user gains (the service provider maximizes QoBiz, and increased QoE by providing service according to the needs of the user) and neither party loses. The last one, the proposed model resides with the service provider and can be used without modifying the current server. The proposed model contains three layers (filter, predict, scheduler). It acts as an intermediate layer to the Web service there by selecting and scheduling user requests. The experimentation is performed by varying one of the parameters, the acceptable waiting time, the maximum waiting time and the penalty while the other two are kept as constants. This allows analyzing the effect of the individual parameter on the performance of the BES algorithm.
Keywords— Quality of Services, Web Services, Proposed model, SLA, BES.
1.INTRODUCTION
The purpose of this study came according of the needs the services provider and the user. The services provider
is worried about increasing the earnings which is known QoBiz. We can achieve that by using high Quality of
Service QoS [1]. There is one method to raise the QoS by not to violate the needs of the user. The user needs
can selecting them in agreement between the user and the service provider. This agreement is known as SLA
several language to specify service level for web services which been developed. There are many of SLA
languages which help the user and service provider to select the level of quality of services required such as,
WSLA and WSML [2]. The SLA takes into account parameters such as objectives, parties concerned, period of
validity, sample, limitations, service level and penalties [3]. The important parameter is penalty because it
selects the procedures which be taken in case the service provider cannot provide the specified quality of service.
The failure in meeting the requirements specified in SLA lead to loss of revenue generated for the service
provider for that, the service provider pays a certain amount as a penalty. The increase of QoBiz leads to avoid
the penalty and providing QoS, thus the service provider needs to join to the particular level of service in the
received service. This user experience is known as QoE [4]. There is one way to increase the QoE is in
providing QoS according to the user needs. There is case related with this is that the user needs and the services
level they expect differs with the ability to bear the cost associated [5], [6]. Thus to increase QoE there is a need
for the web services to provide services according to the user needs. Moreover, the current status to the Web
servers is such that cannot differentiate between user requests and treats all requests uniformly [5]. Apache is
one of the most widely used Web servers and handles user requests in a FIFO manner. Therefore to increase
QoE, there is a need to the service provider to treat user requests in a manner that enables differentiation
between requests, such as services can be designed to user specific levels of QoS to improve individual QoE.
For that can be a positive impact on revenue while at the same time leading to good client relation management.
After looked at the needs of the user and the service provider now we can summarize the above discussion to
frame the aim of the study. The aim of this study is to facilitate service providers to submit service in a way that
it meets the following needs:
1. It leads to increase QoBiz without violating SLA for the user and increases QoE in providing services
according to the user needs.
2. It facilitates processing of service requests such that both service provider and user (the service provider
maximizes QoBiz and increased QoE by providing service according to the needs of the user) and neither party
loses.
3. This model acts as mediator between the requests and the web servers thus it can used without modifying the
current server.
2. THE PROPOSED MODEL
In this study we propose to develop model from three-stages for improving QoBiz and QoE. This model is
called Filter-Predictor-Scheduler (FPS). The aim of the model is to facilitate the service provider to improve
QoBiz and QoE without violating the SLA. This aim is achieved by scheduling of the user requests in respect
with the SLA constraints and obligations of the service provider rather than the current approach to FIFO. In
order to perform scheduling and knowledge of the time required to process user request known as service time
[7] which is needed. The user and the service provider do not know in advance the service time for a particular
request. For that, there is needed to predict or estimate the service time to user requests. The user requests may
not be able to process the user specified response time because the current load or work committed to other user
requests. Thus it is necessary filter of requests in terms of whether they are required or not. This leads in
elimination or reduction of computation time spent in predicting the service time and scheduling. Further,
through exclusion the requests that cannot be processed within the specified time and accepting those requests
which can be processed, thus the service provider can process those accepted requests within user specified time
leading in increased quality of experience. Finally, there are three steps to achieve the proposed model as
follow:
1. The first step in the model is the filter which can through it determine efficiently the probability of
completion of a request based on factors such as current load and characteristics of the request.
2. The second step is predict, once the request is filtered based on the filtering process. The service time and
3. The last step is schedule in this stage the service time and predicting are used for scheduling tasks such that
the revenue QoBiz increases and SLA constraints are not violated and QoE as well.
2.1 Response time
The response time can be calculated by different ways according SLA languages in [8] and [9]. It is based on the
fact SLA specifies the time by which the result is required and the penalty if that is exceeded. Thus there are
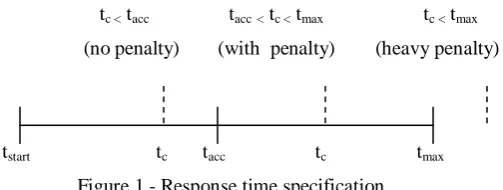
three time intervals between the arrival of the request and its completion that are brought into play as shown in
Figure 1.
tc < tacc tacc< tc < tmax tc < tmax
(no penalty) (with penalty) (heavy penalty)
tstart tc tacc tc tmax
Figure 1 - Response time specification
tstart represents the time of arrival of the request.
tc represents the time of completion of the request and is the sum of the waiting time and the service time of
the request.
tacc represents the time up to which the service provider incurs no penalty in processing the task (i.e. if tc <= tacc
or the task is completed before tacc the service provider does not have any penalties with respect to that request).
tmax represents the time upto which agreed upon penalties as specified in the SLA comes into effect. Thus if tacc
<= tc <= tmax or the task is completed in the time interval between tacc and tmax the service provider will typically
have to incur penalties that are specified in terms of discounts or reductions in price per unit time. Evidently it is
important for the completion of the task to occur as close as possible to tacc in order to minimize the loss of
revenue through such penalties. The penalty is calculated as follows:
Penaltysp= ( tc – tacc ) * penaltyu if tc > tacc
where,
Penaltysp - Penalty that will be paid by the service provider.
Penaltyu - Penalty per unit of time specified in the SLA and agreed to by the user and service provider.
tc Expected time of completion.
tacc Acceptable waiting time.
2.2 Implementation
The proposed model needs three steps to be implemented. The first step is by passing the user request to the
requests which have high chance for processing them within the user specified response time that is tmax. The
second step is the predictor determines the service time to the user requests that are accepted or filtered through.
The service time is used in scheduling of user requests within the scheduler. The third step is scheduling which
receives the user request and the predicted service time from the predict layer. The objective of the scheduler to
process the current requests in the system within tmax thus there is optimization of QoBiz and improved levels
of QoE. we needs in this study to algorithm determines a location in the queue of accepted user requests based
on estimated service times and the response time model presented. Though a best location can be found by
comparing all the possible locations using greedy/heuristic search, it is not computationally feasible given the
operational time considerations. Therefore a more realistic approach is needed. The BES algorithm achieves this
by comparing the revenues within a range of user requests and places the request at a position where the revenue
is maximized and penalties/losses are minimized. This results in improved QoBiz for the service provider. It
ensures that it selects a location in such a way that all the user requests can be processed within their respective
tmax of the response time. If such a location cannot be found, the user request is not accepted. Therefore the
BES algorithm guarantees that the user requests are processed within their response time, increasing the QoE.
3. RESULTS AND DISCUSSION
The experimentation is performed by varying one of the parameters, the acceptable waiting time, the maximum
waiting time and the penalty while the other two are kept as constants. This allows analyzing the effect of the
individual parameter on the performance of the BES algorithm. Varying a single parameter and keeping the
remaining two as constants, leads to three sets of experiments and they are as follows:
-varying the maximum waiting time.
-varying the acceptable waiting time.
-varying the penalty.
In each experiments we analyze the revenue and throughput obtained for BES, FIFO and the global greedy
search algorithms and is shown in the following table:
Table 1 Table illustrating the various experiment
Experiment Maximum Waiting Time Acceptable Waiting Time Penalty
1 Varied Constant Constant
2 Constant Varied Constant
3 Constant Constant Varied
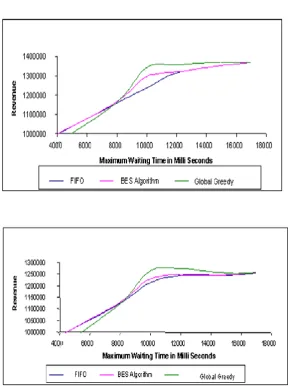
3.1 Varying the maximum waiting time
The aim of the experimentation is to find the effect of the maximum waiting time on the performance of the
BES algorithm. As discussed, we vary the maximum waiting time by keeping the penalty and the acceptable
waiting time as constants. As part of the experimental set up, the values of the parameters for the
Service time = random number generated by class random values,
Acceptable waiting time = Service time,
Amount in dollars = service time in seconds * c1,
Penalty in dollars per unit of time = service time in seconds * c2,
Maximum waiting time = Service time in seconds + k,
Where
;
–
The result which obtained from this experiment as shown in figures 2, 3 and 4.
Figure 2 Impact on revenue by varying the maximum waiting time
Figure 4 Impact on average service time by varying maximum waiting time
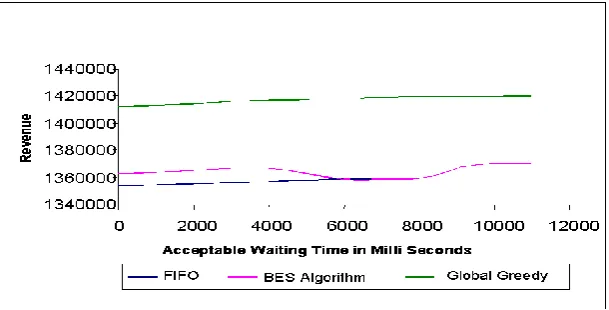
3.2 Varying the acceptable waiting time
The experiment evaluates the effect of the acceptable waiting time on the performance of the BES algorithm. As
the experimental set up, the values of the service time, the acceptable waiting time, the penalty / unit of time
(second) and the maximum waiting time are calculated as follows:
Service time = random number generated,
Acceptable waiting time = Service time + k,
Penalty in dollars / second = service time * c1,
Maximum waiting time = service time + c2 ,
Where, c1 = 0.01 and c2 = 11 seconds; k – variable (where 0 seconds k 11 seconds).
The results for the performance of the three scheduling algorithm for the revenue generated and the throughput
is given in the figures 5, 6 and 7.
Figure 6 Impact on throughput by varying the acceptable waiting time
3.3 Varying the penalty
The aim of this experiment is to analyze the effect of the penalty on the performance of the BES algorithm and
this is done through two sets of experiments and are as follows:
performing the experiments for the maximum waiting time with various values of penalty.
Figure 8 Impact of penalty (0.01 and 0.02 as value of k) on the Revenue Generated
Figure 10 Impact of penalty (0.04 and 0.05 as the value of k) on the Revenue Generated
3.4 Discussion
1. The formula used for filtering is computationally simple and facilitate the service provider to select the user
requests with high probability of acceptance in the scheduler.
2. Even by varying the maximum waiting time, the performance of the BES algorithm regarding revenue and
throughput was increased by 9.84% and 10.81% respectively compared to FIFO.
3. Similarly with varying the acceptable waiting time and penalty, it was possible to find the range where the
best performance of the BES algorithm can be obtained and can be used by the service provider in forming
better SLA as well to increase their QoBiz (or revenue).
4. By varying the penalty it was shown that though the penalty is increased by 5 times, the revenue decreases
only by 2% and the throughput is not affected.
5. With all these experiments it was evident that the BES algorithms performance never falls behind the FIFO.
Experiment regarding varying maximum waiting time is significant compared to varying acceptable waiting
time because the former reflects that though the penalty has to be paid for the extra waiting time, scheduling
with the help of BES algorithm increases the revenue and throughput by 9.84% and 10.81% respectively
compared to FIFO. With varying acceptable waiting time, the maximum waiting time is kept constant and hence
the chance to schedule is decreased thereby resulting in performance in the order of 0.75% and 2.63% increase
in revenue and throughput compared to FIFO. Therefore the service provider by negotiating the proper range of
values can obtain an effective way to provide service so that QoBiz and QoE can be enhanced.
4. CONCLUSION
This study explains the needs of the user, there has been considerable focused on individual quality aspects and
metrics. However, current study falls short of leveraging the inter related aspects of the different dimensions of
quality and taking a collective integrated view. While at first glance, QoE may be relegated to a user centric
metric; it is evident on closer investigation that user satisfaction levels are a key to the continued operation and
success of the service provider. Though providing high quality service all the time by increasing the number of
servers and upgrading the networks can enhance user experience it is feasible and not an economical solution.
The service provider needs to make profit at the same time as providing service that is in accordance with the
needs of the user. The balancing of these conflicting needs of both users and the service providers formed the
principal motivation for this study. In order to address the issue of balancing the needs of the user and the
service provider, in this study we proposed a Filter-Predictor-Scheduler (FPS) model. The model acts as an
intermediate layer to the Web service thereby selecting and scheduling user requests. It selects user requests
based on the current load at the server and the rate at which the user requests are arriving, thereby avoiding
overloading. Once the user requests are selected, the service time is predicted and scheduled based on the
amount the user is willing to pay, waiting time and the status of the other requests. The scheduled requests are
then passed to the Web service and the result is returned back to the user. The contribution and innovation of
this approach are as follows:
The model acts as an intermediate to the Web service and can be used without modifications to the
service itself. It schedules user requests using the novel Business-Experience-Service (BES) algorithm
provider without violating the SLA and hence enhances both QoBiz and QoE. The major advantage of
the algorithm is the service is always provided within the user specified time. This allows the service to
be provided according to the needs of the user resulting in differentiated service delivery and achieving
personalization. The experimentation done to evaluate the working of the model, establishes the
revenue gain obtained through the BES algorithm.
The queuing theory based filtering process of the model, allows initial determination of which requests
have a high probability of completion in a computationally efficient manner. It also gives control to the
service provider in terms of specifying the threshold for filtering requests.
Thus, in summary, this study has taken an important step towards an integrated view of the different quality
dimensions in a service-oriented environment.
References
1. Mani A., Nagarajan A., “Understanding QoS for Web Services”, 2002,
http://www.ibm.com/developerworks/library/ws-quality/ws-quality-pdf.pdf.
2. Siller M., Woods J., 2003, “Improving QoE for Multimedia Services by QoS Arbitration on a QoE Framework”, 2003.
3. Hommes B., Reijswoud V., 2002, “Assessing the QoBiz Process Modelling Techniques”, Hawaii
International Conference on System Sciences, Volume 1, pp 10, 2002.
4. Bouch A., Kuchinsky A., Bhatti N., 2000, “Quality is in the Eye of the Beholder: Meeting Users Requirements for Internet QoS”, SIGCHI Conference on Human Factor in Computing Systems, Netherlands,
2000.
5. "UDDI Specifications", http://www.uddi.org/ (Data Download Date: 4 June 2016).
6. "RMI Home Page", http://java.sun.com/products/jdk/rmi/ (Data Download Date: 17 June 2016). 7. "SOAP Version 1.2 Specification", http://www.w3.org/TR/soap/ (Data Download Date: 4 July 2016).
8. Sharma A., Adarkar H., Sengupta S., 2003, “Managing QoS through Prioritization in Web Services”,
IEEE, Web Information Systems Engineering Workshop, 2003.
9. Dan A., Davis D., Kearney R., 2004, “Web Services on Demand: WSLA-Driven Automated Management”,