Cinnirella, Francesco (2008): The Economics of Body Height: Applications in Economic History and Labor Economics. Dissertation, LMU München: Volkswirtschaftliche Fakultät
135
0
0
Full text
(2) Acknowledgments First of all, I would like to thank my supervisor Prof. John Komlos whose uninterrupted support, guidance, and incitement made this dissertation possible. I also received precious feedback from Prof. Joachim Winter who kindly accepted to be co-supervisor. Prof. Ekkehart Schlicht and Dr. Sascha Becker provided important inputs on the elaboration of the third chapter of this dissertation: Their help is highly appreciated. I am also indebted to my colleague Dr. Marco Sunder with whom I had several helpful and illuminating conversations. I also profited from comments of my other colleagues Dr. Ariane Breitfelder, Dr. Michela Coppola, Martin Hiermeyer, Dr. Arne Kues, and Jana Lantzsch. During the past three years, I benefited from the assistance of Mrs. Buchmayr, Mrs. Jaeger, Mrs. Seidl, and Mrs. Szantone-Sturm who have been always ready to offer their help when needed. The stimulating environment at the Munich Graduate School of Economics (MGSE) has been an important input for my research. Therefore I would like to thank all students and professors with whom I have been in contact in the past three years. I would like to express my particular gratitude to Prof. Gianni Toniolo and Prof. Giovanni Vecchi from University of Rome “Tor Vergata” who transmitted me their passion for Economic History. Their teachings have been an important guidance during these three years. A special thank to my parents and my brother who taught me what is important in life. Finally, without you, Bebe, all this would not have been possible.. Francesco Cinnirella Munich, September 2007. i.
(3) Contents Preface .......................................................................................................................1 References ................................................................................................................. 8 1…On the Road to Industrialization: Nutritional Status in Saxony, 1690-1850 .................................................................................................................. 12 1.1. Introduction........................................................................................................ 12. 1.2. Data and statistical issues ................................................................................. 17. 1.3. Nutritional status, 1680-1784........................................................................... 24. 1.4. Nutritional status and early industrial development .................................... 31. 1.5. Nutritional status by district............................................................................. 38. 1.6. Discussion and conclusion............................................................................... 42. References........................................................................................................................ 46 2…Optimists or Pessimists? A Reconsideration of Nutritional Status in Britain, 1740-1865 .................................................................................................. 52 2.1. Introduction........................................................................................................ 52. 2.2. Data and methodology ..................................................................................... 56. ii.
(4) 2.3. The trend in nutritional status ......................................................................... 63. 2.3.1 Height velocity and the English industrial revolution............................. 74 2.3.2 Urbanization and the nutritional status ..................................................... 77 2.4. Enclosures and nutritional status .................................................................... 81. 2.5. Conclusion .......................................................................................................... 86. References........................................................................................................................ 89 3…Body Height, Wage Discrimination, and Occupational Sorting: A Cross-European Analysis ............................................................................... 94 3.1. Introduction........................................................................................................ 94. 3.2. The dataset.......................................................................................................... 97. 3.2.1 Height and cognitive functions.................................................................100 3.3. Compensating wage differentials ..................................................................104. 3.3.1 Height premium in the male labor market..............................................108 3.3.2 Height premium and sample selection in the female labor market.....110 3.4. Height-wage-gap and discrimination............................................................115. 3.5. Occupational sorting .......................................................................................117. 3.5.1 Estimates of male occupational sorting...................................................119 3.5.2 Female occupational sorting......................................................................124 3.6. Conclusion ........................................................................................................126. References......................................................................................................................127. iii.
(5) Preface The economics of body height studies the complex interrelationship between physical stature and the economic environment in which it thrives. This interrelationship is bi-directional as, initially, the economy has a direct impact on physical growth whereas, later, body height through productivity has an impact on labor outcomes. Physical stature is the result of a combination of genetic and environmental factors. About genetics, physical growth is a polygenic process as numerous genes have been found to be associated with growth (Silventoinen, 2003). Previous studies have assessed that heritability of body height is about 80 percent whereas the remaining 20 percent is determined by environmental factors.1 Some studies also suggest that heritability of body height is not constant: the correlation seems to be comparatively lower in poor environments (Mueller, 1976; Lauderdale and Rathouz, 1999, Silventoinen et al. 2000). This fact is very important as body height is largely studied for historical periods in which individuals lived in very poor economic frameworks. Anyway, the genetic component of height cancels out when comparing averages across homogenous populations or, within a given population, when comparing average heights of different socio-economic groups. Nutrition and disease are regarded as the main environmental factors affecting physical stature. Height mirrors the net nutritional status that is the See Silventoinen (2003) for an exhaustive literature review of relevant twin studies on body height heritability.. 1.
(6) balance between caloric intake and expenditure of energy. Adult final height reflects then the accumulated past nutritional experience throughout the growing years, including the fetal period. Disentangling the effect of caloric intake and claims on nutrients is non-trivial. In fact, both the caloric intake and the expenditure of energy depend on the health status of the individual. Diseases can prevent food intake, cause nutrient losses, and increase energy expenditure. Furthermore, the analysis of physical stature must account not only for health and nutritional inputs but also for workload and labor organization (Steckel, 1995). Despite the objective difficulties to disentangle the net effect of nutrition and disease on body height, the latter yields precious information on how a social group or a population fared during childhood and adolescence in its socioeconomic and epidemiological environment (Komlos and Snowdon, 2005). Determinants of height include also real disposable family income and the relative price of nutrients. Cross-sectional systematic differences in height between different income groups have been established, without exception, everywhere and for all time periods (Komlos and Snowdon, 2005). In fact, higher social status, linked to income and education, is generally highly correlated with taller physical stature (Steckel, 1995). It is noteworthy also the relationship between income distribution and average height at a population level. Due to decreasing marginal returns to nutrient intake, an increase in income distribution will result in a decrease in average height: the loss in height experienced by the poorest share of the population will overweight the gain of the richest. The growth process of the human body can also be very informative. From the change in height (named velocity) during childhood or adolescence it is possible to infer whether the individual was subjected to economic stress.2 An illuminating example of the plasticity of body height comes from the investigation about the nutritional status of nineteenth-century American slaves. Richard Steckel showed that slaves’ children were remarkably malnourished due to hard work of pregnant women, early interruption of breast-feeding, and a low protein diet. Once the children, by age 8 to 12, started working they overcame much of their early childhood height deficit. The vigorous adolescent growth spurt indicates that the diet of working slaves was nutritionally adequate for their For economic stress we mean one of the following factor or a combination of those: insufficient caloric intake, excessive workload during adolescence, weakening disease.. 2. 2.
(7) physical effort (Steckel, 1986; Steckel, 1998). We also know that in modern societies final height is attained between age 18 and 20 (Eveleth and Tanner, 1976). We shall see that for the period of the industrial revolution final height was attained around the age of 23. In fact the human body when subjected to economic stress tends to postpone growth. Therefore the comparison of average ages of final attainment of height for different socio-economic groups can reveal different nutritional patterns experienced during childhood and adolescence. Anthropometric History is the study of body height as a complementary indicator of the standard of living. That physical stature was subject to the effect of environmental factors was already known to the famous French physician and sociologist Louis-René Villermé (1829). He realized that poverty was much more important than climate in influencing growth. In the 1960s, French historians adherent to the Annales Schools (École des Annales) such as Emmanuel Le Roy Ladurie investigated the possible determinants of body height and utilized military records to draw regional differences, time-trends, and socio-economic patterns in heights (Le Roy Ladurie et al. 1969). But it was only at end of the 1970s, in the field of Cliometrics,3 that the study of body height as an indicator of living standard took definitely off. Usually, the highly controversial study of Fogel and Engermann (1974) about American slaves’ nutritional status is acknowledged as the starting point of modern anthropometric history (Steckel, 1998). Since then, the study of anthropometric history contributed substantially to issues such as slavery, mortality, inequality, and living standard during industrialization (Steckel, 1998). Milestones in anthropometric history are the studies of Robert Fogel and Dora Costa who investigated the relationship between technological progress and improvements in human longevity, the socalled “technophysio evolution” (Fogel and Costa, 1997). According to their view advances in technology allowed for (i) a larger production of calories for human consumption and (ii) improvement in the treatment of infectious diseases (Fogel, 1994; Sunder, 2005). Both factors contributed to the physical evolution of human beings and established an inverse relationship between body height Cliometrics refers to the systematic use of economic theory and econometric techniques to the study of historical economic processes. The name Cliometrics derives its origin from the Greek muse of history Clio.. 3. 3.
(8) and mortality. Fogel in his Nobel prize lecture4 stressed how height and weight at given ages, and Body Mass Index (BMI)5 can be effective predictors of the risk of morbidity and mortality (Fogel, 1994). Yet, more recent research on the relationship between height and mortality provide contrasting results. Costa (2003) using a larger sample of a previous study (Costa, 1993) no longer finds a height-mortality association. Using another historical sample also Murray (1997) finds no association between height and all-cause mortality. Sunder (2005) using a cross-section of adult white Americans for the period 1971-1975 provides only weak evidence of a negative association between height and mortality. As pointed out by Steckel (1998), the rise of anthropometric history “was boosted by a general disaffection with national accounting” and the need to supplement it with more comprehensive indicators of well-being. This disaffection is exemplified by the pursuit of alternative well-being indicators such as the Physical Quality of Life Index (PQLI) put forward in 1977 by the NorthAmerican Overseas Development Council and the best known Human Development Index (HDI) created by the United Nations.6 Physical stature is a valid supplementary indicator of human well-being as it provides an historical record of nutritional status until adulthood and—as remarked by Steckel (1998, p. 807)—“even though far from comprehensive, everyone would agree that nutritional status is an important aspect of the standard of living”. Further, given the high share of household income spent on nutrition and the frequent lack of classical economic indicators for the period before the middle of the nineteenthcentury, one can understand why anthropometric history progressively gained consideration in the field of economic history and development economics in the last decades.7 The investigation of nutritional status proved particularly useful when applied to the study of the standard of living during the industrial revolution. Economic In 1993 the Sveriges Riksbank Prize in Economic Sciences in Memory of Alfred Nobel was awarded to Robert W. Fogel and Douglass C. North “for having renewed research in economic history by applying economic theory and quantitative methods in order to explain economic and institutional change”. 5 The BMI is defined as weight in kilograms divided by the square of height in meters. 6 The PQLI combines infant mortality rate, literacy rate, and life expectancy at age one. The HDI weighs life expectancy, literacy, and income. 7 About the use of body height in development economics you are referred to the literature review of Strauss and Thomas (1998). 4. 4.
(9) indicators such as consumption, real wages, income inequality, and life expectancy for many countries are scattered for the period before the middle of the nineteenth-century. Furthermore those indicators, when available, generally ignore entire segments of the population such as individuals outside the labor force and children. Clearly the literature has focused largely on the effects of the British industrial revolution and a long debate between optimists and pessimists flourished in the last two decades (Feinstein, 1998). Evidence on nutritional status in England, United States and several other European countries provides support to the pessimistic view about the impact of the industrial revolution on the standard of living (Komlos, 1998). A generalized decrease in average nutritional status characterized several economies starting from the second quarter of the nineteenth-century (Steckel, 1998). Since some classic economic indicators were found to trend upwards in some countries during the early industrialization period,8 the findings about decreasing heights challenged previously established beliefs. The divergent pattern of heights and economic output has been termed by Komlos the “early industrial growth puzzle” (Komlos, 1998). In the first two chapters of this dissertation we shall join the ongoing debate between optimists and pessimists and we shall provide new evidence about the anthropometric history of Saxony which was the pioneer region in the German modern economic growth (chapter 1). We shall see that the pattern of industrialization undertaken by Saxony resembles to a large extent the British experience characterized by high rate of population growth, large share of urban population accompanied by a rapid market integration. In chapter 2 we shall shed new light on the anthropometric history of industrializing Britain taking a clear position in the debate between optimists and pessimists. We provide new evidence about the negative effects of urbanization; the possible role played by the enclosures in deteriorating the standard of living of agricultural laborers is further explored. Body height is the outcome of a given genotype9 and environmental factors. These two elements—nature and nurture—are also correlates of individual 8 9. Notably in England and in North-America. The genotype is the genetic constitution of an individual.. 5.
(10) unobserved abilities which, in turn, have a direct impact on labor outcomes. Therefore height is also considered as an input variable which determines economic outcomes. In the field of labor economics scholars have tried to understand why tall stature is associated with higher economic success in terms of higher wages (Persico et al. 2004; Case and Paxson, 2006). Scholars have been also interested in assessing the mechanism underlying the transfer of human capital and economic status (Currie and Moretti, 2007). Knowledge about these mechanisms with the subsequent enhancement of economic policies directed to favor intergenerational social mobility is, needless to say, extremely worthwhile. In this fashion, body height was found to be positively associated with intelligence and cognitive abilities (Tanner, 1989). Yet, it is unclear which factor among nature and nurture (or which combination of the two) is prevalent at the basis of this correlation. Studies in favor of the nurture-effect stress the link between nutrition and cognitive development (Lynn, 1989; Kretchmer et al., 1996). For instance, the cognitive development of initially growth-retarded children was shown to benefit significantly from better nutrition (GranthamMcGregor 2002). Conversely, body height and cognitive abilities could be both subject to the same chemical channels (Berger, 2001; Richards et al. 2002). Results on genetic linkages between height and cognitive abilities are mixed: a Norwegian twin study suggests that overlapping genetic factors explain circa one third of the correlation between height and cognitive abilities (Sunder et al. 2005). Silventoinen et al. (2000), and Magnusson and co-authors (2006) do not find evidence of genetic overlapping. Instead, there is a broad agreement about the fact that nutrition and health affect cognitive abilities throughout childhood (Walter, 1993; Pollitt and Mathews, 1998). Therefore children with low levels of cognitive development unlikely will be able to catch-up with their peers. Interactions between genetics and environment have also to be taken into account as the genotype determines the response to the environment (Silventoinen, 2003; Steckel, 1995). A given environmental factor can have different effects as people can be genetically more sensitive to external factors. In this respect, heights of men were found to increase more rapidly than those of women in twentieth-century England and Wales (Kuh et al., 1991). There is also. 6.
(11) some evidence about higher resistance of women against starvation and other sources of stress.10 Social norms and applied psychology can contribute to explain why taller stature is associated with economic success. Evolutionarily, high physical stature represented an important advantage due to higher leverage and more physical strength. We can argue that this evolutionary advantage in physical strength translated today into a psychological advantage. Observations on social interactions seem to suggest the existence of an “equation” which links body height to social power (Judge and Cable, 2004). For instance, taller men have been shown to have greater ability to attract mates (Nettle, 2002) and having higher likelihood of getting married (Harper, 2000). Taller people tend to obtain higher respect and regard from the surrounding society (social-esteem) which in turn enhance people own self-esteem (Judge and Cable, 2004). Social- and selfesteem in the form of leadership and motivation have a direct effect on jobperformances which then translate into economic success. In the third chapter of this dissertation we shall provide new evidence about the correlation between body height and cognitive abilities for a selected group of European countries. This correlation will be exploited in order to assess whether the positive effect of height on earning potential is in place because body height is a biological marker for higher cognitive abilities, or rather, because employers tend to discriminate against shorter workers on account of the equation which links height and social power. We shall unveil the magnitude of the effect of height on earning potential and assess the extent of wage discrimination by height which affects male and female labor market. Finally, we shall provide substantive evidence about the role that body height plays in occupational sorting, uncovering different regional patterns across Europe which might inspire future research on this field of investigation.. 10. See Silventoinen (2003) on gene-environment interaction, p. 274-275.. 7.
(12) References Berger, A. (2001). Insulin-like growth factor and cognitive function. BMJ, 322203. Case, A., & Paxson, C. (2006). Stature and Status: Height, Ability, and Labor Market Outcomes. NBER Working Paper Series, 12466. Costa, D. L. (2003). Understanding mid-life and older age mortality declines: evidence from Union Army veterans. Journal of Econometrics, 112(1), 175-192. Costa, D. L. (1993). Height, weight, wartime stress, and older age mortality: evidence from the Union Army records. Explorations in Economic History, 30, 424-449. Currie, J., & Moretti, E. (2007). Biology as Destiny? Short- and Long-Run Determinants of Intergenerational Transmission of Birth Weight. Journal of Labor Economics, 25, 231-264. Eveleth, P. B., & Tanner J.M. (1976). Worldwide variation in human growth. Cambridge: Cambridge University Press. Fogel, R. W. (1994). Economic Growth, Population Theory, and Physiology: The Bearing of Long-Term Processes on the Making of Economic Policy. American Economic Review, 84(3), 369-395. Fogel, R. W., & Costa, D. L. (1997). A Theory of Technophysio Evolution, With Some Implications for Forecasting Population, Health Care Costs, and Pension Costs. Demography, 34(1), 49-66. Fogel, R. W., & Engermann, S. L. (1974). Time on the cross: The economics of American Negro slavery. Boston: Littele, Brown. Grantham-McGregor, S. (2002). Linerar growth retardation and cognition. Lancet, 359-542. Harper, B. (2000). Beauty, Stature and The Labour Market: A British Cohort Study. Oxford Bulletin of Economics and Statistics, 62, 773-802. Judge, T. A., & Cable, D. M. (2004). The Effect of Physical Height on Workplace Success and Income: Preliminary Test of a Theoretical Model. Journal of Applied Psychology, 89(3), 428-441.. 8.
(13) Komlos, J. (1998). Shrinking in a Growing Economy. The Mystery of Physical Stature during the Industrial Revolution. Journal of Economic History, 58, 779802. Komlos, J., & Snowdon, B. (2005). Measures of Progress and Other Tall Stories. World Economics, 6(2), 87-135. Kretchmer, Beard, J. L., & Carlson, S. (1996). The Role of Nutrition in the Development of Normal Cognition. American Journal of Clinical Nutrition, 63, 997-1001. Kuh, D., Power, C., & Rodgers, B. (1991). Secular trends in social class and sex differences in adult height. International Journal of Epidemiology, 20, 1001-1009. Ladurie, E. L., Bernageau, N., & Pasquet, Y. (1969). Le Conscrit et L'ordinateur. Perspectives de Recherches sur les Archives Militares du XIX Siècle Français. Studi Storici, 10(2), 260-308. Lauderdale, D. S., & Rathouz, P. J. (1999). Evidence of environment suppression of familial resemblance: height among US Civil War brothers. Annals of Human Biology, 26, 413-426. Lynn, R. (1989). A nutrition theory of the secular increases in intelligence, positive correlation between height, head size and IQ. British Journal of Educational Psychology, 59, 372-377. Magnusson, P. K., Rasmussen, F., Gyllensten, U. B. (2006). Height at Age 18 Years is a Strong Predictor of Attained Education Later in Life: Cohort Study of Over 950000 Swedish Men. International Journal of Epidemiology, 35(January), 658-663. Mueller, W. H. (1976). Parent-child correlations for stature and weight among school aged children: a review of 24 studies. Human Biology, 48, 379-397. Murray, J. E. (1997). Standards of the present for people of the past: height, weight, and mortality among men of Amherst college 1834-1949. Journal of Economic History, 57(3), 585-606. Nettle, D. (2002). Women's Height, Reproductive Success and the Evolution of Sexual Dimorphism in Modern Humans. Proceedings of the Royal Society of London, B 269, 1919-1923.. 9.
(14) Persico, N., Postlewaite, A., & Silverman, D. (2004). The effect of adolescent experience on labor market outcomes: the case of height. Journal of Political Economy, 112(5), 1019-1053. Pollitt, E., & Matthews, R. (1998). Breakfast and Cognition: An Integrative Summary. American Journal of Clinical Nutrition, 67(4), 804S-813S. Richards, M., Hardy, R., Kuh, D. et al. (2002). Birthweight, Postnatal Growth and Cognitive Function in a National U.K. Birth Cohort. International Journal of Epidemiology, 31(April), 342-348. Silventoinen, K. (2003). Determinants of variation in adult body height. Journal of Biosocial Science, 35, 263-285. Silventoinen, K. (2000). Body-height: Determinants and Association with Social Position and Adult Health. Department of Public Health, University of Helsinki Silventoinen, K., Kaprio, J., Lahelma, E. et al. (2000). Relative effect of genetic and environmental factors on body height: differences across birth cohorts among Finnish men and women. American Journal of Public Health, 90, 627630. Steckel, R. H. (1995). Stature and the standard of living. Journal of Economic Literature, 33, 1903-1940. Steckel, R. H. (1986). Birth Weights and Infant Mortality among American Slaves. Explorations in Economic History, 23(2), 173-198. Steckel, R. H. (1998). Strategic Ideas in the Rise of the New Anthropometric History and Their Implications for Interdisciplinary Research. Journal of Economic History, 58(3), 803-821. Strauss, J., & Thomas, D. (1998). Health, Nutrition, and Economic Development. Journal of Economic Literature, 36(2), 766-817. Sunder, M. (2005). Toward generation XL: Anthropometrics of longevity in late 20th -century United States. Economics and Human Biology, 3(2), 271-295. Sunder, J. M., Tambs, K., Harris, J. R. et al. (2005). Resolving the Genetic and Environmental Sources of the Correlation Between Height and Intelligence: A Study of Nearly 2600 Norwegian Male Twin Pairs. Twin Research and Human Genetics, 8, 307-311.. 10.
(15) Tanner, J. M. (1989). Foetus into Man: Physical Growth from Conception to Maturity. Cambridge: Harvard University Press. Villermé, L. R. (1829). Mémoire sur la Taille de l'Homme en France. Annales d'Hygiène Publique et de Médicine Légale, 1, 351-397. Walter, T. (1993). Impact of Iron Deficiency on Cognition in Infancy and Childhood. European Journal of Clinical Nutrition, 47, 307-316.. 11.
(16) Chapter 1 On the Road to Industrialization: Nutritional Status in Saxony, 16901850 1.1 Introduction The study of the effects of the industrial revolution on the living standards of the working class has involved much scholar attention. For obvious reasons much of the research has been devoted to the British industrial revolution and a long debate between optimists and pessimists characterized the literature in the last two decades. The formers found support in real wage estimates which suggested a significant amelioration of the standard of living for the period 18201850 (Lindert and Williamson, 1985). Successive revisions of the wage series and new studies on intra-household allocation moved the balance towards a more pessimistic view about the effects of the British modern economic growth (Crafts, 1985; Feinstein, 1998; Horrell and Humphries, 1992). In order to provide further evidence, classic economic indicators have been complemented by demographic and anthropometric measures. Indeed, the concept of the.
(17) standard of living can be considered as multidimensional where nutrition constitutes an important component given the link between nourishment, health and productivity (Fogel, 1994). In the literature physical stature emerged as a reliable indicator of an individuals’ nutritional status. In particular height is an indicator of an individual’s nutritional status net of claims from the basal metabolism, epidemiological stress, and workload (Komlos, 1989; Steckel, 1995). The concept of nutritional status is also often associated with the biological standard of living. In this article we shall use the two concepts interchangeably. The genetic component is certainly the most important determinant of final height but this factor cancels out when comparing averages over time or between homogenous populations. Socio-economic conditions during early childhood and adolescence are expected to have a strong impact on the final attainment of height (Steckel, 1995; Silventoinen, 2003). Therefore the study of average height of a population in a cross-section and over time permits to obtain insights about the living standards across different social groups and their temporal dynamic. Given the large share of income spent on purchasing food, real wage constitutes an important determinant of the nutritional status. Nevertheless, issues such as demographic growth, urbanization, child labor and the effect of the relative price of food could counteract a possible rise of the real wage. This is one of the explanations at the base of the so-called early industrialization puzzle, a period characterized by a divergence between increasing economic output and decreasing nutritional status (Komlos, 1998). In this respect, declining trends in height have been established for many European countries for the period 18201850.1 A common denominator for these countries is the rapid demographic growth and increase in urbanization that occurred in the first half of the nineteenth-century. The rise of population density with the consequent pressure on food resources determined an increasing trend in food prices which started to affect the European economies already during the last decades of the eighteenthcentury. In the subsequent period the detrimental effect of urbanization and the. For the United Kingdom see Floud, Wachter and Gregory (1990), Komlos (1993), and Cinnirella (2007); for the Habsburg-Austrian Empire Komlos (1985); for Northern Italy A’Hearn (2003); for Sweden Sandberg and Steckel (1987); for the Netherlands Drukker and Tassenaar (1997). 1. 13.
(18) rapid increase of the price of food in terms of other goods—for instance clothing—outweighed even a possible increment of the income per capita. The study of the living standards in Germany during the industrial revolution has to follow necessarily a regional approach. The economic history of Germany before the political unification in 1871 is a regional history as Germany was divided into numerous independent principalities which formed the Holy Roman Empire. The Empire was characterized by a very heterogeneous economic structure and different growth patterns were undertaken during the century 1750-1850 (Lee, 1988; Tipton, 1976). Saxony, together with the Rhineland, started her industrialization process relatively early. Many scholars consider Saxony the pioneer region in the German modern economic growth (Kiesewetter, 1988). In this article we shall investigate the effects of the early industrial growth on Saxons’ nutritional status. The analysis of physical stature is particularly valuable here as economic data for the earlier decades of the nineteenth-century are scant. There are no reliable series on economic output for Saxony for the period before 1850 and evidence on wages and prices are limited to some selected sectors and few cities in Germany. The analysis of the nutritional status will then permit to shed some light on the evolution of the biological standard of living during the early industrial growth and to analyze differences among economic areas and social groups within Saxony. Our analysis is particularly valuable as we shall trace the nutritional status back to the protoindustrial period of the eighteenth-century. Saxony was, after France, the second earliest country in collecting systematic information about its soldiers. To our knowledge there are no other cliometric studies that can extend the analysis to such an extent. An important study in German anthropometric history focuses on cohorts born in the period 1725-1794 in southern Germany, namely Bavaria and Palatinate (Baten, 2001). Those regions differ markedly from Saxony as their economies were prevalently based on agriculture throughout the whole nineteenth-century. We shall see that there are significant differences between the trends in nutritional status followed by Saxony and southern-Germany, due to the different industrialization patterns undertaken. In some respects the process of industrialization in Saxony resembles the English paradigm: (i) an exceptionally strong demographic growth with a relatively high degree of urbanization, (ii) a robust textile sector, and (iii) a 14.
(19) relative rich endowment of raw materials (ore-mountains in the south). In the last three decades of the eighteenth-century Saxony could already enumerate several textile factories, a trend that was strengthened significantly during the Napoleonic period.2 Yet, the early industrial growth in Saxony can be identified in the first half of the nineteenth-century. In 1815 the share of cotton spindles accounted for 80 percent of the whole Germany, in 1845 around 60 percent (Kiesewetter, 2004). Already in the middle of the nineteenth-century, the share of population employed in industry (45.6 percent) was larger than the share employed in agriculture (37.4 percent). It is important to note that, for the same period, in Germany the share of population employed in industry was only 24.5 percent.3 As mentioned, the exceptional rise of population in Saxony constitutes another important parallel with the British industrialization pattern. For the period 1775-1811 the population grew at an annual rate of about 0.52 percent, whereas in the successive period 1815-1830 the rate increased to 1.16 percent which implies a doubling population in about 60 years; in England the annual rate was 0.83 percent for the period 1751-1801. Also the rate of urbanization was unusually high in Saxony with respect to the rest of Germany. In the period 1800-1830, the share of British population living in urban areas was 38.7 percent (Steckel, 1999); in Saxony for the same period circa 32 percent (Kiesewetter 1988, p.220). Given the increase of urban inhabitants of circa 19.5 percent between 1815 and 1830, the rate of urbanization was above the average in the area of Dresden (21.7 percent) and Chemnitz (23.3 percent).4 In 1815, following the decisions taken at the Congress of Vienna, Saxony had to cede circa three-fifths of its land to Prussia, diminishing significantly its territorial extension (see figure 2 in the following section). As the territories ceded were the northern ones prevalently utilized in agriculture, this change had a strong impact on food production and consequently on the amount of food imports. Between 1814 and 1815 total population decreased by 39 percent while the production of rye decreased by 49 percent, wheat by 61 percent, barley by 58. Forberger (1958) reports that 170 new big factories were founded in the whole 18th century; 101 of those had been founded between 1771 and 1800. 3 See Tipton (1976). Unfortunately the shares for the whole Germany include also Saxony. 4 See Kiesewetter (1988) chapter VII. 2. 15.
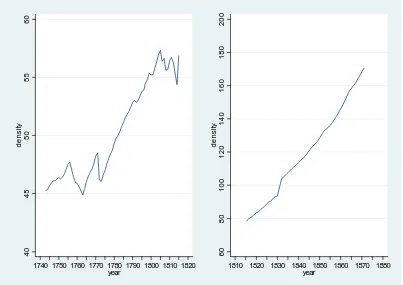
(20) 60. 40. 80. 45. 100. density 50. density 120 140. 160. 55. 180. 60. 200. percent, oats by 45 percent, and potatoes by 37 percent (Kiesewetter 1988, p.278). Thus, only the production of potatoes could keep pace with the population change, whereas the largest loss was in terms of wheat which was also the most expensive cereal. Obviously this territorial change increased also the population density. In 1816 Saxony had circa 79.6 inhabitants per square kilometers, a measure second only to Alsace-Loraine which had a population density of 88.2. In 1871 Saxony would have reached the highest population density of the whole unified Germany (figure 1).. 1740 1750 1760 1770 1780 1790 1800 1810 1820 year. 1810 1820 1830 1840 1850 1860 1870 1880 year. Figure 1. Population density in Saxony Source: Schirmer (1996); Kiesewetter (1988).. 16.
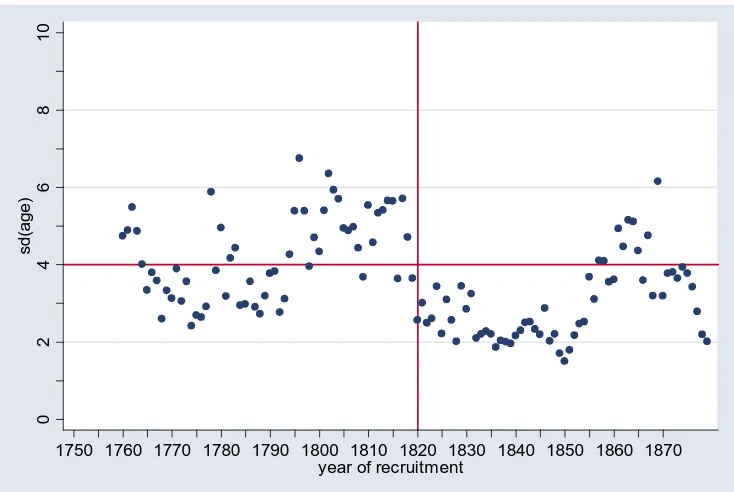
(21) 1.2 Data and statistical issues Saxony, despite its limited geographic extension, had a relatively large army. Among the eighteenth-century European kingdoms, the Saxon army was the third force after Austria and Prussia in terms of number of soldiers per working inhabitant (table 1). Important for our purposes, it was also the second in history after France in recording systematic information about its soldiers: the French army started in 1716 whereas the Saxon army in 1730. The recruitment of soldiers, until the Napoleonic period, was based partly on volunteers and partly on a mandatory system (Kroll 2006, p. 63). Individuals who belonged to specific economic sectors—such as farm owners, master craftsmen, artists, students, and selected manufacturing—were exempted from recruitment.5 Therefore our sample is representative of the poorer social stratum composed mainly by daily laborers, simple craftsmen, domestic workers and unemployed people. We collected information on more than 70 thousand soldiers, covering a very large period which spans from those born in the 1690s until the cohorts born in the1840s. Our principal sources are the recruitment lists, originally kept in the State archive in Dresden, which contain detailed information about physical stature and various socio-economic variables. Around 64 percent of the soldiers are adults (age 23-49), 32 percent youths (age 18-22), and the rest below the age of 18 or over 50 years. The recruitment lists report also the full names (first, second and family name), military rank, age, height in Saxon inches (1 inch ≈ 2.3686 cm), and origin. About 44 percent of the recruits reported a previous occupation. The birth years were recovered through the date of enlistment and the reported age. Due to the fact that the recruitment lists provide stock information, we encountered circa 4,000 duplicates which means that the same soldiers were present in more than one list. We could identify duplicates crossing the registry names, birth year, and provenance. Once identified, we retained the individual observed lastly, eliminating the others. As for some soldiers height was measured in different points in time—generally two or three times—with this strategy we retain the observations with the most updated information. Anyway, for the large majority of the duplicates differences in height are equal to zero;. 5. See Kroll (2006) and Forberger (1958).. 17.
(22) differences are noteworthy, in the range of 2-3 Saxon inches, when soldiers were measured before adulthood and later when their physical maturity was reached. The literature on anthropometric history is plentiful of truncated height distributions and our new dataset is not an exception. European armies tended to accept only recruits whose height was above a certain minimum standard. The Saxon government considered important to have a particularly tall army both for representation and practical purposes.6 We carefully examined height distributions grouped by recruitment year in order to identify the effective minimum height requirement (henceforth MHR) applied in different point in time.7 Table 1. Size of selected European armies in 1790 Country Russia Austria France Prussia Kurpfalz-Bayern Saxony. Country size in miles square 305,000 12,281 10,200 3,600 1,064 736. Population (Mil.). Serving soldiers. Soldier per inhabitant. 24,0 19,0 25,0 6,0 2,0 1,895. 224,500 297,000 182,000 190,000 12,200 24,600. 1:91 1:64 1:140 1:32 1:164 1:73. Soldier per working inhabitant 1:33 1:24 1:52 1:12 1:62 1:28. Source: Kroll (2006), p. 73.. We found that, besides being function of time periods, the MHRs changed also according to military rank. Furthermore, from a closer inspection of height distributions it clearly appears that, after the Napoleonic period, the recruiting process has changed quite dramatically. Indeed, there is a shift in the age composition of the army for those cohorts recruited after the Congress of Vienna. It is important to remember that the Saxon army during the period 1806-13 was assimilated under La Grande Armèe. All the European states after the Napoleonic period, including Saxony, moved towards a system of universal. For example taller people were more able to reload the bayonets. See Kroll (2006). When there is universal conscription at a given age, height distributions by recruitment year or by cohort are not different. But when, as in Saxony before Napoleon, the recruitment is also based on volunteers of different ages, height distributions should be inspected by recruitment year in order to avoid misspecification of the MHR.. 6 7. 18.
(23) conscription for the army, with the notable exception of the British army.8 The mean age for the period before 1815 is 27.3 years, whereas the same statistic for the post-Napoleonic period is 24.2 years. For the last birth-cohort considered in this article, 1840-49, the mean age is 20.8 years (n = 1,245). The minimum height requirements changed quite dramatically between the two periods: After 1815, in circa 85 percent of the cases a MHR of 68 Saxon inches was applied (≈ 161 cm), whereas for those recruited before Napoleon a MHR of 70 inches (≈ 166 cm) or 72 inches (≈ 170 cm) was mainly enforced. Besides the French Wars, height standards were lowered also during other war periods such as the Seven Years’ War in 1756-63. In the two recruitment years which precede the war we observe distributions truncated at about 68 inches (circa 160 cm). The need of a larger army in prevision of the war provides a reasonable explanation for such low height standard.9 The changes in the recruiting practices that took place under Napoleon and after 1815 have to be taken into due consideration in order to avoid estimating artificial height fluctuations. Furthermore, the exogenous shock of the territorial loss consequent to the Congress of Vienna renders eighteenthcentury Saxony hardly comparable with the later period. Then, we decided to analyze the period pre- and post-Napoleon separately. Secular trends in nutritional status will be estimated through separate regression analysis. The mean of a left-truncated distribution is clearly upwardly biased. Several statistical methods have been proposed to obviate to this problem (Komlos, 2004). In the related literature there is a widespread consensus about the superiority of the Truncated Maximum Likelihood Estimator (TMLE) with respect to other estimators (A’Hearn, 2004; Heintel, 1998; Komlos, 2004). The TMLE is based on the normality assumption and the probability density function of the dependent variable is standardized by the probability that the variable is observable, i.e. the soldiers’ physical stature is greater than the truncation point. Contrary to other estimation methods, the TMLE estimator permits to run multiple regression models. It provides unbiased results and allows defining a 8 The model of army followed by Saxony after 1815 was the French one with a relatively long service (around 8 years) with a strict selection and the possibility of substitutions. An individual initially chosen for the army could pay a second person in order to substitute for him. For a comparison between European army systems see Ilari (1989). 9 For a detailed description of the history of the Saxon army in the eighteenth-century see Kroll (2006).. 19.
(24) flexible truncation point which can vary according to military rank and recruitment period. A’Hearn (2004) showed that when the truncation point is allegedly close (or above) the true population mean, one obtains more precise estimates restricting the population standard deviation to a fixed value. In such a case we have the Restricted TMLE. Our eighteenth-century height distributions show a fairly high truncation point which can be reasonably assumed to be close to the true population mean. Therefore in estimating the trend in nutritional status for the eighteenth-century we do constrain the standard deviation of the adult population to the value of 6.86 cm as suggested by Komlos (2003) and A’Hearn (2004). Conversely, we do not constrain the population standard deviation for the nineteenth-century sub-sample given the significantly lower truncation points evidenced before. The boundaries of Saxony changed through the period considered in this article. After the French Wars Saxony, following the decisions taken at the Congress of Vienna, was forced to cede its northern part to Prussia (figure 2). In the sake of simplification we categorized counties and macro-areas according to the actual administrative boundaries. We could codify around 82 percent of the reported origins which we assume being the soldiers’ birthplace. In particular, since in the regression analysis we want to control for the area of origin, we divided the Saxon territory into three macro-areas according to the economic structure: (i) the textile district which includes the south-western part of the Vogtland with the towns of Chemnitz and Zwickau; (ii) the mining area of the southern ore mountains (Erzgebirge); (iii) the rural area which embraces the remaining northern and eastern part with two large urban centers such as Dresden and Leipzig. This categorization aims to capture the effects of an agricultural or industrial area on the individual’s nutritional status in terms of economic prosperity but also of epidemiological environment. A separate dummy variable for urbanization is also used. It groups the four largest and rapidly growing towns: Dresden, Leipzig, Chemnitz, and Zwickau.. 20.
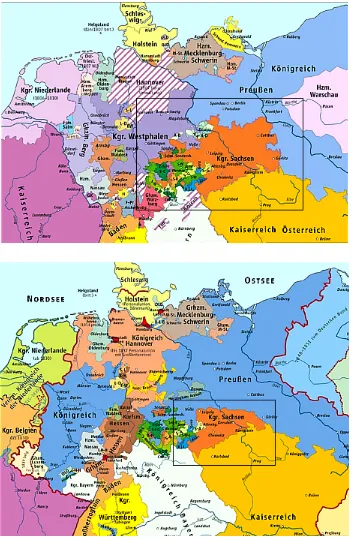
(25) Figure 2. The Kingdom of Saxony in the Confederation of the Rhine 1808 before the territory loss (panel above) and in the German Confederation 1815-1866 (panel below) Source: Klaus Günter Berger from Putzger (1965).. 21.
(26) As shown in table 2, the three selected areas are fairly covered: about two-thirds of the soldiers came from the rural district, whereas the remaining of the sample is equally split between the textile and the mining district. This composition changes slightly across the two sub-periods with an increase in the two industrial districts with respect to the rural area in the later period. This change is consistent with the Saxon demographic evolution. In the early industrialization period higher marriage and fertility rates were registered in western and southern areas which were the areas with the fastest rate of industrialization (Tipton, 1976). The occupation reported by the soldiers is expected to mirror the socioeconomic background in which the individual was raised.10 Clearly, it is an important determinant of the individual nutritional status. Therefore we created eight occupational categories (plus a ninth category for people who did not state a previous occupation) to employ in our regression model: (i) educated people such as engineers, physicians, and musicians; (ii) people employed in agricultural activities; (iii) occupations that entail a direct access to food (bakers, butchers, etc.); (iv) craftsmen; (v) people employed in factories or mining; (vi) textile workers; (vii) employed in the service sector and (viii) unskilled. Due to our ad hoc definition of occupations which is functional to the next regression analysis, a comparison of the sample occupational break-down with that provided by the Saxon census of the year 1849 is rather difficult. Nevertheless, the composition of our sample is surely biased towards the secondary sector and the share of those employed in agriculture is definitely under-sampled.11 But the distribution within the industrial employment is fairly similar to that reported in the Saxon census, in particular the supremacy of the textile sector with respect to the other manufacturing.12. We assume a low degree of intergenerational mobility. According to the figures of the census, in 1849 the occupational distribution was 37.4 percent in agriculture, 45.6 percent in industry, and 17.0 percent in the service sector (Tipton 1976, p.185). 12 Within manufacturing, textile and clothing accounted for more than 75 percent (Tipton 1976, p.185). 10 11. 22.
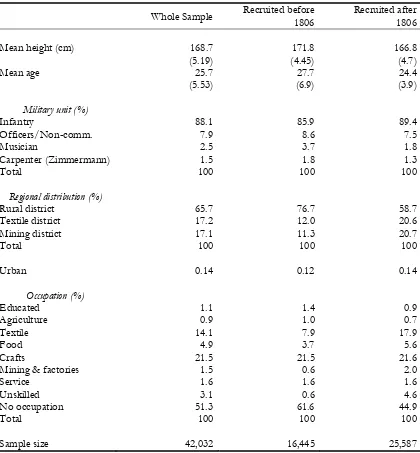
(27) Table 2. Descriptive statistics Whole Sample. Recruited before 1806. Recruited after 1806. 168.7 (5.19) 25.7 (5.53). 171.8 (4.45) 27.7 (6.9). 166.8 (4.7) 24.4 (3.9). Military unit (%) Infantry Officers/Non-comm. Musician Carpenter (Zimmermann) Total. 88.1 7.9 2.5 1.5 100. 85.9 8.6 3.7 1.8 100. 89.4 7.5 1.8 1.3 100. Regional distribution (%) Rural district Textile district Mining district Total. 65.7 17.2 17.1 100. 76.7 12.0 11.3 100. 58.7 20.6 20.7 100. Urban. 0.14. 0.12. 0.14. Occupation (%) Educated Agriculture Textile Food Crafts Mining & factories Service Unskilled No occupation Total. 1.1 0.9 14.1 4.9 21.5 1.5 1.6 3.1 51.3 100. 1.4 1.0 7.9 3.7 21.5 0.6 1.6 0.6 61.6 100. 0.9 0.7 17.9 5.6 21.6 2.0 1.6 4.6 44.9 100. 42,032. 16,445. 25,587. Mean height (cm) Mean age. Sample size Note: Standard deviation in parenthesis. Source: Saxon army.. 23.
(28) 1.3 Nutritional status, 1680-1784 This new dataset represents the second earliest military record used so far in anthropometric history.13 We can estimate the secular trend in nutritional status starting with the cohorts born in the last decade of the seventeenth-century. Recruits younger than 18 years are not considered here as they were formally not allowed to join the army. Further, from the inspection of their height distribution it is not clear which criteria were followed to let them pass the physical examination.14 With respect to the army units, the regression sample includes infantry, officers (and non-commissioned officers), musicians, and carpenters. In the sake of estimates accuracy we disregard also grenadiers and cavalry because of their upward biased physical stature (with respect to the other units) and odd distributions which do not allow a precise definition of their MHR.15 In the previous section we mentioned the substantial differences between pre- and post-Napoleon Saxony, and in particular the changes occurred in the armyrecruiting process. Thus, for the analysis of the eighteenth-century we decided to constrain the regression sample to those soldiers recruited before 1806. We estimate the mean height using the restricted TML estimator constraining the population standard deviation to the value of 6.86 cm as the truncation points are allegedly close to the true population mean. Indeed, considering the subsample recruited before 1806 we found that in 25 percent of the cases it was applied a minimum height requirement of 72 Saxon inches (≈ 170 cm!) and of 70 inches (≈ 166 cm) in other 65 percent of cases. These remarkably high standards justify the adoption of a truncated regression with a constrained standard deviation. The trend in nutritional status is estimated regressing physical height on a set of dummy variables indicating the birth decade, age, military rank, origin, and occupation. We also use a dummy variable to control for urbanization, grouping the four principal Saxon towns.16 The usual assumption of independence among observations could be violated as the outcome of individuals with the same origin—therefore sharing the same economic framework and epidemiological Komlos (2003) analyzed French soldiers born between 1660 and 1760. The share of soldiers younger than 18 years is anyway negligible. 15 Their inclusion does not alter qualitatively our results. 16 The towns are Dresden, Leipzig, Chemnitz and Zwickau. 13 14. 24.
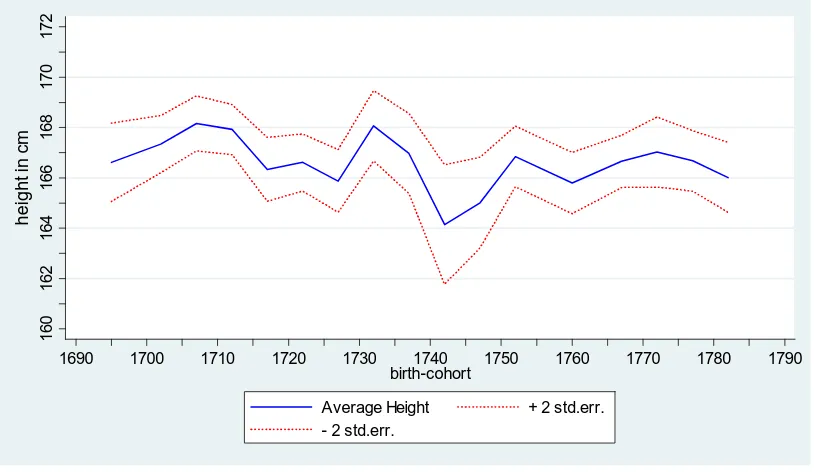
(29) environment—could be correlated. To obviate to this problem the regression standard errors are adjusted for clustering, i.e. we allow for correlation among individuals within the same county (landkreis) maintaining the assumption of independence between counties. In table 3 we report the estimates for the period 1690-1784. The coefficients linked to the birth-cohorts indicate the variation in height with respect to the reference birth-cohort, 1760-69. The estimated trend is displayed in figure 3. The trend of nutritional status shows cycles which, to some extent, were already found in studies focusing on other European countries.17 Average nutritional status increased from the last decade of the seventeenth-century for almost 20 years, a period of particularly good harvests. The cohorts born around 1710 reached the remarkable measure of 168 cm. Thereafter we find a local minimum which affected the cohorts born during the 1720s; such negative swing is coherent with recent findings about the anthropometric history of England and Ireland which experienced a similar downturn for the same period.18 The subsistence crisis of the period 1725-29 in England and Ireland, supported by record-high crude death rate and declining real wage, seems to have occurred also in Saxony. After a fast recovery, a remarkable worsening in average nutritional status is also estimated for the cohorts born in coincidence with the Austrian Succession War, 1741-1748.19 In that period the Saxon people reached the lowest measure of the whole eighteenth-century. One could argue that the low point for the period 1740-45 could be due to the recruitment that took place during the Seven Years’ War (1756-1763). We can discard this argument as we found no significant correlation between the cohorts born in 1740-45 and the recruitment of the Seven Years’ War. Also the insertion of a control variable for the recruitment during the Seven Years’ War does not alter the previous findings.. For studies on height cycles see Woitek (2003). See Komlos and Cinnirella (2005). 19 In the period analyzed in this article, three wars had a large impact on Saxony: (i) the Austrian Succession War (1741-1748); (ii) the Seven Years War (1756-1763), and (iii) the Napoleonic Wars (1793-1815). 17 18. 25.
(30) 172 170 168 166. height in cm. 164 162 160 1690. 1700. 1710. 1720. 1730. 1740 1750 birth-cohort. Average Height - 2 std.err.. 1760. 1770. 1780. 1790. + 2 std.err.. Figure 3. Height trend, 1695-1785 Note: Standardized for adults (23-49), infantry, craftsmen, born in the textile district. Standard errors are adjusted for clustering and account for the estimated covariance with the constant. Source: Table 3.. Unexpectedly, the Seven Years’ War did not have such a disruptive effect as the Austrian Succession War. The nutritional status of those born around 1760 is not significantly lower than the contiguous cohorts. Indeed, the Seven Years’ War had a strong economic and demographic impact in Saxony. In fact, the war determined the bankruptcy of the Saxon government, and more important, some calculations impute a loss of around 100 thousands human lives which accounted for 6 percent of the total population (Schirmer, 1996). Because of the war, Saxony had in 1763 the same population level as of the 1740s. How can we reconcile this evidence with a nutritional status that shows no substantial decline for that period? We hypothesize that the Seven Years’ War, with the subsequent loss of population, acted as a sort of Malthusian check. A lower population density meant a lower pressure on food resources and therefore an easier access to food. Statistics on wheat and rye prices partially support this hypothesis as the level of these prices in the central years of the war (1757-1760) was similar to the period before it (Elsas, 1940). In favor of our hypothesis, marriage rates did not sink as one would expect, but instead peaked in the years 1760 and 1761. The average marriage rate in the period 1756-1763 was 9.87; in famine years, 1771-72, 26.
(31) average marriage rate declined to 6.51.20 Furthermore, wages might have also increased: Evidence on the Malthusian effect of wars and epidemics is provided by Clark (2007). He shows that in the presence of sudden population losses— due for example to the Black Death and recurrent famines in the period 13501430—nominal wages increased in response to shortage of labor supply.21 We argue that the same Malthusian dynamic may have acted in Saxony during the Seven Years’ War. As mentioned above, 1771 and 1772 were years of famine in Saxony due to extraordinary harsh winters which brought about a remarkable increase in food prices and mortality rates (see figure 1).22 In our estimates we do not find a clear negative effect of those years as the nutritional status started to decline around the half of the 1770s. This decline is common to many other European countries which, for the same period, experienced decreasing living standards due to strong demographic growth and a general increase of food prices. We shall see in the next section that this declining pattern continued until the middle of the nineteenth-century. The cross-sectional results show that officers (and non-commissioned) were significantly taller than infantrymen (almost 4 cm) confirming a different social extraction. The other army units were substantially shorter but given the limited number of observations for these categories these findings should be interpreted cum grano salis. The coefficient of the dummy variable for urbanization has the right sign but it is not statistically different from zero. Yet, this coefficient hides some important evidence. When used separately, the towns of Dresden and Zwickau show a significant negative effect on height of about 1.2 cm. Dresden was the largest town in Saxony,23 whereas Zwickau is a city located at the foot of the Erzgebirge (Ore Mountains) which experienced a rapid demographic growth in the early phase of the industrial revolution. Therefore the usual suspects for Marriage rates are here defined as the ratio of total number of marriages on population per 1000. 21 Given the scarcity of labor with respect to land and capital, also real wages should rise. See Clark (2007) pp.115-116. 22 Rising food prices are reported in Schirmer (1996) and Gerhard (2001). See also Baten (2001) and Klasen (1998). 23 Dresden had 21,000 inhabitants in 1699, 46,000 in 1727. During the Seven Years War Dresden had around 63,000 inhabitants; after the war 44,000. In 1852 it had 100,000 inhabitants. Leipzig had 14,000 in 1648, 32,000 in 1753, and 26,000 after the Seven Years War. 20. 27.
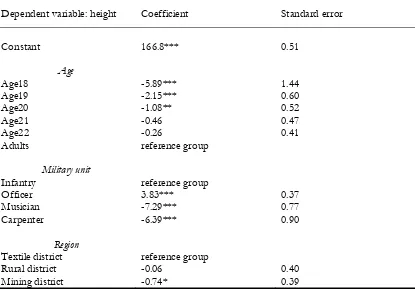
(32) the negative impact of urbanization on nutritional status seem to apply also here, namely scarce sanitation, high food prices and lower food quality. In a society characterized by a limited intergenerational mobility the occupation reported by the recruits is expected to mirror the socio-economic background in which the recruits grew during infancy and childhood. Moreover, the cross sectional height differences among the occupations are generally intended to mirror the income distribution in the society. The estimates for the eighteenth-century do not show systematic height differentials among the occupations. There is only a consistent height advantage of 1.4 cm for those who had a direct access to food, namely millers, butchers, and bakers. The other categories are not statistically different from the reference group of craftsmen. The estimates show also that, on average, there were not systematic differences among the three geographic areas used for the regression analysis. The absence of occupational disparities in nutritional status and the fact that no systematic differences among the geographical areas were found suggest a low level of inequality in eighteenth-century Saxony. Table 3. Truncated regression, 1690-1784 Dependent variable: height. Coefficient. Standard error. Constant. 166.8***. 0.51. Age18 Age19 Age20 Age21 Age22 Adults. -5.89*** -2.15*** -1.08** -0.46 -0.26 reference group. 1.44 0.60 0.52 0.47 0.41. Military unit Infantry Officer Musician Carpenter. reference group 3.83*** -7.29*** -6.39***. 0.37 0.77 0.90. Region Textile district Rural district Mining district. reference group -0.06 -0.74*. 0.40 0.39. Age. 28.
(33) Dependent variable: height. Coefficient. Standard error. Urban. -0.50. 0.36. Occupation Misc.crafts Educated Agriculture Access to food Mining and Factories Textile Service Unskilled No occupation. reference group 0.23 1.45 1.42*** 1.35 0.17 0.93 -1.30 0.51. 0.83 0.96 0.41 1.17 0.45 0.66 1.02 0.32. Cohorts 1690-99 1700-04 1705-09 1710-14 1715-19 1720-24 1725-29 1730-34 1735-39 1740-44 1745-49 1750-55 1756-63 (Seven Years’ War) 1764-69 1770-74 1775-79 1780-84. -0.11 0.58 1.41*** 1.19** -0.42 -0.19 -0.89 1.25 0.18 -2.61** -1.65* 0.25 -1.00 reference group 0.30 -0.07 -0.83. Observations. 13,866. 0.75 0.60 0.46 0.49 0.67 0.51 0.67 0.79 0.74 1.06 0.86 0.50 0.64 0.69 0.52 0.61. Note: Robust standard errors adjusted for clustering. * p < 0.10, ** p < 0.05, *** p < 0.01.. Further evidence on eighteenth-century Germany is rather scarce. Baten (2001) investigated nutritional status for Bavaria and Palatinate analyzing military records of cohorts born between 1725 and 1794. The southern states of Germany are not directly comparable to Saxony as the formers followed a completely different industrialization path. Indeed, the Bavarian economy was prevalently based on the primary sector throughout the whole nineteenthcentury, whereas Saxony already at the end of the eighteenth-century could. 29.
(34) experience the birth of the factory system. Nevertheless it could be instructive to compare the average nutritional status of these two German regions. The height trend estimated by Baten is increasing between the cohorts 1725-29 and 1750-54, whereas it is decreasing for the period 1750-1770. For the remaining period, 1770-1790, the average nutritional status in Bavaria increases slightly, as it recovers from the famine years, even though it did not reach the high levels of the 1750s. Therefore the trends in height in Saxony and Bavaria follow the same pattern only to a limited extent. For the last third of the century under investigation the two trends diverge. This finding is not surprising whether we consider the very different economic structure of the two regions. As stressed by Baten, the average nutritional status in Bavaria was probably more affected by the climate and its effect on food production than by demographic pressure, urbanization, workload or the disease environment. Our estimates for Saxony are more consistent with trends estimated for countries on the road to industrialization such as England or the region of Bohemia in the HabsburgAustrian Empire. In those countries the decline in nutritional status during the last third of the century is a common feature (Floud et al., 1990; Komlos, 1993a; Komlos 1989). Thus, the differences in the nutritional status between Saxony and Bavaria emphasized here suggest that the economic history of eighteenthcentury Saxony is more similar to England, characterized by a strong demographic increase and urbanization which, in turn, contributed to increase food prices already in the last decades of the century. For Britain, evidence of increasing food prices and decreasing real wages during the last decades of the eighteenth-century has been recently confirmed (Clark, 2001; Clark, 2007). In the case of Saxony evidence on real wages for this period is scarce. Some scattered evidence shows that in Germany real wages were on decline and remained low until 1850 (Gerhard, 1984). Klasen (1998) reports that per capita meat consumption in Germany declined by 36 percent in the period 1770-1800 and he ascribes this phenomenon to declining real wages.. 30.
(35) 1.4 Nutritional status and early industrial development In this section we focus on the nutritional status of the soldiers born between 1785 and 1845, recruited after 1806. As mentioned, a considerable shift in the age composition of the Saxon army occurred after the Congress of Vienna. Enrolment practices changed and the army recruited relatively more youths. Similarly to most of the European armies, also Saxony after Napoleon moved toward a system of universal conscription. The share of soldiers between age 18 and 22 years recruited after 1806 is 44 percent; the same age-group makes only 25 percent of the pre-1806 recruitment sample. Accordingly, also the height distributions changed with respect to the previous century. The predominant (86 percent of the cases) MHR enforced in the nineteenth-century was 68 Saxon inches (≈ 161 cm). This measure is significantly lower than the standard mostly applied in the previous century which was around 70 inches (≈ 166 cm). Given the lower truncation point, in the estimation we do not constrain the population standard deviation to a fixed value but we leave it as a parameter to estimate in the maximization procedure.24 The model specification is almost identical to the one adopted in the previous section. We have an additional control variable for the recruitment under La Grande Armée (1806-13) which, otherwise, could introduce some bias in our results. Alike for the eighteenth-century, standard errors are adjusted for clustering where the counties constitute the clusters (table 4). The estimated trend in nutritional status is displayed in figure 4 and is standardized for a 21 year infantryman, born in 1785-89 in the textile district, and previously employed as a craftsman. The trend is decreasing throughout the whole period. Physical stature, which remained constant during the first decade of the nineteenth-century, declined substantially from 1815 reaching a remarkable low measure in 1845. Average height decreased between the cohorts 1806-14 and 1840-49 by more than 6 cm. The estimated trend shows that the average nutritional status remained constant during the Napoleonic period, whereas in the previous and subsequent period average heights were on decline. See the data section for an explanation of the different approaches in dealing with truncated distributions. 24. 31.
(36) What is the economic fact that halted the declining trend in nutritional status in the period 1800-1815? We believe that the Continental System pursued by Napoleon and extended to all the countries under his influence played a determinant role. Already in the last decades of the eighteenth-century Saxony could enumerate several textile factories (Forberger, 1958). This number increased significantly during Napoleon: In that period the number of mule spindles increased from 13,000 to 256,000 units (Crouzet 1964, p.576). In 1815 Saxony possessed 80 percent of the cotton spindles of the whole Germany (Kiesewetter, 2004). The Continental System, which took effectively place in 1806-14, gave a considerable boost to investments in the Saxon cotton industry. The Blockade, restricting all trade with Britain or her colonies, suddenly eliminated the highly competitive British textile produces from the Saxon market thus favoring the relatively inefficient Saxon cotton manufactures. The Blockade stimulated the demand for more expensive domestic products favoring on one side the textile sector, and on the other side triggering a decrease in the relative price of food. Indeed, prices of European industrial goods rose substantially in Germany with respect to rye25 and that might have contributed to keep the population nutritional status constant. The positive effect of the Blockade is also mirrored by changes in demographic variables: Between 1806 and 1811 population increased by 6.4 percent, marriage rate by 38.8 percent, birth rate by 20.3 percent, and infant mortality rate declined by 19.1 percent (Kiesewetter 1988, p.208). These figures are comparable in magnitude with those for the period 1820-25, when the population recovered from the hunger-years of 1816/17. After the collapse of the Blockade the Saxon cotton industry suffered tremendously from the reintroduction of the British products. As a consequence the Saxon textile industry went through an industrial re-conversion from cotton toward wool manufacturing (Tipton, 1976). As a result, the number of cotton spindle mules in Saxony between 1815 and 1825 increased by only 5.6 percent, whereas in the rest of Germany it increased by 18.4 percent (Kiesewetter, 2004).. 25. O’Rourke (2005).. 32.
(37) 170 168 166 164 162. height in cm. 160 158 156 1780 1785 1790 1795 1800 1805 1810 1815 1820 1825 1830 1835 1840 1845 1850 birth-cohorth Average Height - 2 std.err.. + 2 std.err.. Figure 4. Height trend, 1785-1845 Note: Standardized for adults (23-49), infantry, craftsmen, born in the textile district. Standard errors account for the estimated covariance with the constant. Source: Table 4.. Therefore, the strong decline in average heights after 1815 could be a partial response to the structural change that touched one of the core sectors of the Saxon economy. The interaction between population density and food supply played also a substantial role in shaping the nutritional status in Saxony. In the period 17751811 the population grew at an annual rate of about 0.5 percent, whereas in 1815-1830 at an impressive rate of circa 1.2 percent which implies a doubling population in about 60 years. As a consequence of the decisions taken at the Congress of Vienna, Saxony in 1815 had to concede to Prussia a significant part of its predominantly agricultural and low-density populated area which made almost three-fifths of the whole country. Such a loss had a relevant impact on the country food-provision and on the population density. In 1816, according to the new boundaries, the population density in the Kingdom of Saxony was 79.6 inhabitants per square kilometers. The dependence on food imports rose significantly after 1815 and worsened with the poor harvests of 1825/26. Between 1814 and 1815, due to the loss of land, total population decreased by 39. 33.
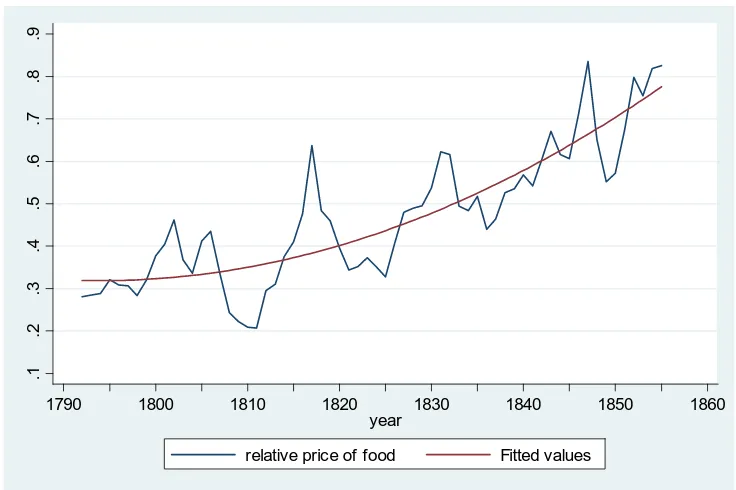
(38) percent while the production of rye decreased by 49 percent, wheat by 61 percent, barley by 58 percent, oats by 45 percent, and potatoes by 37 percent (Kiesewetter 1988, p.278). Unfortunately we are not able to trace the trend in food imports for the period 1815-1850, but it is undisputable that Saxony relied heavily on imports of rye and wheat, and mainly from the neighboring Bohemia, Hamburg (through the river Elbe), and Prussia. Saxony in the period 1837-1844 imported on average circa 654,000 bushel of cereals26 which correspond to about 7 percent of the cereal production in Saxony in 1846.27 It is also important to note that potato was the main agriculture produce during that period in Saxony. Kiesewetter shows that in the period 1846-1871 potato cultivation constituted more than half of the total agricultural production (Kiesewetter 1988, p.284).28 Therefore the increasing pressure on food resources and the increasing dependence on food imports likely triggered high food prices contributing to the deterioration of the average nutritional status. The rise in population could occur only at the cost of a lower average nutritional status. The relative price of food increased substantially in the nineteenth-century. Using German price series of Jacobs and Richter (1935) we constructed an index which goes from 1790 until 1860 (figure 5). The index is the ratio of a weighted average of agricultural prices over a weighted average of industrial prices. The quadratic interpolation on the figure shows clearly the increasing trend in the relative price of food that occurred in Germany in the first half of the nineteenth-century. During the Blockade, in particular in 1810, the relative price of food reached its lowest value consistently with our hypothesis about the positive effect of the Blockade on the average nutritional status. After Napoleon, prices of industrial products declined steadily whereas agricultural prices, considering also the crisis of 1816-17, moved upward driven by a strong demand and urbanization. The cross-sectional results for the period 1785-1849 show some important differences with respect to the previous period (table 4). Whereas the coefficient for officers (and non-commissioned) confirms again a different social extraction, the results linked to the geographic area and the occupations present interesting insights. Rye, wheat, barley, and oats. See Kiesewetter (1988), table 15 on p.284 and table 23 on p.321. 28 On the importance of potatoes in Saxony see also Baten (2001). 26 27. 34.
(39) .9 .8 .7 .6 .5 .4 .3 .2 .1 1790. 1800. 1810. 1820. 1830. 1840. 1850. 1860. year relative price of food. Fitted values. Figure 5. Trend of the relative price of food in Germany Source: Jacobs and Richter (1935).. Both the north-eastern rural area and the southern part of Saxony present a height penalty with respect to the textile district (around the town of Chemnitz) of more than one centimeter. The urban dummy has a coefficient not statistically different from zero but, as in the previous case, it hides important findings. When disaggregated,29 the regression shows a consistent urban penalty for Dresden (0.4 cm) and for Chemnitz (1 cm) which was at the hearth of the Saxon industrialization. Individuals born in the latter town were likely exposed to a particular epidemiological stress due also to a rapid demographic increase. Indeed, the area around Chemnitz had the highest population growth rate in the period 1815-1830.30 Internal migration could also explain partially the urban disadvantage: economically destitute people from the countryside may have moved towards urban agglomerates in search of better job opportunities lowering the average urban biological standard of living. This conjecture is plausible as we know that soldiers from towns were recruited mainly from the periphery of the urban centers (Kroll, 2006). Estimation results not reported here. Ewert (2006) on the contrary finds a height advantage for urban residents. His evidence can hardly be reconciled with the strong urbanization of early industrial Saxony.. 29 30. 35.
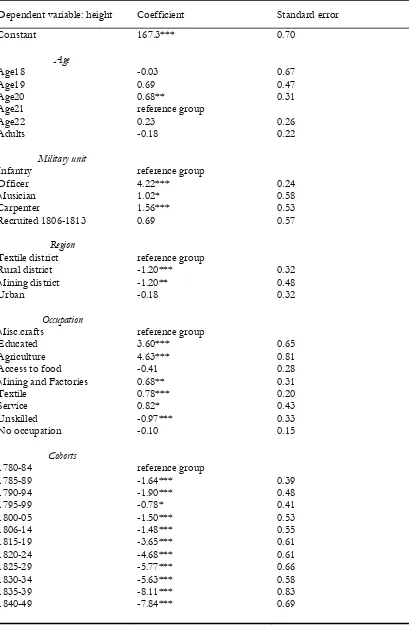
(40) Table 4. Truncated regression, 1785-1849 Dependent variable: height. Coefficient. Standard error. Constant. 167.3***. 0.70. Age18 Age19 Age20 Age21 Age22 Adults. -0.03 0.69 0.68** reference group 0.23 -0.18. 0.67 0.47 0.31. Military unit Infantry Officer Musician Carpenter Recruited 1806-1813. reference group 4.22*** 1.02* 1.56*** 0.69. 0.24 0.58 0.53 0.57. Region Textile district Rural district Mining district Urban. reference group -1.20*** -1.20** -0.18. 0.32 0.48 0.32. Occupation Misc.crafts Educated Agriculture Access to food Mining and Factories Textile Service Unskilled No occupation. reference group 3.60*** 4.63*** -0.41 0.68** 0.78*** 0.82* -0.97*** -0.10. 0.65 0.81 0.28 0.31 0.20 0.43 0.33 0.15. reference group -1.64*** -1.90*** -0.78* -1.50*** -1.48*** -3.65*** -4.68*** -5.77*** -5.63*** -8.11*** -7.84***. 0.39 0.48 0.41 0.53 0.55 0.61 0.61 0.66 0.58 0.83 0.69. Age. 0.26 0.22. Cohorts 1780-84 1785-89 1790-94 1795-99 1800-05 1806-14 1815-19 1820-24 1825-29 1830-34 1835-39 1840-49. 36.
Figure
+7
Related documents
Product Name Technical Licences Technical Licenses Required/ Optional GIS 8.0 Required GIS_INTERACTIONSERVICE 8.0 Required ics_custom_media_channel 8.0
The paper is discussed for various techniques for sensor localization and various interpolation methods for variety of prediction methods used by various applications
Also, both diabetic groups there were a positive immunoreactivity of the photoreceptor inner segment, and this was also seen among control ani- mals treated with a
This essay asserts that to effectively degrade and ultimately destroy the Islamic State of Iraq and Syria (ISIS), and to topple the Bashar al-Assad’s regime, the international
HCC is developing in 85% in cirrhosis hepatis Chronic liver damage Hepatocita regeneration Cirrhosis Genetic changes
19% serve a county. Fourteen per cent of the centers provide service for adjoining states in addition to the states in which they are located; usually these adjoining states have
diallylacetic acid rather than bismuth since in one case in which analysis was performed only minute amounts of bismuth were recovered, and there was, in his opinion, ‘ ‘no
