Article
Loci controlling adaptation to heat stress occurring at
the reproductive stage in durum wheat
Khaoula El Hassouni 1,2, Bouchra Belkadi 2, Abdelkarim Filali-Maltouf 2, Amadou Tidiane-Sall 1,3, Ayed Al-Abdallat 4, Miloudi Nachit 1,2, Filippo M. Bassi 1,*
1 International Center for the Agricultural Research in Dry Area (ICARDA), Rabat 10000, Morocco; elhassouni.khaoula@gmail.com; f.bassi@cgiar.org
2 The University of Mohammed 5th, Faculty of sciences. Rabat 10000, Morocco; bbelkadi@gmail.com; filalimaltouf@gmail.com; mmnachit@gmail.com
3 Institut Sénégalais de Recherches Agricoles (ISRA), Saint-Louis 46024, Senegal ; tidianesall11@yahoo.com 4 Faculty of Agriculture, The University of Jordan. Amman 11942, Jordan ; a.alabdallat@ju.edu.jo
* Correspondence: f.bassi@cgiar.org;
Abstract:
Heat stress occurring during the reproductive stage of wheat has a detrimental effect on productivity. A durum wheat core set was exposed to simulated terminal heat stress by applying plastic tunnels at the time of flowering over two seasons. Mean grain yield was reduced by 54% compared to control conditions, and grain number was the most critical trait for tolerance to this stress. The combined use of tolerance indices and grain yield identified five elites: Kunmiki, Berghouata1, Margherita2, IDON37-141, and Ourgh. The core set was also subjected to genome wide association study using 7,652 polymorphic SNPs markers. The most critical genomic regions were identified in association with spike fertility and tolerance indices on chromosome 1A, 5B and 6B. Haplotype analysis on a set of 208 elites confirmed that lines that carried the positive allele at all three QTLs resulted in a yield advantage of 8% when field tested under daily temperatures above 31° C. Two of the QTLs were successfully validated into KASP markers and explained >10% of the phenotypic variation for an independent elite germplasm set. These genomic regions can now be readily deployed via breeding to improve resilience to climate change and increase productivity in heat-stressed areas.
Keywords: Heat stress, durum wheat, yield, tolerance, fertility, climate change, resilience
1. Introduction
Heat stress is a major environmental constraint to crop production. Terminal heat stress is defined as a rise in temperature that occurs between heading and maturity. When this stress matches with the reproductive phase of the wheat plant, it affects anthesis and grain filling, resulting in a severe reduction in yield [1]. High temperatures at the time of flowering cause floret sterility via pollen dehiscence [2], decrease photosynthetic capacity by drying the green tissues, and reduce starch biosynthesis [1,3]. These in turn result in a negative effect on grain number and weight [4-7]. The optimum growing temperature for wheat during pollination and grain filling phases is 21°C [8,9], and for each increase of 1°C above it is estimated a decline of 4.1% to 6.4% in yield [10]. Environmental temperatures have been increasing over the last century and more frequent heat waves are predicted in the next decades [11-13]. Therefore, breeding for tolerance to chronic as well as short term heat stress is a major objective worldwide [14-19]. Breeding selection would benefit by a good understanding of traits associated with tolerance to high temperatures, as well as the identification of the genomic regions controlling these traits.
In wheat, a large number of QTLs has been identified under heat stress via linkage analysis and genome-wide association study (GWAS) for yield, yield related traits and some physiological traits
such as chlorophyll content, chlorophyll fluorescence and canopy temperature [20-27]. Grain number per spike and chlorophyll content were found to be the most critical traits for adaptation to warm conditions [24,25,28]. Heat stress reduces leaf chlorophyll content [29] affecting the amount of carbohydrates transported to the grains and final grain weight and size. High temperatures around anthesis reduce the number of grains per spike due to a decrease in spike growth and development, and an increase in ovules abortion [2,25,29,30]. To the best of our knowledge, heat stress tolerance QTLs are not generally used in marker-assisted selection in wheat. The limited understanding of genes underlying physiological mechanisms and the regulation of yield components in wheat, and the lack of cloned major QTL for traits associated with heat tolerance has restricted the improvement in breeding for tolerance to this stress.
In the current study, a set of durum wheat lines were heat stressed by imposing a >10° C raise in maximum daily temperatures via the deployment of plastic tunnels at the time of flowering. GWAS studies allowed the identification of major QTLs controlling the adaptation to this stress and these were validated for MAS in an independent germplasm set for rapid deployment via breeding.
2. Materials and Methods
2.1. Plant material
A subset of forty-two durum wheat inbred lines were selected from a global collection of 384 genotypes based on their similarity in flowering time and identified genetic diversity [31]. Briefly, the complete collection is highly diverse and includes 96 durum wheat landraces from 24 countries, and 288 modern lines from 9 countries and two International research centers CIMMYT and ICARDA. The subset selected for this study includes 34 ICARDA and CIMMYT lines, 5 cultivars and 1 landrace. The list of the 42 genotypes and their details are provided in Table S1.
A second subset of 208 modern entries was also obtained from the global collection and field tested under severe high temperatures during 2014-15 and 2015-16 seasons along the Senegal River in Kaedi, Mauritania. Full details on this field experiment have been published in Sall et al. [32].
The third and final set was used for KASP markers validation and it was composed of 94 ICARDA’s elites that constituted the 2017 international nurseries 40th IDYT and 40th IDON. This set was also tested at the station of Kaedi along the Senegal River in season 2015-16.
2.2. Field experiment conditions and phenotyping
the plastic tunnels, to reach a maximum of 49 °C (Figure 1). Marchouch is a drought prone site, and no rainfall occurred after Z45 in any of the two field seasons.
Figure 1. Mean temperature difference of 18 days over 2 seasons between the plastic tunnel-mediated heat stress and normal field conditions between 8 am and 8 pm, and a picture of the plastic tunnel at 9 am.
The following traits were recorded: days to heading (DTH) measured at the moment when the awns became visible, plant height (PH) measured from the ground to the top of the highest spike excluding the awns, and the number of fertile spikes per meter square (Spkm2) was counted in a 0.25 m2 area. The whole plot was harvested by hand and the dry biomass (Biom) was weighted before threshing. Grain yield (GY) was weighted for each plot and expressed as kg ha-1. The weight of a thousand kernels (TKW) was expressed in grams. The harvest index (HI) was calculated as the ratio between GY and Biom. The grain number per spike (GNSpk) was derived from dividing grain number per meter square by Spkm² as follows:
Grain number /m² =Grain weight of the plot 1.5𝑚2
𝑥 𝑇𝐾𝑊 1000⁄
GNSpk =Grain number / m² 𝑆𝑝𝑘𝑚2
The second and third sets were field tested in Kaedi, Mauritania (16°14” N; 13°46” W) during season 2015-2016 where the temperature reached a maximum of 41°C and an average maximum daily temperature of 34°C throughout the season. The trial was carried out under augmented design with a plot surface of 4.5 m². Standard agronomic management practices were adopted. Full details for this experiment are published elsewhere [32].
2.3. Data analysis
A mixed linear model was run using the lme4 package [33] in R [34] to obtain best linear unbiased estimates (BLUEs) of the normally distributed traits. For count traits (DTH, Spkm², GNSpk), the generalized mixed linear model was used to get the BLUEs by Proc GLIMMIX in SAS. In both models, genotype, treatment, year and replication were considered as fixed effects and block as random effect nested in treatment and year. Broad-sense heritability was calculated based on variance components from random model using the method suggested by DeLacy et al. [35]:
2 2
2 2 2 2
2
G
G T G Y G T Y e
G H
t y ty tyr
=
+ + + +
where: G T2 = genotype × treatment variance,
2
G Y
= genotype × year variance, G Y T2 = genotype ×
treatment × year variance,
2
e
= residual variance, r is the number of replications per treatment, t is the number of treatments, and y is the number of years.
Box-and-whisker plots where constructed by ggplot2 package [36] using the BLUEs combined over year per each treatment. The relationship between the target trait GY and yield components (GNSpk, TKW, Biom, HI) was studied using the Pearson correlation coefficient and the additive regression model. The critical value of the correlation significance were determined at 0.30 for p < 0.05 and 0.39 for p < 0.01 for 40 df using the corrplot package [37]. The additive model incorporates flexible forms (i.e. splines) of the functions to account for non-linear relationship contrary to linear regression model estimated via ordinary least squares [38]. For additive model, the effective degree of freedom term determines the nature of the relationship between the predictor and the response variables where EDF = 1 indicates linearity and EDF > 1 the non-linearity. The additive regression analysis was performed using mgcv package [39].
Two stress tolerance indices were calculated to identify the heat tolerant genotypes. The stress susceptibility index (SSI) [40,41] was calculated as follows:
SSI =[1 − (Ys)/(Yp)] [1 − (Ȳs)/(Ȳp)]
where Ys and Yp are yield values of the genotypes evaluated under heat stress and normal conditions, respectively, and Ȳs and Ȳp are the mean yields of the lines evaluated under heat stress and normal conditions, respectively.
The stress tolerance (TOL) [42] was calculated as follows: TOL= Yp − Ys
The classInt package [43] was used to identify the possible number of class intervals of the indices for the frequency distribution of the subset.
The cut-off value for tolerant vs susceptible genotypes for SSI was equal to 1, with lines having SSI <1 being stress tolerant. Regarding the TOL index, the smaller TOL values indicate the genotypes with low yield depression and hence more tolerant. The experiment-wide TOL mean (1,608 kg ha-1) was identified as the cut-off value for tolerant vs susceptible. The emmeans package [44] based on ANOVA model was used to discriminate among the grain yield means of haplotypes.
2.4. Genotyping and marker-trait associations
Details of the genotyping step of the core set and panel have been previously discussed in Kabbaj et al. [31] and Sall et al. [32]. Briefly, 7,652 high-fidelity polymorphic SNPs were obtained, showing less than 1% missing data, minor allele frequency (MAF) higher than 5%, and heterozygosity less than 5%. The sequences of these markers were aligned with a cut-off of 98% identity to the durum wheat reference genome [45] (available at: http://www.interomics.eu/durum-wheat-genome), to reveal their physical position. A sub-set of 500 highly polymorphic SNPs were selected on the basis of even spread along the genome, and used to identify the existence of population sub-structure, which reveal the existence of 10 main sub-groups [31]. To avoid bias, these 500 markers were then removed from all downstream association analysis. Linkage disequilibrium was calculated as squared allele frequency correlations (r2) in TASSEL V 5.0 software [46], using the Mb position of the markers along the bread wheat reference genome. Linkage disequilibrium (LD) decay was estimated and plotted using the “Neanderthal” method [47]. The LD decay was measured at 51.3 Mb for r2<0.2 as presented in Bassi et al. [48].
interrogated the 12,000 Mb of the durum wheat genome via 248 “loci hypothesis”, and hence the Bonferroni correction for this panel was set to 3.1 LOD for p<0.05 as suggested by Duggal et al. [50]. The marker-trait associations (MTAs) that occurred at a distance inferior to 104 Mbp (twice the LD decay) were considered to belong to the same QTL. All the MTAs analysis were performed using Tassel 5 software [46].
2.5. Markers conversion to KASP (Kompetitive Allele Specific PCR)
The array sequences of 10 markers associated to traits (MTA) were submitted to LGC Genomics for in-silico design of KASP primers using their proprietary software. Those that passed the in-silico criteria were purchased and used to genotype the independent validation set. For each marker that amplified and showed polymorphism, the regression cut-off between phenotype and haplotype was imposed at r = 0.105 following Pearson’s critical value [51]. In addition, the top 20 and worst 20 yielding lines were considered as the true positive and true negative for heat tolerance. Hence, the accuracy was calculated as the ratio of the correct allelic call among all, sensitivity as the ratio of the correct positive allelic among the top 20 yielding lines, and specificity as the ratio of the correct negative (wt) allelic calls among the 20 worst yielding lines.
3. Results
3.1. Agronomic performance of the genotypes and sensitivity of traits to heat stress
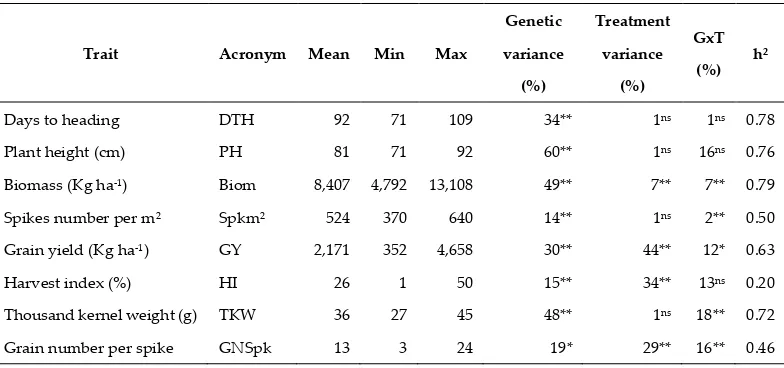
The combined analysis of variance across four environments (two different temperature treatments over two crop seasons) revealed significant genotypic differences for all traits measured (Table 1). The yield performance of the genotypes across environments averaged 2,171 kg ha-1 and ranged from 352 kg ha-1 obtained under heat stress conditions for the lowest yielding line DWAyT-0215, to 4,658 kg ha-1 under normal conditions for the highest yielding line DWAyT-0217. The top yielding line under heat-stress was the ICARDA/Moroccan cultivar ‘Faraj’ with an average yield of 2,249 kg ha-1 over the two seasons.
Table 1. Descriptive statistics, component of trait variation and heritability (h²) among a set of 42 durum genotypes (G) tested under two treatments (T): normal and plastic tunnel-mediated heat stress during seasons 2015-16 and 2016-17.
Trait Acronym Mean Min Max
Genetic
variance
(%)
Treatment
variance
(%)
GxT
(%) h²
Days to heading DTH 92 71 109 34** 1ns 1ns 0.78
Plant height (cm) PH 81 71 92 60** 1ns 16ns 0.76
Biomass (Kg ha-1) Biom 8,407 4,792 13,108 49** 7** 7** 0.79
Spikes number per m² Spkm² 524 370 640 14** 1ns 2** 0.50
Grain yield (Kg ha-1) GY 2,171 352 4,658 30** 44** 12* 0.63
Harvest index (%) HI 26 1 50 15** 34** 13ns 0.20
Thousand kernel weight (g) TKW 36 27 45 48** 1ns 18** 0.72
Grain number per spike GNSpk 13 3 24 19* 29** 16** 0.46
*, ** Significant at the 0.05 and 0.01 probability levels, respectively.
observed for all the phenological and agronomical traits except for HI that had the lowest heritability (h²= 0.20).
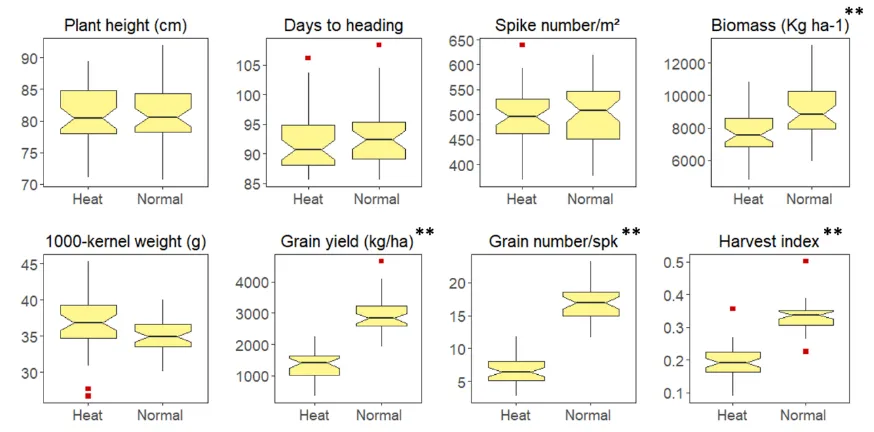
Figure 2. Boxplot of the BLUEs for various traits under two different environmental conditions (Heat: plastic tunnel- mediated heat stress & Normal) across two years. ** indicate significant difference between the means of control and heat-stressed plants at p<0.05.
3.2. The traits interrelationship under each environmental condition
Correlation analysis (Figure 3; Table S4) was first conducted to investigate the interrelationship among all agronomic traits. Under both treatments, GNSpk had the highest association with GY (r=0.81 under heat, r=0.67 under normal), while Spkm² and TKW were the least correlated with GY. Biomass was also correlated with GY with r= 0.61 under heat and r=0.67 under normal conditions. HI also showed a significant positive correlation with yield under both treatments, but its effect was stronger under heat stress (r=0.72) than normal conditions (r=0.54). DTH was not significantly correlated to any trait except HI (r= -0.44) under normal conditions.
Among yield components, the only significant and positive associations under the two environmental conditions were observed between Spkm², TKW and Biom and between HI and GNSpk. Under heat conditions, positive and significant correlation was noticed between GNSpk and Biom while under normal conditions HI was positively associated to TKW (Figure 3; Table S4).
Figure 3. Relationships between grain yield (GY) and yield components (GNspk, HI, Biom, spkm², TKW) under plastic tunnel-mediated heat stress and normal conditions assessed by Pearson correlation and simple generalized additive model. Continuous grey line represents linear relationship; dashed grey line represent non-linear relationship. The thickness of the line indicates the level of predictivity of the trait for e GY. The length of the lines represents the correlation, the shorter the line the more the trait is correlated to GY.
GNSpk was considered the best predictor (deviance= 0.73 %) with a complex relationship (EDF= 2.64) with GY under heat stress, whereas under normal conditions this trait was the second best predictor (deviance= 0.44 %) with a linear relationship (EDF= 1). A similar trend was observed for HI in both treatments. Biom was found to be the best predictor (deviance= 0.52 %) for GY with non-linear relationship (EDF= 2.52) under normal conditions (Table S2; Figure S1).
3.3. Stress tolerance indices
Figure 4. Two different stress tolerance indices SSI (stress susceptibility index) and TOL (tolerance index) of grain yield, comparing plastic tunnel-mediated heat stress with normal conditions for the 42 durum wheat genotypes. The bars plot shows the frequency distribution of SSI and TOL for the genotypes tested. The dashed red lines mark the separation between tolerant (left) and susceptible (right) genotypes. The scatter plot shows the yield performance of genotypes tested under normal conditions against each of SSI and TOL. The vertical dashed red lines indicate the average GY. The horizontal dashed red lines indicate the cut-off value for tolerant vs susceptible genotypes for each index. Red dots indicate genotypes that were identified as superior by both bi-plots.
3.4. Markers associated to heat stress tolerance
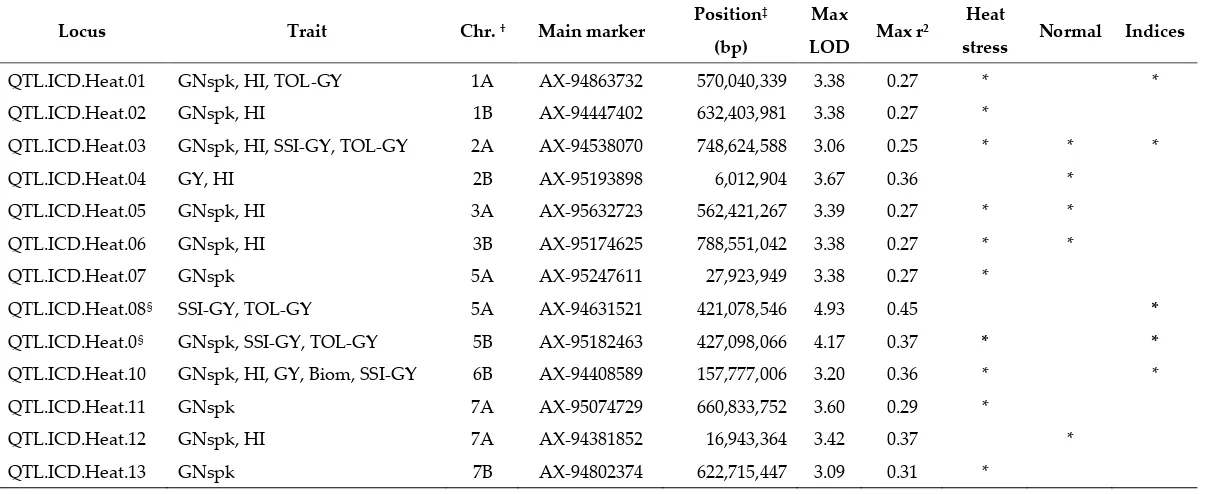
A total of 204 MTAs was identified for four traits (GY, GNSpk, HI and Biom) under both stress and normal conditions and 49 MTAs were recorded for the two GY stress tolerance indices. These associations were distributed over 13 loci (Table 2). Chromosome 1A had the highest number of MTAs (27) while chromosome 4A had the lowest (6).
Under normal conditions, 56 MTAs were detected for three traits GY, GNSpk and HI, with the third trait having the highest number of MTAs (48). No common region for these traits was identified under non-stress environment. Under heat stress, a higher number of associations (148) were identified with trait variation (r²) ranging from 0.25 to 0.36. The highest number of MTAs were detected for GNSpk distributed over 10 different loci, followed by HI on 6 loci. A common region for GY, GNSpk, HI and Biom was identified under heat condition on chromosome 6BS. Loci associated with both GNSpk and HI were detected on 1AL, 1BL, 2AL, 3AL and 3BL. For heat tolerance indices (SSI-GY and TOL-GY), 49 MTAs were identified. The common loci associated with the two indices were on chromosome 2AL, 5AL and 5BL, while the loci on chromosome 1AL and 6BS were identified only for TOL-GY and SSI-GY, respectively.
both treatments for GNSpk and HI. Two loci on chromosome 3AL and 3BL were associated with GNSpk and HI under both control and stress conditions, but were not associated with any of the indices. Three significant loci on chromosome 1AL, 5BL and 6BS were shared among heat stress treatment and stress tolerance indices, but not under normal conditions, making of these the most interesting genomic regions that specifically respond to heat stress. Overall, a total of 13 significant loci were identified (numbered QTL.ICD.Heat.01-QTL.ICD.Heat.13) and can be consulted in Table 2.
Table 2. QTLs associated with multiple traits under plastic tunnel-mediated heat stress, normal conditions, and based on stress indices.
Locus Trait Chr. † Main marker Position
‡
(bp)
Max
LOD Max r²
Heat
stress Normal Indices
QTL.ICD.Heat.01 GNspk, HI, TOL-GY 1A AX-94863732 570,040,339 3.38 0.27 * *
QTL.ICD.Heat.02 GNspk, HI 1B AX-94447402 632,403,981 3.38 0.27 *
QTL.ICD.Heat.03 GNspk, HI, SSI-GY, TOL-GY 2A AX-94538070 748,624,588 3.06 0.25 * * *
QTL.ICD.Heat.04 GY, HI 2B AX-95193898 6,012,904 3.67 0.36 *
QTL.ICD.Heat.05 GNspk, HI 3A AX-95632723 562,421,267 3.39 0.27 * *
QTL.ICD.Heat.06 GNspk, HI 3B AX-95174625 788,551,042 3.38 0.27 * *
QTL.ICD.Heat.07 GNspk 5A AX-95247611 27,923,949 3.38 0.27 *
QTL.ICD.Heat.08§ SSI-GY, TOL-GY 5A AX-94631521 421,078,546 4.93 0.45 *
QTL.ICD.Heat.0§ GNspk, SSI-GY, TOL-GY 5B AX-95182463 427,098,066 4.17 0.37 * *
QTL.ICD.Heat.10 GNspk, HI, GY, Biom, SSI-GY 6B AX-94408589 157,777,006 3.20 0.36 * *
QTL.ICD.Heat.11 GNspk 7A AX-95074729 660,833,752 3.60 0.29 *
QTL.ICD.Heat.12 GNspk, HI 7A AX-94381852 16,943,364 3.42 0.37 *
QTL.ICD.Heat.13 GNspk 7B AX-94802374 622,715,447 3.09 0.31 *
†Chr. – Chromosome, based on alignment to durum wheat genome assembly [45]
* - Significant QTL
‡- Based on alignment to durum wheat genome assembly [45]
§ - These QTLs have been converted into KASP markers and validated
Only four markers were associated with DTH explaining 27 to 29 % of trait variation (Table S3). Three MTAs identified over heat and normal conditions on chromosome 4AS (1) and 4BS (2). Another MTA was detected on chromosome 6AS under normal conditions.
3.5. Effect of different allele combination on yield performance
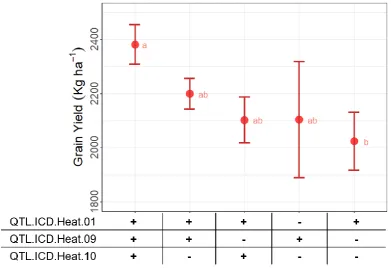
The loci identified on chromosomes 1AL, 5BL and 6BS appeared as the most critical for heat tolerance and were then tested further. These regions were associated with the control of multiple traits under heat stress: GY, GNspk, HI, Biom and the two indices SSI-GY and TOL-GY. A set of 208 modern lines was investigated for haplotype diversity at these three loci. Five groups with different allelic combinations were identified (Figure 5). Their allelic effect on GY was then assessed when field tested under high temperatures along the Senegal River [32]. The haplotype class with positive alleles at all three loci had the highest GY average reaching 2,381 kg ha-1 with a maximum value of 3,856 kg ha-1. Genotypes of the haplotype classes with only two favorable alleles reached GY of 2,199 kg ha-1 and 2,103 kg ha-1, while lines that only carried one positive allele 2,103 kg ha-1 and 2,023 kg ha-1 (Figure 5). ANOVA confirmed that the haplotype group with all three positive alleles was significantly superior to the others.
Figure 5. Effect of different allele combinations of the significant loci on yield performance of 208 accessions tested under heat stressed conditions along the Senegal River. The circle indicates the average of each class over 2 years, the whiskers show the standard error of the mean. The accessions were divided into five clusters based on their haplotype for three major QTLs: “+” mark the positive and “-” the wild-type alleles. Letters (a, b, ab) indicate significant differences between the clusters.
3.6. Validation of markers for marker assisted selection
QTL.ICD.Heat.09 on chromosome 5BL. The latter QTL is one of the three main regions identified in this study. AX-95260810 was overall the most suitable for MAS applications, reaching 15% correlation, 74% accuracy, 43% sensitivity, and 100% specificity. Especially its ability to identify 100% of non-heat tolerant entries is particularly remarkable. AX-95182463 also reached significant correlation (14%), and adequate ability to predict heat tolerant elites (sensitivity = 62%), but it revealed also poor accuracy (30%) and specificity (4%).
Figure 6. KASP markers validation on an independent set of 94 elite lines of ICARDA tested under severe heat. Correlation was measured between the BLUE for grain yield recorded along the Senegal River and the haplotype score. Accuracy, sensitivity, and specificity where determined using only the top 20 and worst 20 yielding lines. 95260810 and 94432276 tag QTL.ICD.Heat.08, AX-95182463 tags QTL.ICD.Heat.09.
4. Discussion
4.1. Evaluation of the phenotypic performance of yield and yield components under normal and heat stress conditions
Several studies reported that wheat plants are very sensitive to elevated temperatures during flowering and grain filling phase [9,52,53], due to a reduction in seed development and fertility [53, 54,55]. This study evaluated a set of durum wheat genotypes derived from a global collection for GY and yield components under heat and normal conditions. The genetic and phenotypic diversity shown by this set together with its relatively similar flowering time, promote it as an ideal panel to test heat tolerance. Further, the plastic tunnel method deployed here allowed to increase the temperatures well above 21°C, the value that defines the absence of the stress [9]. A similar methodology was also successfully deployed by Corbellini et al. [54] to study the effect of heat shock proteins on technological quality characteristics. Compared to timely vs delayed sowing experiments to simulate heat stress, the use of the plastic tunnel method avoids incurring in false discovery due to changes in the phenological behavior of plants.
setting is the most sensitive parameter to heat stress, with a noticeable influence on yield [28,56,57,58]. Still, its non-linear relationship to yield confirms the complexity of the trait. Biom and HI were also found to have an influence on yield [59,60] with different relationships based on the occurrence of the stress. The presence of dissimilarities of the associations between the two treatments indicates clearly that there is a trade-off among the yield components as previously reported by Sukumaran et al. [61] for grain weight and grain number. Variation of one of the yield components affect the others positively or negatively. Compared to the simple regression, the additive model allowed to reveal the complexity of the relationship between GY and yield related traits.
The stress index SSI was developed by Fisher and Maurer [40] and modified by Nachit and Ouassou [41] as a useful indicator and a good parameter for selection. It measures the severity of the heat stress [62,63] and was also used in earlier studies in wheat to seek heat tolerant genotypes [23,64, 65]. The TOL index is instead useful for selecting against yield depression, and it was used in several studies for heat or drought tolerance in wheat [27,41,63,66]. Improving heat tolerance should not be based on the use of these criterions alone as was suggested by Clarke et al. [67]. It is important to select simultaneously for good yield performance coupled with good adaptability (SSI <1) and stability (low TOL) [41]. In that sense, the accessions Kunmiki, Berghouata1, Margherita2 and IDON37-141 originated from ICARDA durum wheat program, and Ourgh, a Moroccan cultivar, have been identified as high yielding genotypes that also show good heat stress tolerance based on the two indices.
4.2. Dissection of heat-specific QTLs associated with yield-related traits and stress tolerance indices
The significant correlation identified between yield and its components were not linear in nature, and tend to change their mode of action based on the occurrence of the stress. Therefore, several physiological processes are simultaneously involved in protecting the wheat plant from the heat stress [68], and there is value in dissecting it into its genetic components. In this study GWAS was used to identify the genetic regions controlling the response of the various traits. To prevent the confounding effect that phenology-related loci might have [69], MTAs were identified for DTH and removed from downstream analysis. Also, flowering time was used as covariate in all analysis for the other traits. Very few MTAs for DTH were observed either in normal or stressed conditions due to the synchronized flowering of the entries used in this study. This indicated the absence of confounding effects between the two trials. i.e., almost all the accessions were exposed to the same conditions in each developmental phase [70] before imposing the stress.
to be associated with GNSpk and the two indices SSI-GY and TOL-GY, contributing to 37% of the phenotypic variation. A region in the short arm of the same chromosome has been previously reported to be associated with grain number per square meter in bread wheat [72], and controlling thousand grain weight in durum wheat [27] under combined drought and heat stress. Shirdelmoghanloo et al. [25] and Acuna-Galindo et al. [74] reported loci for grain weight and other important traits on chromosome 5B under heat and non-heat conditions in hexaploid wheat. On the other hand, the same chromosome has been previously suggested to carry heat-specific QTLs for yield per se in bread wheat [26]. Sukumaran et al. [27] identified markers for heat susceptibility (HSI or SSI) and tolerance (TOL) indices for yield and grain number per square meter on the short arm of the chromosome 5B. Mason et al. [64] also detected QTL for HSI for kernel number on 5BL in bread wheat. The genomic region identified in this study on 5BL is likely to be a new QTL since no information has been reported earlier for this locus associated to GNSpk, SSI-GY and TOL-GY in durum wheat and specific to heat stress, but we cannot exclude it overlaps with previously reported QTLs. A third heat-responsive locus was identified on the short arm of chromosome 6B related to GY, SSI-GY, GNspk, HI and Biom accounting for 36% of the phenotypic variance. An earlier study on bread wheat identified a locus on chromosome 6BS underpinning chlorophyll loss rates and heat susceptibility index for grain weight and chlorophyll loss rates under heat-stress conditions [25]. Under post-anthesis high temperatures stress Vijayalakshmi et al., [20] reported a QTL on the short arm of chromosome 6B for senescence related traits in hexaploid wheat. McIntyre et al. [75] and Pinto et al. [21] reported QTLs on chromosome 6BL that were associated with many important traits (grain number per square meter and grain yield and water-soluble carbohydrate content) related to drought and heat tolerance. Ogbonnaya et al. [26] found a locus on the short arm of chromosome 6B for grain yield under heat stress in bread wheat. These previously reported QTLs in 6B could overlap with the one identified in this study, but they were either identified not in association with heat tolerance or detected in hexaploidy wheat. Therefore, also this region is assumed to have been reported for the first time here in relationship to heat tolerance for durum wheat. This locus affects multiple traits (GY, GNspk, HI, Biom, and two heat susceptibility indexes) and hence it is of good importance for deployment in breeding. The principal breeding objective is to develop varieties with high grain yield and stability when exposed to different stresses. However, grain yield is a complex trait controlled by many genes and strongly influenced by the environment [76-82]. Therefore, a good understanding of traits and underlying loci associated with tolerance to elevated temperatures is of a great importance for breeding new heat tolerant cultivars [83].
4.3. Pyramiding heat-tolerant QTLS via MAS
Three loci on chromosome 1A, 5B and 6B showed an additive nature by means of haplotype analysis (Figure 5), revealing that only the combination of all three positive alleles generated a true yield advantage. Among the most heat tolerant elite lines identified here ‘Kunmiki’, ‘Berghouata1’, and ‘Ourgh’ confirmed to harbor the positive alleles for all three loci. This prompts their use in crossing schemes to pyramid the positive alleles, as well as the deployment of simple marker system to conduct MAS.
tolerant to heat. Hence, while both prone to different types of errors, these two markers can be considered as validated and ready to be deployed in breeding. The combination of the two might represent a more stringent approach to protect against both types of errors. Additional 11 QTLs were identified in this study, and their validation is still ongoing and will require better targeted efforts to be achieved.
5. Conclusions
Heat stress causes a complex cascade of negative effects on the wheat plant, resulting in drastic reduction in grain yield. The deployment of heat tolerant varieties that will benefit greatly farmers requires first to enhance our understanding of this mechanism and loci governing it. Our results confirmed that spike fertility (GNSpk) and maintenance of green leaves (Biom) are the most critical traits to drive tolerance to this stress, and hence should be the primary targets of durum wheat breeders. Further, the deployment of plastic tunnels proved to be a strategic methodology to study this stress and reveal its mechanisms without affecting the phenology of the plant. In addition, 13 loci were identified as responsible to control the main heat tolerance traits. Among these, three were activated only when the stress occurred and represent hence ideal targets for breeding. One of these was validated into a KASP marker and is now ready for deployment via MAS, especially if associated with a second KASP validated for its homoeologous locus. Finally, three ICARDA elite lines and one Moroccan cultivar were confirmed as tolerant to heat, with high grain yield, and carrying positive alleles for three main QTLs. These are freely available and should be incorporated as crossing parents by other breeding programs. Altogether, this study has confirmed the key traits for heat tolerance as well as a new methodology to study it in durum wheat, it has revealed the main loci controlling these traits and proceeded to validate two of them for MAS, and it has also provided freely available elite lines to breed new cultivars better adapted to the stress.
Supplementary Materials:
Table S1: List of durum wheat genotypes evaluated under plastic tunnel-mediated heat stress in the present study.
Table S2: Correlation (r), linear regression estimated via ordinary least squares (OLS) and flexible regression estimated via regression additive model. a; under heat stress. b; under normal conditions.
Table S3: Markers associated with days to heading (DTH) under heat stress and normal conditions.
Table S4: Pearson correlation matrix between all the measured traits under heat conditions (upper part) and normal (lower part) conditions. GY – Grain yield; Biom – Biomass; HI – Harvest index; Spkm² - Spikes per square meter: GNspk - Grain number per spike; TKW – Thousand kernel weight; DTH – Days to heading. *, ** Significant at the 0.05 and 0.01 probability levels, respectively.
Figure S1: Plots of the additive regression model showing GNspk, biom, TKW, spkm² and HI as the spline function of the target trait grain yield (GY). a; under heat stress. b; under normal conditions
Author Contributions:
F.M.B., M.N and K.E.H. conceived and designed the study. K.E.H. and F.M.B. performed the field experiment. A.T.S. performed the field experiment in the Senegal river. A.A. contributed in the genotyping. K.E.H. and F.M.B. analyzed the data. K.E.H. Wrote the original draft. K.E.H., B.B., A.F.M., A.A., M.N., and F.M.B. wrote or reviewed the manuscript. All authors read and approved the final manuscript.
Funding:
Genetic Resources for Food and Agriculture 2014-2015-2B-PR-02-Jordan: “An Integrated Approach to Identify and Characterize Climate Resilient Wheat for the West Asia and North Africa”.
Acknowledgments:
The authors wish to acknowledge the technical assistance provided by A. Rached and all ICARDA durum wheat program staff in handling field activities.
Conflicts of Interest:
The authors declare no conflict of interest.
References
1. Hays, D.; Mason, E.; Hwa, Do. J.; Menz, M.; Reynolds, M. Expression quantitative trait loci mapping heat tolerance during reproductive development in wheat (T. aestivum L.). In Wheat production in stressed environment; Buck, H.T., Nisi, J.E., Salomon, N., Eds.; s Springer, Amsterdam, 2007; pp. 373–382.
2. Saini, H.; Aspinall, D. Abnormal sporogenesis in wheat (Triticumaestivum L.) induced by short periods of high temperature. Ann Bot1982,49, 835–46.
3. Plaut, Z.; Butow, B.J.; Blumenthal, C.S.; Wrigley, C.W. Transport of dry matter into developing wheat kernels and its contribution to grain yield under post-anthesis water deficit and elevated temperature. Field Crops Research2004, 86, 185–198.
4. Hunt, L.A.; van der Poorten, G.; Pararajasingham, S. Post-anthesis temperature effects on duration and rate of grain filling in some winter and spring wheats. Can J Plant Science1991, 71, 609-617.
5. Wollenweber, B.; Porter, J.R.; Schellberg, J. Lack of interaction between extreme high-temperature events at vegetative and reproductive growth stages in wheat. J. Agron. Crop Sci2003, 189, 142–150.
6. Dias, A.S.; Lidon, F.C. Bread and durum wheat tolerance under heat stress: A synoptical overview. J. Food Agric2010, 22,412–436.
7. Dolferus, R.; Ji, X.; Richards, R.A. Abiotic stress and control of grain number in cereals. Plant Science2011, 181, 331–341. doi:10.1016/j.plantsci.2011. 05.015.
8. Porter, J.R.; Gawith, M. Temperatures and the growth and development of wheat: A review. Eur. J. Agron. 1999, 10, 23–36.
9. Farooq, M.; Bramley, H.; Palta, J.A.; Siddique, K.H.M. Heat stress in wheat during reproductive and grain-filling phases. Crit. Rev. Plant Science2011, 30, 1–17.
10. Liu, B.; Asseng, S.; Muller, C.; et al. Similar estimates of temperature impacts on global wheat yield by three independent methods. Nature Climate Change2016, 6, 1130-1136.
11. Lillemo, M.; van Ginkel, M.; Trethowan, R.M.; Hernandez, E.; Crossa, J. Differential adaptation of CIMMYT bread wheat to global high temperature environments. Crop Science2005, 45, 2443–2453.
12. Hansen, J.; Sato, M.; Ruedy, R. Perception of climate change. Proc. Natl. Acad. Sci. USA, 2012; 109, 2415– 2423.
13. United Nations Economic and Social Commission for Western Asia (ESCWA) et al. Arab Climate Change
Assessment Report – Main Report. Beirut, 2017. E/ESCWA/SDPD/2017/RICCAR/Report.
14. Ayeneh, A.; van Ginkel, M.; Reynolds, M.P.; Ammar, K. Comparison of leaf, spike, peduncle, and canopy temperature depression in wheat under heat stress. Field Crops Research 2002, 79,173–184.
15. Yang, J.; Sears, R.G.; Gill, B.S.; Paulsen, G.M. Quantitative and molecular characterization of heat tolerance in hexaploid wheat. Euphytica2002, 126, 275–282.
16. Nachit, M.M.; Elouafi, I. Durum adaptation in the Mediterranean dryland breeding: breeding, stress physiology, and molecular markers. Crop Science Society of America and American Society of Agronomy, CSSA 2004, special publication 32, 203-218.
17. Reynolds, M.P.; Hobbs, P.R.; Braun, H.J. Challenges to international wheat improvement. J Agric Sci 2007, 145, 223–227.
18. Tuberosa, R. Phenotyping for drought tolerance of crops in the genomics era. Frontiers in Physiology2012, 3, 347. doi: 10.3389/fphys.2012.00347
19. Reynolds, M.; Langridge, P. Physiological breeding. Curr. Opin. Plant Biol. 2016, 31, 162–171. doi: 10.1016/j.pbi.2016.04.005.
21. Pinto, R.S.; Reynolds, M.P.; Mathews, K.L.; McIntyre, C.L.; Olivares-Villegas, J.J.; Chapman. S.C. Heat and drought adaptive QTL in a wheat population designed to minimize confounding agronomic effects. Theor. Appl. Genet.2010,121, 1001–1021. doi: 10.1007/s00122-010-1351-4.
22. Bennett, D.; Reynolds, M.; Mullan, D.; Izanloo, A.; Kuchel, H.; Langridge, P.; Schnurbusch, T. Detection of two major grain yield QTL in bread wheat (Triticum aestivum L.) under heat, drought and high yield potential environments. Theoretical and Applied Genetics 2012, 125, 1473-1485.
23. Paliwal, R.; Röder, M.S.; Kumar, U.; Srivastava, J.P.; Joshi, A.K. QTL mapping of terminal heat tolerance in hexaploid wheat (T. aestivum L.). Theoretical and Applied Genetics2012. 125, 561-575.
24. Talukder, S.K.; Babar, M.A.; Vijayalakshmi, K.; Poland, J.; Prasad, P.V.V.; Bowden, R.; Fritz, A. Mapping QTL for the traits associated with heat tolerance in wheat (Triticumaestivum L.). BMC Genetics2014, 15, 97. 25. Shirdelmoghanloo, H.; Taylor, J.D.; Lohraseb, I.; Rabie, H.; Brien, C.; Timmins, A.; Martin, P.; Mather, D.E.; Emebiri, L.; Collins, N.C. A QTL on the short arm of wheat (Triticumaestivum L.) chromosome 3B affects the stability of grain weight in plants exposed to a brief heat shock early in grain filling. BMC Plant Biology
2016, 16, 100.
26. Ogbonnaya, F.C.; Rasheed, A.; Okechukwu, E.C.; Jighly, A.; Makdis, F.; Wuletaw, T.; Hagras, A.; Uguru, M.I.; Agbo, C.U. Genome-wide association study for agronomic and physiological traits in spring wheat evaluated in a range of heat prone environments. Theoretical and Applied Genetics2017, 130, 1819-1835. 27. Sukumaran, S.; Reynolds, M.P.; Sansaloni, C. Genome-Wide Association Analyses Identify QTL Hotspots
for Yield and Component Traits in Durum Wheat Grown under Yield Potential, Drought, and Heat Stress Environments. Front. Plant Science2018,9, 81. doi: 10.3389/fpls.2018.00081.
28. Sall, A.T.; Cisse, M.; Gueye, H.; Kabbaj, H.; Ndoye, I.; Maltouf, A.F.; El-Mourid, M.; Ortiz, R.; Bassi, F.M. Heat tolerance of durum wheat (triticum durum desf.) elite germplasm tested along the Senegal river. Journal of agricultural science 2018, 10, 217-233. https://doi.org/10.5539/jas.v10n2p217
29. Pradhan, G.P.; Prasad, P.V.V.; Fritz, A.; Kirkham, M.B.; Gill, B.S. Effects of drought and high temperature stress on synthetic hexaploid wheat. Functional Plant Biology2012, 39, 190-198.
30. Weldearegay, D.F.; Yan, F.; Jiang, D.; Liu, F. Independent and combined effects of soil warming and drought stress during anthesis on seed set and grain yield in two spring wheat varieties. Journal of Agronomy and Crop Science 2012, 198, 245-253.
31. Kabbaj, H.; Sall, A. T.; Al-Abdallat, A.; Geleta, M.; et al. Genetic diversity within a global panel of durum wheat (Triticumdurum L.) landraces and modern germplasm reveals the history of alleles exchange. Front. Plant Science2017, 8, 1277. doi: 10.3389/fpls.2017.01277.
32. Sall, A.T.; Bassi, F.M.; Cisse, M.; Gueye, H.; Ndoye, I.; Filali-Maltouf, A.; Ortiz, R. Durum wheat breeding: In the heat of the Senegal river. Agriculture2018, 8. doi:10.3390/agriculture8070099.
33. Bates, D.; Maechler, M.; Bolker, B.; Walker, S. Fitting linear mixed-effects models using lme4. J. Stat. Softw. 2015, 67, 1–48. doi:10.18637/jss.v067.i01.
34. R Development Core Team. R: A language and environment for statistical computing. R Found. Stat. Comput., Vienna, 2016.
35. DeLacy, I.H.; Basford, K.E.; Cooper, M.; Bull, J.K.; McLaren, C.G. Analysis of multi-environment trials: An historical perspective. In Plant adaptation and crop improvement; Cooper M., Hammer, G.L., Eds.; CAB Int., Oxfordshire, UK, 1996.
36. Wickham, H. ggplot2: Elegant graphics for data analysis. Springer-Verlag, New York, 2009.
37. Wei, T.; Simko, V. R package “corrplot”: Visualization of a correlation matrix (Version 0.84). R Found. Stat.
Comput., Vienna, 2017. https://github.com/taiyun/corrplot
38. Wood, S.N. Generalized additive models: An introduction with R. Chapman & Hall, CRC (Second edition), 2017; ISBN 9781498728331 - CAT# K25925.
39. Wood, S.N.; Pya, N.; Saefken, B. Smoothing parameter and model selection for general smooth models.
Journal of the American Statistical Association 2016, 111, 1548-1575. http://dx.doi.
org/10.1080/01621459.2016.1180986
40. Fisher, R.A.; Maurer, R. Drought resistance in spring wheat cultivars I. grain yield responses. Austral. J. Agro. Research1978, 29, 897–917. doi: 10.1071/AR9780897.
41. Nachit, M.M.; Ouassou, A. ; Association of yield potential, drought tolerance and stability of yield in Triticum turgidum var durum. In proceedings of the 7th International wheat symposium, Cambridge, UK, 1988. pp. 867-870.
43. Bivand, R.; Ono, H.; Dunlap, R.; Stigler, M. R package classInt: Choose Univariate Class Intervals. 2018. 44. Lenth, R.; Love, J.; Maxime, H. Estimated Marginal Means, aka Least-Squares Means. 2017.
45. Maccaferri, M.; et al. Durum wheat genome highlights past domestication signatures and future improvement targets. Nature genetics2019, 51, 885-895. https://doi.org/10.1038/s41588-019-0381-3
46. Bradbury, P.J.; Zhang, Z.; Kroon, D.E.; Casstevens, T.M.; Ramdoss, Y.; Buckler, E.S. TASSEL: software for association mapping of complex traits in diverse samples. Bioinformatics2007, 23, 2633–2635.
47. Jujumaan. Estimating and plotting the decay of linkage disequilibrium. https://jujumaan.com/2017/07/15/linkage-disequilibrium-decay-plot/ (Accessed 15 July 2017).
48. Bassi, F.; Brahmi, H.; Sabraoui, A.; Amri, A.; Nsarellah, N.; Nachit, M.M.; Al-Abdallat, A.; Chen, M.S.; Lazraq, A.; El Bouhssini, M. Genetic identification of loci for Hessian fly resistance in durum wheat. Mol Breeding 2019, 39, 24. https://doi.org/10.1007/s11032-019-0927-1
49. Sukumaran, S.; Xiang, W.; Bean, S.R.; Pedersen, J.F.; et al. Association mapping for grain quality in a diverse sorghum collection. Plant Genome J. 2012, 5, 126. doi: 10.3835/plantgenome2012.07.0016
50. Duggal, P.; Gillanders, E.M.; Holmes, T.N.; Bailey-Wilson, J.E. Establishing an adjusted p-value threshold to control the family-wide type 1 error in genome wide association studies. BMC Genomics2008, 9:516. 51. Pearson, K. Notes on regression and inheritance in the case of two parents. Proc R Soc Lond1985, 58, 240–
242
52. Sofield, I.; Evans, L.T.; Cook, M.G.; Wardlaw, I.F. Factors influencing the rate and duration of grain filling in wheat. Australian Journal of Plant Physiology1977, 4, 785-797. https://doi.org/10.1071/PP9770785
53. Gooding, M.J.; Ellis, R.H.; Shewry, P.R.; Schofield, J.D. Effects of restricted water availability and increased temperature on the grain filling, drying and quality of winter wheat. Journal of Cereal Science2003, 37, 295– 309.
54. Corbellini, M.; Canevara, M.G.; Mazza, L.; Ciaffi, M.; Lafiandra, D.; Tozzi, L.; Borghi, B. Effect of the duration and intensity of heat shock during grain filling on dry matter and protein accumulation, technological quality and protein composition in bread and durum wheat. Aust J Plant Physiol1997, 24, 245-250.
55. Corbellini, M.; Mazza, L.; Ciaffi, M.; Lafiandra, D.; Borghi, B. Effect of heat shock during grain filling on protein composition and technological quality of wheats. Euphytica1998, 100, 147–154.
56. Nachit, M.M. Durum breeding for Mediterranean drylands of North Africa and West Asia, In Durum wheat: challenges and opportunities, Rajaram, S., Saari, E., Hettel, GP., Eds.; Wheat special report. Mexico, D.F. CIMMYT,1992; 9.
57. Barnabas, B.; Jager, K.; Feher, A. The effect of drought and heat stress on reproductive processes in cereals. Plant Cell Environment2008, 31, 11-38. https://doi.org/10.1111/j.1365 3040.2007.01727.x
58. Reynolds, M.; Foulkes, J.; Furbank, R.; Griffiths, S.; King, J.; Murchie, E.; Parry, M.; Slafer, G. Achieving yield gains in wheat. Plant Cell Environ.2012,35, 1799–1823. doi: 10.1111/j.1365-3040.2012. 02588.x
59. Masoni, A.; Ercoli, L.; Mariotti, M.; Arduini, I. Post-anthesis accumulation and remobilization of dry matter, nitrogen and phosphorus in durum wheat as affected by soil type. European Journal of Agronomy2007, 26, 179-186. https://doi.org/10.1016/j.eja.2006.09.006.
60. Prasad, P.V.V.; Pisipati, S.R.; Mutava, R.N.; Tuinstra, M.R. Sensitivity of grain sorghum to high temperature stress during reproductive development. Crop Sci.2008, 48, 1911–1917.
61. Sukumaran, S.; Lopes, M.; Dreisigacker, S.; Reynolds, M. Genetic analysis of multi-environmental spring wheat trials identifies genomic regions for locus-specific trade-offs for grain weight and grain number. Theor. Appl. Genet2017, 1–14. doi: 10.1007/s00122-017-3037-7.
62. Sio-Se Mardeh, A.; Ahmadi, A.; Poustini, K.; Mohammadi, V. Evaluation of drought resistance indices under various environmental conditions. Field Crops Research2006, 98, 222—229.
63. Dodig, D.; Zoric, M.; Kandic, V.; Perovic, D.; Surlan-Momirovic, G. Comparison of responses to drought stress of 100 wheat accessions and landraces to identify opportunities for improving wheat drought resistance. Plant Breeding2012, 131, 369-379. doi:10.1111/j.1439-0523.2011.01941. x.
64. Mason, R.E.; Mondal, S.; Beecher, F.W.; Pacheco, A.; Jampala, B.; Ibrahim, A.M.H.; Hays, D.B. QTL associated with heat susceptibility index in wheat (Triticum aestivum L.) under short-term reproductive stage heat stress. Euphytica2010, 174, 423–436.
66. Orcen, N.; Altinbas, M. Use of some stress tolerance indices for late drought in spring wheat. Fresenius Environmental bulletin, 2014; 23 (9a).
67. Clarke, J.M.; Depauw, R.M.; Townley-Smith, T.F. Evaluation of methods for quantification of drought tolerance in wheat. Crop Science1992, 32, 723-728.
68. Rekika, D.; Kara, Y.; Souyris, I.; Nachit, M.M.; Asbati, A.; Monneveux, P. The tolerance of PSII to high temperatures in durum wheat (T. Turgidum conv. Durum): genetic variation and relationship with yield under heat stress. Cereal Research Communications2000, 28, 395-402.
69. Lopes, M.S.; Reynolds, M.P.; Jalal-Kamali, M.R.; Moussa, M.; Feltaous, Y.; Tahir, I.S.A.; Barma, N.; Vargas, M.; Mannes, Y.; Baum, M. The yield correlations of selectable physiological traits in a population of advanced spring wheat lines grown in warm and drought environments. Field Crops. Research2012, 128, 129–136.
70. Reynolds, M.; Tuberosa, R. Translational research impacting on crop productivity in drought-prone environments. Curr Opin Plant Biol. 2008, 11, 171–179.
71. Heidari, B.; Sayed-Tabatabaei, B.E.; Saeidi, G.; Kearsey, M.; Suenaga, K. Mapping QTL for grain yield, yield components, and spike features in a doubled haploid population of bread wheat. Genome2011, 54, 517–527. doi.org/10.1139/g11-017.
72. Tahmasebi, S.; Heidari, B.; Pakniyat, H.; McIntyre, C.L. Mapping QTLs associated with agronomic and physiological traits under terminal drought and heat stress conditions in wheat (Triticum aestivum L.). Genome2017,60, 26-45.
73. Quarrie, S.A.; Steed, A.; Calestani, C.; Semikhodskii, A.; et al. A high-density genetic map of hexaploid wheat (Triticumaestivum L.) from the cross Chinese Spring x SQ1 and its use to compare QTL for grain yield across a range of environments. Theor Appl Genet. 2005, 110, 865–880. doi:org/10.1007/s00122-004- 1902-7.
74. Acuna-Galindo, M.A.; Mason R.E.; Subrahmanyam, N.K.; Hays D. Meta-analysis of wheat QTL regions associated with adaptation to drought and heat stress. Crop Science2014, 55, 477–492.
75. McIntyre, C.L.; Mathews, K.L.; Rattey, A.; Drenth, J.; Ghaderi, M.; Reynolds, M.; Chapman, C.S.; Shorter, R. Molecular detection of genomic regions associated with grain yield and yield components in an elite bread wheat cross evaluated under irrigated and rainfed conditions. Theor Appl Genet.2010, 120, 527–541. doi:10.1007/s00122-009-1173-4.
76. Araus, J.L.; Bort, J.; Steduto, P.; Villegas, D.; Royo, C. Breeding cereals for Mediterranean conditions: ecophysiological clues for biotechnology application. Annals of Applied Biology 2003, 142, 129–141. doi: 10.1111/j.1744-7348. 2003.tb00238. x.
77. Slafer, G.A.; Araus, J.L.; Royo, C.; García Del Moral, L.F. Promising eco-physiological traits for genetic improvement of cereal yields in Mediterranean environments. Annals of Applied Biology2005, 146, 61–70. doi: 10.1111/j.1744-7348.2005. 04048.x.
78. McCartney, C.A.; Somers, D.J.; Humphreys, D.G.; Lukow, O.; Ames, N.; Noll, J.; Cloutier, S.; McCallum, B.D. Mapping quantitative trait loci controlling agronomic traits in the spring wheat cross RL4452 9 ‘AC
Domain’. Genome2005, 48, 870–883. doi:org/10.1139/g05-055.
79. Collins, N.C.; Tardieu, F.; Tuberosa, R. Quantitative trait loci and crop performance under abiotic stress: Where do we stand? Plant Physiol2008, 147, 469–486. doi:org/10.1104/pp.108.118117.
80. Rebetzke, G.J.; van Herwaarden, A.F.; Jenkins, C.; Weiss, M.; Lewis, D.; Ruuska, S.; Tabe, L.; Fettell, N.A.; Richards, R.A. Quantitative trait loci for water soluble carbohydrates and associations with agronomic traits in wheat. Aust J Agric Res2008, 59, 891–905. doi:org/10.1071/AR08067.
81. Zaim, M.; El Hassouni, K.; Gamba, F.; Filali-Maltouf, A.; Belkadi, B.; Ayed, S.; Amri, A.; Nachit, M.; Taghouti, M.; Bassi, F. Wide crosses of durum wheat (Triticum durum Desf.) reveal good disease resistance, yield stability, and industrial quality across Mediterranean sites. Field Crops Research2017, 214, 219-227. 82. Bassi, F.; Sanchez-Garcia, M. Adaptation and stability analysis of ICARDA durum wheat elites across 18
countries. Crop Science2017, 57, 2419-2430.