O R I G I N A L R E S E A R C H
Life expectancy and years of life lost in chronic
obstructive pulmonary disease: Findings
from the NHANES III Follow-up Study
Robert M Shavelle1
David R Paculdo1
Scott J Kush1
David M Mannino2
David J Strauss1
1Life Expectancy Project, San Francisco, CA, USA; 2Pulmonary Epidemiology Research Laboratory, University of Kentucky School of Medicine, Division of Pulmonary and Critical Care Medicine, Lexington, KY, USA.
Correspondence: Robert M Shavelle Life Expectancy Project, 1439 – 17th Avenue, San Francisco,
CA 94122-3402, USA Tel +1 415 731 0240 Fax +1 415 731 0290
Email Shavelle@LifeExpectancy.org
Rationale: Previous studies have demonstrated that chronic obstructive pulmonary disease (COPD) causes increased mortality in the general population. But life expectancy and the years of life lost have not been reported.
Objectives: To quantify mortality, examine how it varies with age, sex, and other risk factors, and determine how life expectancy is affected.
Methods: We constructed mortality models using the Third National Health and Nutrition Examination Survey, adjusting for age, sex, race, and major medical conditions. We used these to compute life expectancy and the years of life lost.
Measurements and main results: Pulmonary function testing classifi ed patients as having Global Initiative on Obstructive Lung Disease (GOLD) stage 0, 1, 2, 3 or 4 COPD or restriction. COPD is associated with only a modest reduction in life expectancy for never smokers, but with a very large reduction for current and former smokers. At age 65, the reductions in male life expectancy for stage 1, stage 2, and stages 3 or 4 disease in current smokers are 0.3 years, 2.2 years, and 5.8 years. These are in addition to the 3.5 years lost due to smoking. In former smokers the reductions are 1.4 years and 5.6 years for stage 2 and stages 3 or 4 disease, and in never smokers they are 0.7 and 1.3 years.
Conclusions: Persons with COPD have an increased risk of mortality compared to those who do not, with consequent reduction in life expectancy. The effect is most marked in current smokers, and this is further reason for smokers to quit.
Keywords: survival, mortality, longevity, COPD
Introduction
Chronic obstructive pulmonary disease (COPD) is a progressive lung disease where airways in the lungs are damaged. It is a major cause of morbidity and mortality in the
United States and around the world.1–8 In the United States, COPD was responsible
for over 120,000 deaths in 2004 and is the only cause of death in the top fi ve to have
been increasing since 1990.9 Prevalence estimates in the United States range from 10
to 16 million adults, but the condition may be under-diagnosed.10,11 The overall
attribut-able morbidity and mortality from COPD may, therefore, be underestimated. Risk factors for COPD include genetic factors and environmental exposures. The
major exposures are tobacco smoke, occupational dusts and chemicals, and pollution.12
In industrialized nations, tobacco smoke is the biggest risk factor, where up to 50%
of long-term smokers will develop COPD,13 while in less industrialized nations it is
exposure to air pollution.14 Conversely, of persons with COPD in the western world,
roughly 50% have smoking as the underlying etiology.13 Symptoms generally emerge
after age 40, but can manifest earlier.
Mannino and colleagues4 analyzed data from the First National Health and Nutrition
Examination Survey (NHANES I), using a modifi ed version of the Global Initiative
International Journal of Chronic Obstructive Pulmonary Disease downloaded from https://www.dovepress.com/ by 118.70.13.36 on 22-Aug-2020
Shavelle et al
for Chronic Obstructive Lung Disease (GOLD) criteria for COPD and other respiratory disease in that population. The authors reported all-cause mortality relative risks (RRs) for COPD based on multivariable models that controlled for smoking status, pack-year history, years since last regularly smoked, body mass index (BMI), and a number of demographic variables. The RRs ranged from 1.2 for mild COPD to 1.7 for severe. Some other studies also reported
RRs based on severity.2,7,15,16 To our knowledge, however,
no studies have reported life expectancies in COPD, or the years of life lost.
Our primary goal was to compute life expectancy and the years of life lost due to COPD. To do so we required quantifi -cation of the excess mortality associated with COPD. We thus sought to calculate the associated excess death rates (EDRs) and RRs, and to investigate whether these varied by age, sex, race, education, smoking status, the presence of concomitant medical conditions, and time since evaluation. We were particularly interested in how the RRs varied with age, as we have found in other chronic conditions that it declines with age.17,18 Using the aforementioned results, we then computed
life expectancies for the various groups, in order to determine the years of life lost due to COPD. As noted, these quantities have not been reported in the literature.
Methods
Study population
The Third National Health and Nutrition Examination Survey (NHANES III) was conducted 1988 to 1994 by the National Center for Health Statistics on a nationwide probability sample of 33,994 persons aged two months and older through
interviews and direct physical examinations.19,20 To focus on
the effects of COPD in an older population, we restricted attention to the 6,261 adults over age 50 who had a reliable or reproducible pulmonary test and smoking history (except as noted below). Of these persons, 3,555 were smokers or former smokers and 3,362 had pack-year history. Pipe or cigar smokers were counted as current or former smokers as appropriate, but we did not have pack year history on these persons.
Measurements
Examiners used either a dry rolling seal spirometer in the mobile examination center or a portable spirometer in the home examination to conduct pulmonary function testing. Testing procedures were based on the 1987 American
Thoracic Society recommendation.21 Subjects performed 5
to 8 forced expirations in order to obtain acceptable protocol
curves. Predicted forced expiratory volume in one second
(FEV1) was calculated using previously published prediction
equations from the NHANES III data, stratifi ed by sex, age,
and race.22–25 Persons were considered as having COPD only
if confi rmed by pulmonary function testing. Otherwise they were assumed to have no lung disease (Normal) or GOLD stage 0 if they reported respiratory symptoms. The severity
scale for COPD used by Mannino and colleagues4 and in the
present study is shown in Figure 1.
Statistical analysis
Analyses were performed using the statistical package SAS
9.1 for Windows (SAS Institute, Cary, NC).26 Kaplan–Meier
survival curves were produced for various groups.27 Cox
proportional hazards regression models were developed using the “PROC PHREG” procedure in SAS. These models provide hazard ratios (or, equivalently, RRs) for each potential mortality risk factor. The variables included in one or more of the multivariable regression models were: Age, sex, race, smoking status, pack-years of cigarette smoking, BMI, major medical conditions, and lung function (COPD) category. The models were used to compute mortality rates for various groups, including 65 year-old males with the given severities of COPD. The difference between a given rate and the corresponding general population (or other baseline) mortality rate is the EDR, which were computed for the various groups.
Life expectancies were computed for the same groups by
using the above mortality rates to construct a life table.28–30
A remaining issue was the imputation of some mortality rates. When the EDR was positive (increased risk compared with the general population), the assumption of proportional
life expectancy (PLE)18,29 was used to obtain the mortality
rates at older ages. In brief, this method assumes that the proportion of normal life expectancy for a given medical
condition is the same at every age.18,29 For example, if the
life expectancy in mild COPD is 90% of normal at age 50, then under PLE it would be 90% of normal at age 70 as well. When the EDR was negative, it was assumed to approach zero with age, much as persons in above-average health revert to the mean.
Results
The mean duration of follow-up of the 6,261 persons studied was 7.9 years (with standard deviation 2.8 years), and there were 1,873 deaths. Table 1 shows the baseline demographic characteristics of the cohort. Overall, the percentages of persons with spirometric evidence of COPD were: GOLD
International Journal of Chronic Obstructive Pulmonary Disease downloaded from https://www.dovepress.com/ by 118.70.13.36 on 22-Aug-2020
Life expectancy in COPD
stage 1: 16%, GOLD stage 2: 12%, GOLD stage 3 or 4: 3%, and restriction: 8%.
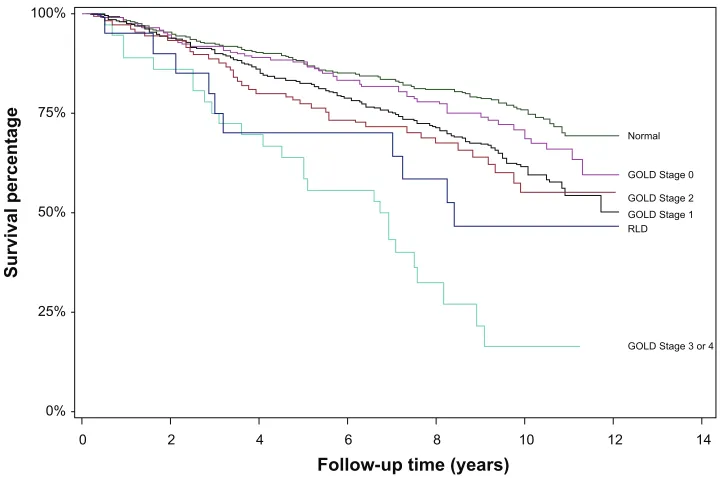
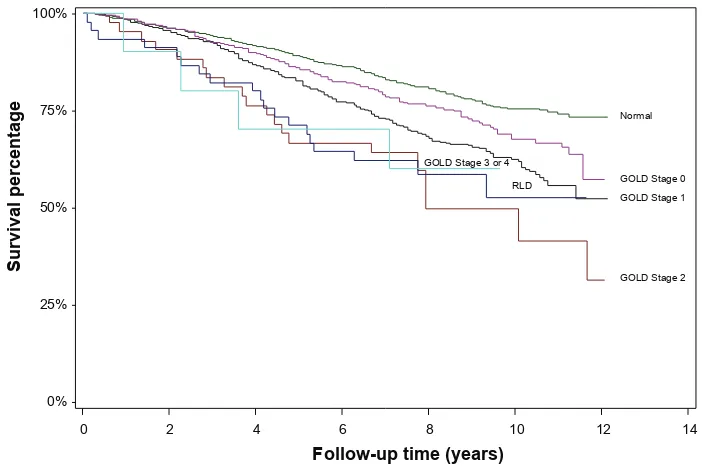
Figures 2–5 show the Kaplan–Meier survival curves based on severity of COPD, both for the entire population and stratifi ed by smoking status. In all cases, any lung function impairment was associated with an increased risk of death.
These curves were used to compute the (crude) EDRs associated with COPD that are shown in Table 2. For example, amongst smokers, the 10-year survival probability persons with no lung disease was 75%, compared with 65% for persons with COPD symptoms, 63% for stage 1, 58% for stage 2, and approximately 15% for stage 3 or 4. The associated annual mortality rate over the 10-year period for
smokers with no lung disease is thus –ln(0.75)/10 = 0.0288.
For stages 1, 2, and 3 or 4 COPD, the rates are 0.0462, 0.0545, and 0.1897, respectively. Thus, the EDR over the 10-year period for smokers with stage 1 COPD, compared with
smokers with no lung disease, is 0.0462 − 0.0288 = 0.0174.
For stages 2 and 3 or 4 COPD, the EDRs are higher, 0.0257
and 0.1609, respectively. EDRs for all 24 groups are shown in Table 2. It is important to note that these are crude EDRs, unadjusted for any possible confounding factors.
The EDRs implicit in the “All” group in Figure 2 of
Mannino and colleagues4 are roughly one-third lower than
those reported in Table 2 here. The reason is that the EDR increases with age, and the Mannino and colleagues study population was signifi cantly younger than the population used here: unlike the present study, half their population was under age 50 at the start of follow-up.
Additional analyses (not shown) indicated that persons with COPD, compared to those without lung disease, tended to be older and male, and of course were much more likely to be smokers. It is important to note that the survival curves in Figures 2–5 were not adjusted for any of the covari-ates. Thus, the EDRs given in Table 2 may be confounded with the effects of these covariates. We wished to obtain an unconfounded (or pure) estimate of the EDRs or RRs associated with COPD. For this we required multivariate
Classification
Stage 0 (Symptoms Only)
FEV1/FVC < 70% FEV1 ≥ 80% predicted
With or without chronic symptoms
FEV1/FVC < 70%
50% ≤ FEV1< 80% predicted
With or without chronic symptoms
FEV1/FVC < 70%
30% < FEV1< 50% predicted With or without chronic symptoms
Restrictive lung disease (RLD) Stage 1 (Mild)
Stage 2 (Moderate)
FEV1/FVC ≥70% FVC < 80% predicted
Stage
Normal spirometry
Presence of respiratory symptoms
Stage 3 or 4 (Severe)
Figure 1 Seventy scale for COPD.
Notes: Thosewho were diagnosed by a physician as having chronic bronchitis, emphysema, or asthma but did not have COPD or RLD according to the above criteria were classifi ed as GOLD stage 0 (if they reported symptoms) or Normal (if they reported no symptoms). Persons who had a positive response to (a) having a cough for three consecutive months out of the year, (b) phlegm fi rst-thing in the morning three consecutive months out of the year, or (c) wheezing in the past 12 months, were considered as having GOLD stage 0 if their pulmonary function testing did not indicate COPD or RLD.
Abbreviations: COPD,chronic obstructive pulmonary disease; GOLD, Global Initiative for Chronic Obstructive Lung Disease; FEV1, forced expiratory volume in one second; FVC, forced vital capacity; RLD, restrictive lung disease.
International Journal of Chronic Obstructive Pulmonary Disease downloaded from https://www.dovepress.com/ by 118.70.13.36 on 22-Aug-2020
Shavelle et al
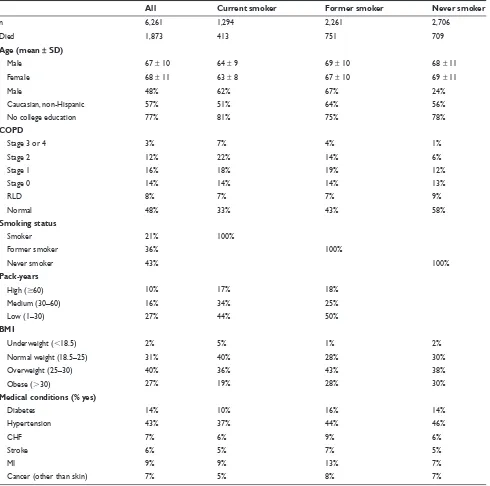
Table 1 Demographics and description of key variables. All fi gures are column percentages except for counts (n, died) and age
All Current smoker Former smoker Never smoker
n 6,261 1,294 2,261 2,706
Died 1,873 413 751 709
Age (mean ± SD)
Male 67 ± 10 64 ± 9 69 ± 10 68 ± 11
Female 68 ± 11 63 ± 8 67 ± 10 69 ± 11
Male 48% 62% 67% 24%
Caucasian, non-Hispanic 57% 51% 64% 56%
No college education 77% 81% 75% 78%
COPD
Stage 3 or 4 3% 7% 4% 1%
Stage 2 12% 22% 14% 6%
Stage 1 16% 18% 19% 12%
Stage 0 14% 14% 14% 13%
RLD 8% 7% 7% 9%
Normal 48% 33% 43% 58%
Smoking status
Smoker 21% 100%
Former smoker 36% 100%
Never smoker 43% 100%
Pack-years
High (ⱖ60) 10% 17% 18%
Medium (30–60) 16% 34% 25%
Low (1–30) 27% 44% 50%
BMI
Underweight (⬍18.5) 2% 5% 1% 2%
Normal weight (18.5–25) 31% 40% 28% 30%
Overweight (25–30) 40% 36% 43% 38%
Obese (⬎30) 27% 19% 28% 30%
Medical conditions (% yes)
Diabetes 14% 10% 16% 14%
Hypertension 43% 37% 44% 46%
CHF 7% 6% 9% 6%
Stroke 6% 5% 7% 5%
MI 9% 9% 13% 7%
Cancer (other than skin) 7% 5% 8% 7%
Abbreviations: BMI, body mass index; CHF, congestive heart failure; COPD, chronic obstructive pulmonary disease; MI, myocardial infarction; RID, restrictive lung disease.
statistical methods, such as the Cox proportional hazards regression model.
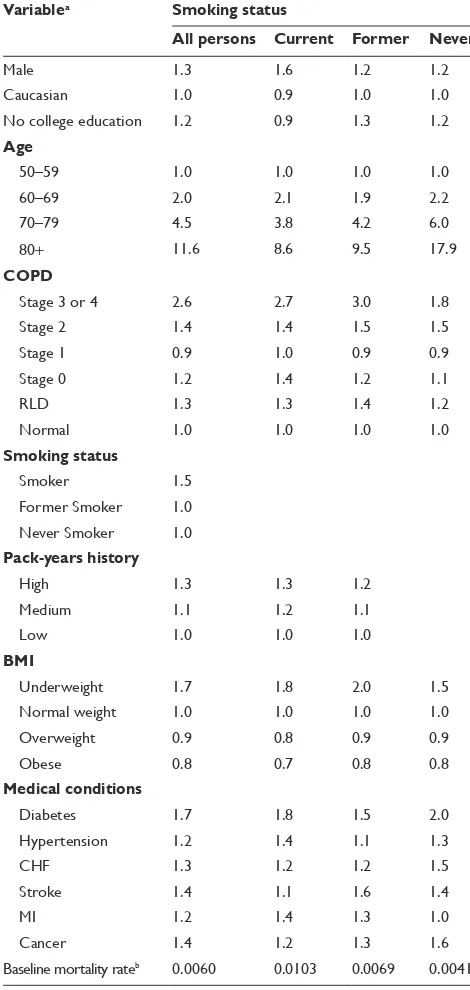
Cox models were used to adjust for age, sex, race, education, smoking status, smoking history, weight, and major medical conditions. The variables, their various levels, and the associated relative risks of mortality are shown in Table 3.
As expected, the relative risks associated with COPD increased with increasing severity of COPD. In all cases the relative ordering of severity was preserved in the resulting RRs. However, as can be seen, the stage 1 group had a relative
risk that, in 3 of the 4 cases, was actually less than that of the reference group (stage 0), though the differences were neither practically nor statistically signifi cant. We return to this issue in the discussion. Those with restrictive lung disease (RLD) or symptoms of COPD, but no formal diagnosis, both had uniformly increased risk of death compared with those with no lung disease.
Other analyses (not shown), using models that (a) accounted for only age, sex, and COPD, and (b) were based on different subsets of data, yielded similar results. Separate
International Journal of Chronic Obstructive Pulmonary Disease downloaded from https://www.dovepress.com/ by 118.70.13.36 on 22-Aug-2020
Life expectancy in COPD
analysis of pipe and cigar smokers (not shown) revealed that
their mortality risk was similar to that of smokers (RR = 1.0),
and higher than that of former smokers (RR = 1.1).
Further analyses (not shown) revealed that the effect of COPD did not appear to vary by sex, race, or college education. That is, there were no signifi cant interactions. But it did vary by age, as we hypothesized, with older persons having
a lower RR than younger persons (results not shown). This was true for those with stage 2 and 3 or 4 COPD, and amongst current, former, and never smokers, with one exception (it did not hold for the former smokers with moderate COPD). We comment further on this issue in the discussion.
The last row of Table 3 shows the mortality rate for the composite baseline group: female, age 50–59, non-Caucasian,
Normal
GOLD Stage 0
GOLD Stage 1
RLD
GOLD Stage 2
GOLD Stage 3 or 4 100%
75%
50%
25%
0%
0 2 4 6 8 10 12 14
Follow-up time (years)
Survival percentage
Figure 2 Kaplan–Meier survival curves of all 6,261 participants age 50 and over in NHANES III, stratifi ed by lung function impairment.
Figure 3 Kaplan–Meier survival curves of 1,294 current smokers age 50 and over in NHANES III, stratifi ed by lung function impairment.
Normal
GOLD Stage 0
GOLD Stage 1 RLD GOLD Stage 2
GOLD Stage 3 or 4 100%
75%
50%
25%
0%
0 2 4 6 8 10 12 14
Follow-up time (years)
Survival percentage
International Journal of Chronic Obstructive Pulmonary Disease downloaded from https://www.dovepress.com/ by 118.70.13.36 on 22-Aug-2020
Shavelle et al
college education, no lung disease, never smoker (fi rst model only), low pack-years of smoking (models 1–3 only), normal weight, and no other medical conditions. As can be seen, even “healthy” current smokers, with low pack-years, have a baseline mortality rate that is much higher than the never smokers (0.0103 vs. 0.0041). By comparison, we note that the corresponding annual mortality rates at age 55 for the
United States female general population28 and the insured
population (at time of underwriting)31 are 0.0048 and 0.0009,
respectively. That is, the best group contemplated by the models is slightly better than the general population, but does not have mortality as low as the recently insured (who have additionally demonstrated normal blood work, urinalysis, and electrocardiogram).
The RRs from Table 3 can also be used to compute the mortality rate for any combination of levels of the covariates
Normal GOLD Stage 0
GOLD Stage 1
RLD
GOLD Stage 2 GOLD Stage 3 or 4 100%
75%
50%
25%
0%
0 2 4 6 8 10 12 14
Follow-up time (years)
Survival percentage
Figure 4 Kaplan–Meier survival curves of 2,261 former smokers age 50 and over in NHANES III, stratifi ed by lung function impairment.
Normal
GOLD Stage 0
GOLD Stage 1 RLD
GOLD Stage 2 GOLD Stage 3 or 4
100%
75%
50%
25%
0%
0 2 4 6 8 10 12 14
Follow-up time (years)
Survival percentage
Figure 5 Kaplan–Meier survival curves of 2,706 never smokers age 50 and over in NHANES III, stratifi ed by lung function impairment.
International Journal of Chronic Obstructive Pulmonary Disease downloaded from https://www.dovepress.com/ by 118.70.13.36 on 22-Aug-2020
Life expectancy in COPD
in the model. For example, using the “All” group, the mortality rate for a 75 year-old male, Caucasian, no college education, no lung disease, smoker, medium pack-years, normal weight, with no medical conditions is 0.0060 * 1.3 *
1.0 * 1.2 * 4.5 * 1.0 * 1.5 * 1.1 * 1.0 = 0.0695.
We used the model of Table 3 to compute mortality rates for various groups of 65-year-old Caucasian males with col-lege education, normal weight, and no medical conditions (for the smoking groups we assumed low pack-years, and for the “all” group we assumed “never smoker”). These rates are shown in Table 4.
We computed the EDRs implicit in Table 4 by subtracting from each the US male general population mortality rate at age 65 (0.0186). The resulting EDRs are shown in Table 5. As can be seen, these are smaller than the EDRs of Table 2 for the “all”, former, and never groups, and higher for some of the smoking groups. Otherwise, there is no clear pattern. That the EDRs would differ between the tables is under-standable, as the former are crude (or possibly confounded) while the latter are at least partially adjusted for the factors in the models of Table 3 (that is, computed after controlling for the factors in the models, including having no medical conditions).
Implicit in Table 5 is the observation that the EDRs for COPD are higher for smokers than for nonsmokers or never smokers. For example, within current smokers, the EDR for stage 3 or 4 COPD compared with mild COPD is
0.0601 − 0.0109 = 0.0492 whereas for never smokers it is
only 0.0010 − (−0.0077) = 0.0087. This is one example of
“super-additivity”, where the risk associated with two factors (here, smoking and COPD) is greater than the sum of the separate risks associated with these factors. Super-additivity is also seen, for example, with respect to smoking and dia-betes. We return to this issue in the discussion.
We next used the rates of Table 4 to compute life expectancies for the 24 (male) groups. The indicated rates
Table 2 Excess deaths rates from Figures 2–5, relative to persons with no lung disease
Group Smoking status
All Current Former Never
Normal Reference Group
Stage 0 (Symptoms only) 0.0098 0.0143 0.0128 0.0055 Restrictive lung disease 0.0174 0.0069 0.0292 0.0190
Stage 1 0.0190 0.0174 0.0223 0.0207
Stage 2 0.0310 0.0257 0.0366 0.0257
Stage 3 or 4 0.0884 0.1609 0.1484 0.0707
Table 3 Relative risks from multivariable Cox proportional hazards regressions models
Variablea Smoking status
All persons Current Former Never
Male 1.3 1.6 1.2 1.2
Caucasian 1.0 0.9 1.0 1.0
No college education 1.2 0.9 1.3 1.2 Age
50–59 1.0 1.0 1.0 1.0
60–69 2.0 2.1 1.9 2.2
70–79 4.5 3.8 4.2 6.0
80+ 11.6 8.6 9.5 17.9
COPD
Stage 3 or 4 2.6 2.7 3.0 1.8
Stage 2 1.4 1.4 1.5 1.5
Stage 1 0.9 1.0 0.9 0.9
Stage 0 1.2 1.4 1.2 1.1
RLD 1.3 1.3 1.4 1.2
Normal 1.0 1.0 1.0 1.0
Smoking status
Smoker 1.5
Former Smoker 1.0 Never Smoker 1.0 Pack-years history
High 1.3 1.3 1.2
Medium 1.1 1.2 1.1
Low 1.0 1.0 1.0
BMI
Underweight 1.7 1.8 2.0 1.5
Normal weight 1.0 1.0 1.0 1.0
Overweight 0.9 0.8 0.9 0.9
Obese 0.8 0.7 0.8 0.8
Medical conditions
Diabetes 1.7 1.8 1.5 2.0
Hypertension 1.2 1.4 1.1 1.3
CHF 1.3 1.2 1.2 1.5
Stroke 1.4 1.1 1.6 1.4
MI 1.2 1.4 1.3 1.0
Cancer 1.4 1.2 1.3 1.6
Baseline mortality rateb 0.0060 0.0103 0.0069 0.0041
Notes:aThe respective reference groups for these relative risks are persons who are: female, non-Caucasian, college education, aged 50–59, no lung disease, never smoker (for the fi rst model), low pack-years (for the fi rst three models), normal weight, and without any of the specifi ed medical conditions. bThis the mortality rate for persons in the reference group described immediately above. It is computed by setting the values of the covariates (variables) in the respective models equal to zero.
Abbreviations: BMI, body mass index; CHF, congestive heart failure; COPD, chronic obstructive pulmonary disease; MI, myocardial infarction; RID, restrictive lung disease.
were used for age 65. Because we found that the RR decreases with age (and the EDR increases with age), an assumption of constant EDR or constant RR with age was not war-ranted. Of course we could have used the model of Table 3
International Journal of Chronic Obstructive Pulmonary Disease downloaded from https://www.dovepress.com/ by 118.70.13.36 on 22-Aug-2020
Shavelle et al
to compute mortality rates at all ages. Yet, as just noted, the RR decreases with age. Thus, using model-based rates at all ages would overestimate mortality and, thus, underestimate life expectancy. We opted to take a middle position: the use
of proportional life expectancy (PLE).18,29 It can be shown
that this method has implications for the EDR at every age,18,29 upon which it follows that our approach here could
rely equally on the rates of Table 4 or the EDRs of Table 5. For females, the corresponding mortality rates are shown in Table 6, and the EDRs in Table 7.
Life expectancies based on the rates of Tables 4 and 5 are given in Table 8. As can be seen, the best group – never smokers with no signifi cant lung disease and no medical conditions – have a life expectancy of 17.8 additional years. Not surprisingly, this is higher than the corresponding fi gure in the United States general population (16.8 years). By contrast, current smokers with no lung disease have a life expectancy of 14.3 years, or 3.5 years lower than 17.8, similar
to the fi nding of Doll and colleagues.32 As expected, the
presence of COPD further decreases the life expectancy. Current smokers with stage 1 COPD have a life expectancy of 14.0 years, or 0.3 years lower. Smokers with stage 2 COPD have a life expectancy of 12.1 years, or 2.2 years lower. Those with stage 3 or 4 COPD have a life expectancy of
8.5 years, or 5.8 years lower. Former smokers lose 0.5 years for smoking, 1.4 additional years for stage 2 COPD and 5.6 additional years for stage 3 or 4 COPD, compared with otherwise similar persons who do not have lung disease. By contrast, never smokers lose only 0.7 years for stage 2 COPD and 1.3 years for stages 3 or 4 COPD. The two cases with an increase in life expectancy for COPD compared with no lung disease (stage 1 COPD in former and never smokers) are undoubtedly both due to the comparatively large standard errors (not shown) in the respective stage 1 parameter estimates of Table 3. The standard errors are much smaller for the other parameters. In sum, the years of life lost due to stages 2, 3, or 4 COPD is signifi cant in current and former smokers, and modest in nonsmokers and those with stage 1 COPD.
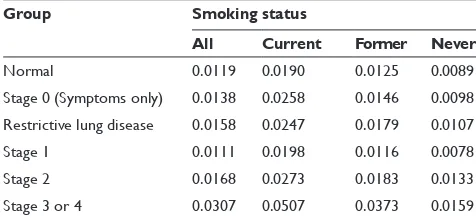
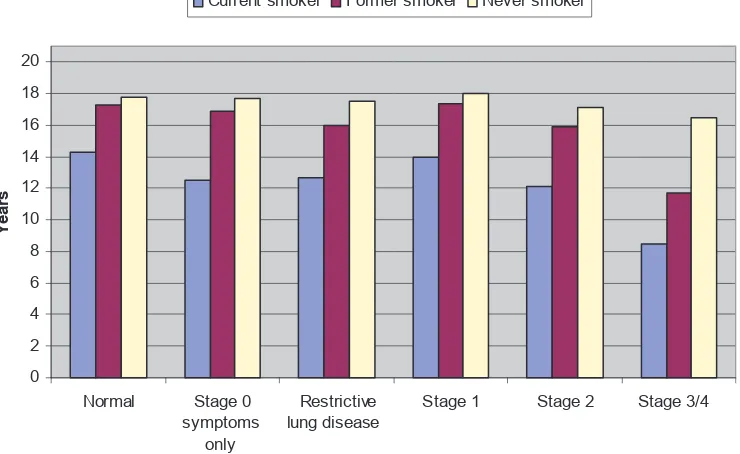
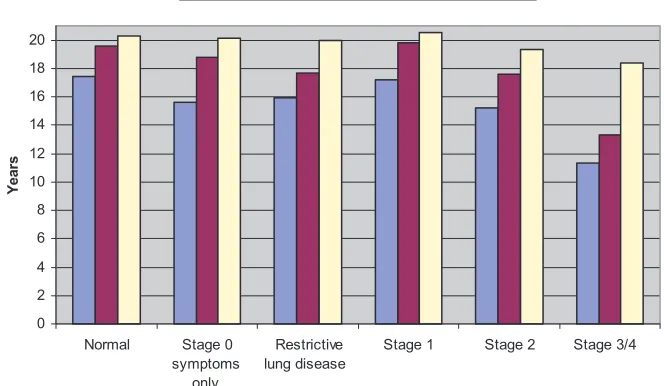
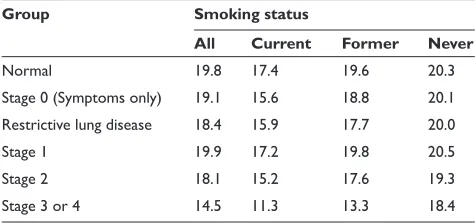
Table 9 shows the corresponding values for females (using the mortality rates in Table 6 or the EDRs in Table 7). As with males, the reductions in life expectancy are signifi cant for both smokers and those with stage 2, 3, or 4 COPD. For example, never smokers with stage 3 or 4 COPD lose 1.9 years of life, while smokers with stage 3 or 4 COPD lose 9.0 years, or 44% of the 20.3 years that obtains for a never smoker with no lung disease. The life expectancies in Tables 8 and 9 are shown graphically in Figures 6 and 7.
Table 4 Mortality rates for otherwise healthy 65-year-old Caucasian males based on the models of Table 3
Group Smoking status
All Current Former Never
Normal 0.0153 0.0295 0.0151 0.0109
Stage 0 (Symptoms only) 0.0179 0.0400 0.0176 0.0120 Restrictive lung disease 0.0204 0.0383 0.0216 0.0132
Stage 1 0.0143 0.0308 0.0140 0.0096
Stage 2 0.0217 0.0424 0.0221 0.0164
Stage 3 or 4 0.0397 0.0787 0.0449 0.0196
Table 5 Excess death rates for otherwise healthy 65-year-old Caucasian males, computed as Table 4 less the mortality rates for males aged 65 in the general population (0.0186)
Group Smoking status
All Current Former Never Normal −0.0033 0.0109 −0.0035 −0.0077 Stage 0 (Symptoms only) −0.0007 0.0214 −0.0010 −0.0066 Restrictive lung disease 0.0018 0.0197 0.0030 −0.0054 Stage 1 −0.0043 0.0122 −0.0046 −0.0090
Stage 2 0.0031 0.0238 0.0035 −0.0022
Stage 3 or 4 0.0211 0.0601 0.0263 0.0010
Table 6 Mortality rates for otherwise healthy 65-year-old Caucasian females based on the models of Table 3
Group Smoking status
All Current Former Never
Normal 0.0119 0.0190 0.0125 0.0089
Stage 0 (Symptoms only) 0.0138 0.0258 0.0146 0.0098 Restrictive lung disease 0.0158 0.0247 0.0179 0.0107
Stage 1 0.0111 0.0198 0.0116 0.0078
Stage 2 0.0168 0.0273 0.0183 0.0133
Stage 3 or 4 0.0307 0.0507 0.0373 0.0159
Table 7 Excess death rates for otherwise healthy 65-year-old Caucasian females, computed as Table 6 less the mortality rates for females aged 65 in the general population (0.0120)
Group Smoking status
All Current Former Never Normal −0.0001 0.0070 0.0005 −0.0031 Stage 0 (Symptoms only) 0.0018 0.0138 0.0026 −0.0022 Restrictive lung disease 0.0038 0.0127 0.0059 −0.0013 Stage 1 −0.0009 0.0078 −0.0004 −0.0042
Stage 2 0.0048 0.0153 0.0063 0.0013
Stage 3 or 4 0.0187 0.0387 0.0253 0.0039
International Journal of Chronic Obstructive Pulmonary Disease downloaded from https://www.dovepress.com/ by 118.70.13.36 on 22-Aug-2020
Life expectancy in COPD
As noted, the models of Table 3 can be used to compute mortality rates, and thus life expectancies, for any combinations of the covariates. We could thus construct tables similar to Tables 8 and 9 for persons aged 55 or 75, or those with diabetes.
Discussion
Although the number of persons with COPD seems unusu-ally high compared to other published reports (31% vs
15%),12 our population was comparatively older, and
oth-ers have noted that COPD is generally underdiagnosed in
the general population.10–11 Persons who exhibit no signs
or symptoms of abnormal lung function are unlikely to be tested by spirometry, and thus are unlikely to be diagnosed with COPD. Another possible reason for the high number of persons with COPD could be related to the fact that persons who are older will naturally have a lower lung function compared to their younger counterparts. While
Hankinson and colleagues22 attempted to account for this
in their regression model for adults, it is possible that a single equation for all adults may not properly estimate the
predicted FEV1 and forced vital capacity (FVC) at older
ages. Thus, persons who actually might have normal lung function for their age might incorrectly be placed into the category of mild COPD. The effect of this is to dilute the relative risks for older persons with mild COPD, and in fact may account for the nonsignifi cant relative risk for mild COPD that we found.
Mannino and colleagues4 reported a relative risk of 1.2
for mild COPD. This was higher than the RRs we found (which were very close to 1.0). Their data (NHANES I) spanned 30 years of follow-up, while ours (NHANES III) spanned only 12. Perhaps, in the intervening 18 years, persons with mild COPD went on to develop more serious COPD.
Hoogendern and colleagues33 studied the issue of COPD
progression. They reported annual transition rates from mild to moderate COPD of 1.8%, 2.1% and 2.5% for nonsmokers, former smokers, and current smokers, respectively. For moderate to severe COPD the rates were 3.0%, 3.4%, and 3.7%, respectively. Over a 12-year period, therefore, at least
22% [= 100% – (100% − 2%)^12] would progress, and
therefore be subject to an increased relative risk.
The excess risk in COPD increases with the severity of COPD. These fi ndings have been replicated across several databases, and by many research groups. We comment here on four such studies.
1. Lee and colleagues,15 in analyzing the Health and
Retirement Survey data, reported an odds ratio of 2.3 for persons with lung disease even after adjusting for age, sex, co-morbidities, and functional measures (bathing, managing fi nances, etc). Our values are mostly lower, likely due to our study population being older (see discussion below about the effect of advancing age).
2. Ekberg-Aronsson and colleagues2 reported relative risks
by gender and smoking status. They found relative risks of 2.4 and 3.6 for male smokers in the GOLD stage 3 or
0 2 4 6 8 10 12 14 16 18 20
Normal Stage 0
symptoms only
Restrictive lung disease
Stage 1 Stage 2 Stage 3/4
Ye
ar
s
Current smoker Former smoker Never smoker
Figure 6 Male life expectancy at age 65, stratifi ed by smoking status and severity of COPD (See Table 8).
International Journal of Chronic Obstructive Pulmonary Disease downloaded from https://www.dovepress.com/ by 118.70.13.36 on 22-Aug-2020
Shavelle et al
4 categories but who otherwise had no other co-morbidity. These RRs are higher than those we reported, but this is primarily due to the lower baseline mortality rate in their study. When we restricted attention to similar groups, we found similar results (not shown).
3. Celli and colleagues16 used a different measure of COPD,
the BODE index, which is a “multidimensional grading system that assessed the respiratory, perceptive, and systemic aspects of COPD that would better categorize
the illness and predict the outcome than does the FEV1
alone.” The index includes consideration of BMI, airfl ow
obstruction (based on predicted FEV1), dyspnea, and
exercise capacity to determine classifi cation of severity in COPD. The authors found a 32% increased risk of death for each point increase in the index.
4. Singer7 compared the results of Celli and colleagues16
to three older studies. Dividing the BODE index into quartiles, he found mortality ratios of 1.41, 2.76, 3.74, and
8.29. He concluded that while FEV1 might be the strongest
predictor of mortality, the other three factors (BMI, severity of dyspnea, and exercise capacity) were suffi ciently able to refi ne the levels of excess mortality. He also concluded that the BODE index may be a useful predictor in determining the statistical likelihood of survival in populations that have all four of the index measures. He noted, however, that in most cases the severity of dyspnea and exercise capacity are not available.
It is well known that COPD reduces life expectancy. As was documented here, the reduction is signifi cant for those with severe disease (GOLD State 3 or 4) and for smokers.
The new fi ndings reported here are the relative risks of Table 3, the mortality and excess death rates of Tables 4–7, and the life expectancies of Tables 8 and 9. The latter were used to document the years of life lost due to COPD and/or smoking. We also found (1) that the relative risk appears to decrease with age, and (2) the presence of super-additivity. We now comment on these latter two issues.
As is well known, once the schedule of age-specifi c mortality rates is known, a life table can be constructed and
the life expectancy determined.29,30 It might seem reasonable,
then, to use the model shown in Table 3 to calculate mortality rates for any combination of factors, especially for persons with COPD. To do so would overlook two issues, however.
First, the RRs of Table 3 apply to all combinations of the risk factors, and do not appear to vary signifi cantly by sex, race, education, and so on. But, as we have shown, they do vary by age. Thus, the relative risks reported in the Table are truly average RRs over the age-span. It might be
0 2 4 6 8 10 12 14 16 18 20
Normal Stage 0
symptoms only
Restrictive lung disease
Stage 1 Stage 2 Stage 3/4
Ye
ar
s
Current smoker Former smoker Never smoker
Figure 7 Female life expectancy at age 65, stratifi ed by smoking status and severity of COPD (See Table 9).
Table 8 Life expectancies for otherwise healthy 65-year-old Caucasian males, based on the rates in Tables 4 and 5. See also Figure 6
Group Smoking status
All Current Former Never
Normal 17.2 14.3 17.3 17.8
Stage 0 (Symptoms only) 16.9 12.5 16.9 17.7 Restrictive lung disease 16.3 12.7 16.0 17.5
Stage 1 17.4 14.0 17.4 18.0
Stage 2 16.0 12.1 15.9 17.1
Stage 3 or 4 12.5 8.5 11.7 16.5
International Journal of Chronic Obstructive Pulmonary Disease downloaded from https://www.dovepress.com/ by 118.70.13.36 on 22-Aug-2020
Life expectancy in COPD
reasonable, therefore, to assume that the relative risk applies
at the average follow-up age (68 + 12/2), with possibly an
additional offset to account for the variability.34,35
Second, one must specify the severity of COPD. As we have noted above, this cannot be assumed to remain static over the lifetime. A plausible simplifying assumption might be to assume that the EDR for the given severity applies at the initial age, and that this EDR increases in some fashion
with age.18,29
The results shown in Tables 3, 5, and 7 confi rm that the effect of COPD is super-additive with respect to smoking. That is, the extra risk due to COPD is higher in smokers than in nonsmokers. The effect is also super-additive with respect to age, as the EDR (but not RR) increases with age.
Life insurance underwriters implicitly assume super-additivity whenever they apply the same RR (or rating) to a smoker that they would to a nonsmoker. With a higher baseline mortality rate for smokers, the resulting EDR for the condition to be rated will be larger than the EDR for nonsmokers. If it is true that smoking increases the mortality effect of every risk factor (such as COPD), then this assumption appears reasonable.
It is important to note that a multiplicative model such as the Cox proportional hazards regression model is predicated upon super-additivity (actually, it assumes that the hazards are multiplicative, rather than additive). Further discussion is beyond the scope of the present article, but we hope to soon report on this issue in more detail.
As we have seen, COPD is associated with increased mortality and, thus, with reduced life expectancy. Those with stage 1 or 2 COPD lose at most a few years of life expectancy at age 65 compared with persons with no lung disease, in addition to any years lost due to smoking. But current smokers with stage 3 or 4 COPD lose about six years of life expectancy, in addition to the almost four years lost due to smoking.
Disclosure
The authors report no confl icts of interest in this work.
References
1. de Torres JP, Campo A, Casanova C, Aguirre-Jaime, Zulueta J. Gender and chronic obstructive pulmonary disease in high-risk smokers.
Respiration. 2006;73:306–310.
2. Ekberg-Aronsson M, Pehrsson K, Nilsson JA, Nilsson PM, Löfdahl CG. Mortality in GOLD stages of COPD and its dependence on symptoms of chronic bronchitis. Respir Res. 2005;6:98.
3. Lindberg A, Jonsson AC, Ronmark E, Lundgren R, Larsson LG, Lundback B. Ten-year cumulative incidence of COPD and risk factors for incident disease in a symptomatic cohort. Chest. 2005;127:1544–1552. 4. Mannino DM, Buist AS, Petty TL, Enright PL, Redd SC. Lung function and mortality in the United States: Data from the First National Health and Nutrition Examination Survey follow up study. Thorax. 2003;58:388–393.
5. Pelkonen M, Tugiainen H, Tervahauta M, et al. Pulmonary function, smoking cessation and 30 year mortality in middle aged Finnish men.
Thorax. 2000;33:746–750.
6. Pelkonen M, Notkola IL, Nissinen A, Tukianen H, Koskela H. Thirty-year cumulative incidence of chronic bronchitis and COPD in relation to 30-year pulmonary function and 40-year mortality in middle-aged rural men. Chest. 2006;130:1129–1137.
7. Singer RB. Mortality in a recent study of 625 patients with chronic obstructive pulmonary disease compared with results of 3 older studies.
J Insur Med. 2005;37:179–184.
8. Yohannes AM, Baldwin RC, Connolly M. Mortality predictors in disabling chronic obstructive pulmonary disease in old age. Age Ageing. 2002;31:137–140.
9. National Center for Health Statistics. Health, United States, 2007 With Chartbook on Trends in the Health of Americans. Hyattsville, MD: US Department of Health and Human Services; 2007.
10. Mannino DM, Doherty DE, Buist AS. Global Initiative on Obstructive Lung Disease (GOLD) classifi cation of lung disease and mortality: fi ndings from the Atherosclerosis Risk in Communities (ARIC) study.
Respir Med. 2006;100:115–122.
11. Mannino DM, Gagnon RC, Petty TL, Lydick E. Obstructive lung disease and low lung function in adults in the United States: Data from the National Health and Nutrition Examination Survey, 1988–1994. Arch Intern Med. 2000;160:1683–1689.
12. Global Strategy for the Diagnosis, Management and Prevention of COPD, Global Initiative for Chronic Obstructive Lung Disease (GOLD) 2007. [Cited on Jan 10, 2009.] Available from: http://www.goldcopd.org/. 13. Aldington S, Beasley R. Epidemiology and costs of chronic obstructive
pulmonary disease. Eur Respir J. 2006;27:188–207.
14. World Health Organization. Global Surveillance, Prevention and Control of Chronic Respiratory Diseases: A Comprehensive Approach.
Geneva: WHO Press; 2007.
15. Lee SJ, Lindquist K, Segal MR, Covinsky KE. Development and validation of a prognostic index for 4-year mortality in older adults.
JAMA. 2006;295:801–808.
16. Celli BR, Cote CG, Marin JM, et al. The body-mass index, airfl ow obstruction, dyspnea, and exercise capacity index in chronic obstructive pulmonary disease. N Engl J Med. 2004;350:1005–1012.
17. Strauss D, Shavelle R. Life expectancy of persons with chronic disabilities. J Insur Med. 1998;30:96–108.
18. Strauss DJ, Vachon PJ, Shavelle RM. Estimation of future mortality rates and life expectancy in chronic medical conditions. J Insur Med. 2005;37:20–34.
19. Centers for Disease Control and Prevention, National Center for Health Statistics. National Health and Nutrition Examination Survey Data. Hyattsville, MD: US Department of Health and Human Services, Centers for Disease Control and Prevention; 2001. [Cited on Jan 10, 2009.] Avail-able from: http://www.cdc.gov/nchs/about/major/nhanes/nh3data.htm. 20. National Center for Health Statistics. Plan and operation of the
Third National Health and Nutrition Examination Survey, 1988–94. Hyattsville, MD: US Department of Health and Human Services pub-lication PHS 94–1308;2004.
Table 9 Life expectancies for otherwise healthy 65-year-old Caucasian females, based on the rates in Tables 6 and 7. See also Figure 7
Group Smoking status
All Current Former Never
Normal 19.8 17.4 19.6 20.3
Stage 0 (Symptoms only) 19.1 15.6 18.8 20.1 Restrictive lung disease 18.4 15.9 17.7 20.0
Stage 1 19.9 17.2 19.8 20.5
Stage 2 18.1 15.2 17.6 19.3
Stage 3 or 4 14.5 11.3 13.3 18.4
International Journal of Chronic Obstructive Pulmonary Disease downloaded from https://www.dovepress.com/ by 118.70.13.36 on 22-Aug-2020
Shavelle et al
21. Standardization of spirometry – 1987 update: statement of the American Thoracic Society. Am Rev Respir Dis. 1987;136:1285–1298. 22. Hankinson JL, Odencrantz JR, Fedan KB. Spirometric reference values
from a sample of the general US population. Am J Respir Crit Care Med. 1999;159:179–187.
23. Crapo RO, Jensen RL, Lockey JE, Aldrich V, Elliott CG. Normal spirometric values in healthy Hispanic Americans. Chest. 1990; 98:1435–1439.
24. Neukirch F, Chansin R, Liard R, Levallois M, Leproux P. Spirometry and maximal expiratory fl ow-volume curve reference standards for Polynesian, European, and Chinese teenagers. Chest. 1988;94:792–798.
25. Lin FL, Kelso JM. Pulmonary function studies in healthy Filipino adults residing in the United States. J Allergy Clin Immunol. 1999;104:338–340. 26. SAS Institute Inc. SAS/STAT Software: Changes and enhancements
through release 6.11. Cary, NC: SAS Institute Inc; 1989.
27. Collett D. Modelling survival data in medical research. London: Chapman and Hall; 1994.
28. Arias E. United States Life Tables, 2003. National Vital Statistics Reports. Vol. 54, No. 14. Bethesda, MD: National Center for Health Statistics; 2005.
29. Anderson TW. Life Expectancy in Court: A textbook for doctors and lawyers. Vancouver BC: Teviot Press; 2002.
30. Schoen R. Modelling Multigroup Populations, chapter 1. New York: Plenum Press; 1988.
31. Society of Actuaries Mortality Task Force. 2001 Valuation basic mortality table (VBT). Schaumburg, IL: Society of Actuaries; 2001. 32. Doll R, Peto R, Boreham J, Sutherland I. Mortality in relation to
smoking: 50 years’ observations on male British doctors. Br Med J. 2004;328(7455):1519.
33. Hoogendoorn M, Rutten-van Mölken MP, Hoogenveen RT, et al. A dynamic population model of disease progression in COPD. Eur Respir J. 2005;26:223–233.
34. Shavelle RM, Strauss DJ, Paculdo DR. Computing exact excess death rates and mortality ratios from a mortality study with limited information on the age distribution. J Insur Med. 2006;38:105–110.
35. Singer RB. The application of life table methodology to risk appraisal. In: Brackenridge RDC, Elder JW, editors. Medical Selection of Life Risks. 4th Ed. New York: Stockton Press; 1998. Ch. 4, p. 52.
International Journal of Chronic Obstructive Pulmonary Disease downloaded from https://www.dovepress.com/ by 118.70.13.36 on 22-Aug-2020