How does the pitch and pattern of a signal affect auditory arousal thresholds?
D. Bruck1, M. Ball2, I. Thomas2 andV.Rouillard3
1
School of Psychology 2
Centre for Environmental Safety and Risk Engineering (CESARE)
3
School of Architectural, Civil and Mechanical Engineering Victoria University, Australia
Journal of Sleep Research, 2009
Running Head: Auditory arousal and signal characteristics
Corresponding Author: Professor Dorothy Bruck School of Psychology PO Box 14428
Melbourne 8001 Australia
Ph +61 3 9919 2336 Fax +61 3 9919 2218 [email protected]
SUMMARY
How arousal thresholds vary with different sounds is a critical issue for emergency awakenings, especially as sleepers are dying in fires despite having a working smoke alarm. Previous research shows that the current high pitched (3000+ Hz) smoke alarm signal is significantly less effective than an alternative signal, the 520 Hz square wave, in all populations tested. However, as the number of sounds tested has been small further research is needed. Here we measured auditory arousal thresholds (AATs) across signals with a range of characteristics to determine the most effective waking signal. Thirty nine young adults participated over three nights. In Part A, nine signals were presented in stage 4 sleep with ascending decibel levels. Signals were short beeps in the low to mid frequency range with different spectral complexities: square waves, pure tones, whoops and white noise. Part B manipulated temporal patterns, inserting silences of 0, 10 and 21 seconds after each 12 seconds of beeps. It was found that the low frequency (400 and 520 Hz) square waves yielded significantly lower AATs than the alternatives. A trend was found across the three temporal manipulations, with a 10 second intervening silence showing some advantage. These findings support earlier research indicating that the best sound for awakening from deep sleep is a low frequency square wave. It is argued that the signal with the lowest response threshold when awake may be the same as the most arousing signal when asleep, especially where the sleeper processes the signal as meaningful.
INTRODUCTION
Sleeping is a risk factor for death in a residential fire, even if a smoke alarm sounds. US fire fatality data shows that 37% of people who died in fires with working smoke alarms were sleeping when fatally injured (Ahrens, 2008). Thus the question arises, is there a better smoke alarm signal that has a lower (i.e. better) auditory arousal threshold (AAT) and thus will wake people more effectively?
The literature on arousal behaviour falls into two groups. The first group is dominated by researchers from the 1960s, 70s and 80s who were primarily interested in how arousal varied with characteristics such as sleep stages, time of night, age, sleep deprivation, individual differences, signal meaningfulness and chemical/alcohol intake (Bonnett, 1982; Bruck, 2001). The second group involves researchers interested in human behaviour in fire and emergency signals. Research in this area began in a small way in the 1980s and continues to the present with different auditory signals (Bruck and Ball, 2007; Bruck and Thomas, 2008a) and also tactile and visual stimuli (Bruck et al., 2007; Bruck and Thomas, 2007) being compared in terms of their ability to wake up people quickly, as would be relevant in a fire.
also drew on Gibsonian theory (Gibson, 1979) that suggested people perceive stimuli more readily if the stimulus itself conveys the meaning, without the requirement that the meaning has been learnt.
The Gibsonian principle had been applied in a study of alarms used in Intensive Care Units (Stanton and Edworthy, 1998), where alarms that used traditional auditory warnings were replaced with sounds considered to be “representative” of the particular medical information they were trying to convey. It was found that staff who had not been trained in the traditional warnings had significantly better recognition and subsequent performance with the new representative sounds than the old signals. This principle was applied to test both naturalistic fire sounds and a direct voice message in different sleeping populations and we found, surprisingly, that the fire sounds were quite ineffective as alarms and the voice was either equally (Ball and Bruck, 2004; Bruck et al., 2004), or less effective (Bruck et al., 2006), than a low pitch beeping sound.
Table 1 presents a summary of the research that has compared a variety of signals and shows the percentages that awoke at specified volumes. All studies, except the one involving children, controlled for sleep stage and used repeated measures designs.
Insert Table 1 about here……….
Table 1 shows that comparisons of the waking effectiveness of the different signals presented have yielded quite consistent findings across the groups tested (i.e. across different age groups, under conditions of alcohol impairment and with adults who are hard of hearing). In all studies where the 520 Hz square wave was tested a significant difference (p<.05) was found between the 3000+ Hz pure tone (the current smoke alarm signal) and the 520Hz square wave, with the latter being more effective at waking sleepers. A square wave consists of a fundamental (f) and an infinitude of odd only harmonics of overall decreasing volume level. Thus the frequency peaks are at f, 3f, 5f, 7f, 9f etc. An example of a square wave spectral analysis is shown in Figure 1.
Insert Figure 1 about here……..
of hearing adults 7:1 (at 75 dBA). While the earlier studies with children and self-reported deep sleeping adults found that the voice signal was about as effective as the 520 Hz square wave this finding was not upheld when older adults were tested, with the voice doing quite poorly in terms of AATs.
The research presented in Table 1 highlights pitch as a potentially important characteristic in the design of alarm signals that may be needed to alert people who are asleep. The results provide no support for the study (Hellier et al., 2002) which identified that signals of a higher pitch are more successful in gaining the attention of people who are awake. While not directly testing their additional finding that a beeping signal is more alerting with increasing speed of repetition (Hellier et al., 2002), no advantage for a rapidly repeating signal was found. Instead, Table 1 shows that a rapidly repeating 3000Hz signal (presented in the 2004 studies) was less effective than the other beeping sound (520 Hz square wave) which was presented in the slower Temporal Three (T-3) pattern.
One factor that is evident from Table 1 is that not many different signals have been compared and that more comparisons, with more manipulations of different pitches and patterns, is needed in order to more precisely find which signal may be the most effective in waking people. In the following investigations a number of signals were compared, with the rationale for the signals chosen being that they were sounds within low and mid range frequencies (within the human speech range) and of different levels of spectral complexity.
In two studies, one involving hard of hearing participants (Bruck & Thomas, 2007) and the other 0.05 Blood Alcohol Content (BAC) young adults (Bruck et al., 2007), analyses were made of the timing of awakenings in relation to signal onset and offset. Such analyses were possible as periods of 30 seconds of silence were inserted between each volume level of the signals tested. It was found that most participants who woke up did so within the first 10 seconds of signal onset, typically with 65-80% of awakenings falling in this time period. Thus it is feasible that AATs may be reduced by using a signal with a pattern that includes silences (of unknown duration).
silence (i.e. 10 or 21 seconds) into an ongoing signal. It was hypothesised that such silences would reduce AATs in comparison to a signal with no periods of silence.
In the following study the design involved all signals being delivered in only one stage of sleep as the focus was on signal differences. The deepest stage of sleep, stage 4, was chosen primarily as it was more likely to avoid a floor effect, whereby participants might wake easily to all signals. In addition stage 4 sleep presents the worst case scenario for waking up to an emergency signal, which is of relevance given that most fire fatalities occur early in the sleeping period (Thomas and Brennan, 2002), when people are in their deepest sleep.
METHOD
Participants:
Apparatus:
Hearing was screened with an Endomed SA 210/2 #13355. Polysomnographic sleep recordings were conducted with the Compumedics Siesta or Series E data acquisition system. A laptop computer was used to monitor sleep patterns and deliver the sound signals, via a speaker placed at head level one meter from the pillow. A behavioural response button (with a small LED light) was placed at the bedside. All sounds were delivered using a computer program that presented each sound for a set period at the nominated starting intensity and increased the volume by set increments. The program automatically stored the behavioural response times and the signal levels presented. A hand held Lutron SI-4001 sound meter was used to calibrate sound levels. Each sound was originally created on a computer and then for each sound a series of sound files at different volumes were created in a TV studio and played via the laptop. Details on sound measurement, calibration and delivery are as used in previous research and detailed elsewhere (Bruck et al., 2006). All sounds were played in the Temporal-Three (T-3) pattern which is defined in ISO 8201-1987 as the emergency evacuation temporal pattern. One cycle of the T-3 consists of three ON signals of 0.5 s each, with a 0.5 s OFF period of silence between each signal. Each series of three signals is separated by a 1.5 s silence. The sounds used in Part A were as shown in Table 2.
The sound used in Part B was chosen from the first eight signals presented in Part A (as listed in Table 2), with the signal which yielded the lowest AAT being used. The temporal pattern manipulations of Part B are shown in Table 3.
Insert Table 3 about here…..
Procedure:
Each participant had their sleep monitored on three separate nights, typically in their own homes although about a quarter of the participants took up the option of being tested in the campus sleep laboratory. Four different signals were presented each night. Tests were at least one week apart to allow for recovery from any sleep deprivation. The participant was required to sleep on their own with the bedroom door closed.
After preparation for sleep monitoring the participant was instructed that when they awoke to a signal they should press the button by their bedside three times. They knew they would be awoken four times per night but had not heard the sounds beforehand. After each signal they should try to return to sleep immediately. The ST was in the hallway outside the bedroom monitoring their sleep patterns on a laptop computer. When the participant entered stage 4 sleep the ST waited 90 seconds before delivering the sound. If the participant moved to a lighter sleep (e.g. stage 3 or 2) then the ST waited till they again reached stage 4 sleep and maintained it for 90 seconds. The automatic sound delivery program was then commenced, set to play the required auditory signal. The first four signals listed in Table 2 were presented on night one and the next four signals in Table 2 were presented on night two. On the third night the final signal listed in Table 2 plus the signals listed in Table 3 were presented. The order of the presentation of the signals within each night was counterbalanced across participants. Counterbalancing of all signals across all nights was not possible as the results from the first block of four informed the characteristics of the next five signals tested. Arousal thresholds are unaffected by a first night effect (Sforza et al., 2008).
continued for a total of three and a half minutes, or until awakening occurred, whichever occurred first.
This research was approved by the Victoria University Human Experimentation Ethics Committee.
Data analyses:
responded behaviourally (pressing a bedside button three times) and this was the signal for the sleep technician to terminate signal delivery. This usually occurred within several seconds of the appearance of the wake pattern.
Where a participant did not wake up the AAT level was assigned as 100 dBA to allow for statistical analyses to include that result. Statistics were conducted on a between groups basis (rather than repeated measures) to ensure the maximum number of valid data points could be included in the analyses. Valid AATs were not available for all signals from all participants, typically due to factors such as a participant not returning to stage 4 sleep or technical difficulties. Specifically, the number of participants from whom valid data was obtained for the final signal listed in Table 2 (and 4) was reduced by technical difficulties arising from this signal being presented on the same night as Part B signals, which had a different ascending decibel increment. The SPPS 14 package was used and alpha was set at 0.05.
RESULTS
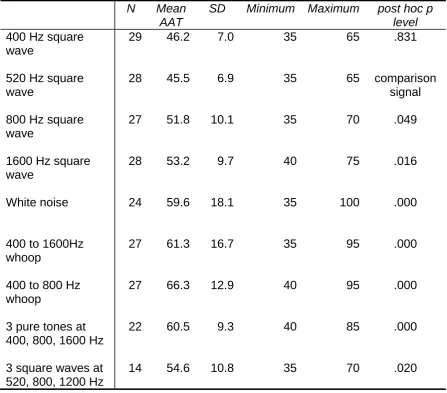
Differences between selected signals were further explored using post hoc tests (Least Significant Difference Test). As it was hypothesised that the 520 Hz square wave signal would have the lowest mean AAT, differences
between this signal and all others were analysed and the significance levels obtained are shown in the final column of Table 4. These indicate that the 520 Hz signal AAT was significantly different to all other signals (p<.05) except the 400 Hz square wave signal. Similar statistical outcomes would have been obtained if the 400 Hz square wave had been used as the comparison signal. The large standards deviations and ranges shown in Table 4 indicate the wide individual variability in arousal thresholds recorded in the study.
Insert Table 4 about here….
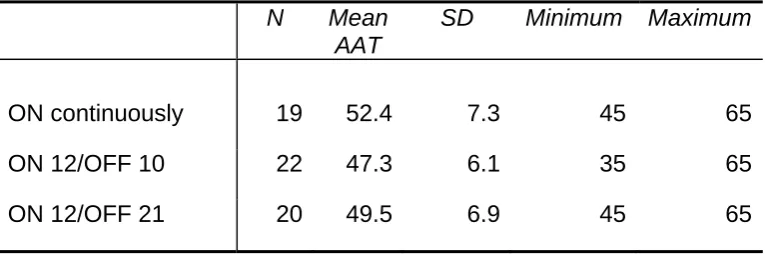
Part B considered whether the ON/OFF pattern of the 520 Hz square wave T-3 signal affected waking effectiveness and compared three signals with different patterns (see Table 3 for details). Table 5 presents the descriptive data. A one way analysis of variance found no significant difference in AATs between the three signals, F(2, 58) = 2.9, p = .063. However, there was a trend for the two signals with intervening silences (of 10 seconds or 21 seconds) to have slightly lower AATs than the continuous signal.
Insert Table 5 about here…..
The hypothesis for Part A, that the 520 Hz square wave signal would lead to the lowest AAT, was supported. This signal awoke participants at a significantly lower volume than the white noise, whoops, pure tone combinations, square wave combination signals and square wave signals with fundamentals at 800 Hz or higher. The 520 Hz and 400 Hz square waves were not significantly different from each other, with the mean AATs showing less than 1 decibel difference. This result is consistent with the previous research in the area, as summarised in Table 1, in several ways. It shows that the 520 Hz square wave has a very similar AAT to the 400 Hz square wave, although in all three studies where comparisons have now been made the mean values show the 520 Hz wave does marginally better. Further, the present result is also consistent with the previous data showing that pure tones, even at equivalent frequencies, are significantly less effective than complex tones. Both the white noise and whoops performed poorly.
frequencies (but without clear peaks that are more than critical band width apart), are not as effective for adult populations (Bruck and Thomas, 2008b).
Various researchers have considered the nature of the most effective alarms and/or ringer tones for alerting people who are awake. Patterson (1990) notes,
Contrary to the general conception of pitch perception, we do not hear a separate pitch for each peak in the spectrum of a sound. Rather, the auditory system takes the information from temporally related components and maps them back onto one perception, namely a pitch corresponding to the fundamental of the harmonic series implied by the related components. (pg. 488)
sounds with multiple frequency peaks that activate different parts of the basilar membrane have lower audibility thresholds.
Moreover, the efficacy of the square wave with a fundamental of around 520 Hz is consistent with a body of data suggesting that frequencies in this vicinity may have optimal audibility when awake. The hearing thresholds reported by Cruickshanks et al. (1998) in their population-based study of 3,753 people aged 48-92 years found that the average thresholds for the 500 Hz sound were lower than for 250 Hz, 1000 Hz, 2000 Hz, 3000 Hz and higher frequencies. Similarly, audiological screening tests of participants (when awake) with mild to moderate hearing loss involving a range of pure signals found the lowest thresholds for sounds with dominant frequencies around 500 Hz. Further awake testing of these participants using the first eight alternatives listed in Table 2 found the 520 Hz square wave had the lowest mean audible response threshold (Bruck and Thomas, 2007).
and environmental factors and motivation (Bruck and Ball, 2007). Various early studies support the possibility of introducing a motivational bias (or priming) while people are asleep (see review by Bonnet, 1982), with perhaps the most dramatic findings being that the percentage awoken from the deepest stage of sleep increased from 8% to 100% when subjects were motivated to respond to a certain signal and that discrimination during sleep can occur between a telephone ring and a door bell (Zung and Wilson, 1961, Wilson and Zung, 1966).
Consistent with this, research at a neurophysiological level suggests that auditory messages sent by cells in the thalamus to cortical neurons, while being reduced during sleep in terms of their firing rate and frequency range, nevertheless retain sufficient informative content to allow content analysis of some complexity (Edeline et al., 2000). During slow wave sleep sensory blocking reaches a maximum, with thalamocortical cells being deeply hyperpolarized, and consequently sensory information has to be more intense or more relevant (perceptually) to overcome the sensory ‘gate’ and be evaluated by the sleeping cortex (Coenen, 1995; Coenen and Drinkenburg, 2002). Waking causes changes in the discharge threshold of thalamocortical neurons and allows a more ready transfer of information from the peripheral sense organs to both the sensory and higher order processing areas of the cortex.
have been primed to wake up to signals while they are asleep. There is no expected variability in perceptual processing because the subjects have all been instructed that they must give a certain behavioural response when they hear a certain signal (i.e. primed to perceive all of the presented signals as significant). Thus the research has effectively been testing which signal is most likely to initiate successful sensory processing and the variability is a function of differences in passing the sensory ’gate’, with intensity being the parameter of most relevance. It is argued that the results indicate that the signal properties that affect human audible sensory processing are identical under awake and asleep conditions, but differ in terms of threshold.
detection theory would argue that these three points would increase the sensitivity to detecting the signal and the level of a person’s bias (or criteria) in terms of the consequences of a false alarm (waking when there was no need) or a missed response (not waking in an emergency).
In Part B of the study it was hypothesised that AATs would be improved by inserting periods of silence (10 or 21 seconds) into an ongoing T-3 signal. This hypothesis was not supported by any significant differences being found, although there was a trend (p=.06) for the inserted silences (especially 10 seconds) to improve the waking effectiveness of the signal. Power analyses suggest that a sample of 20 is only sufficient to obtain a significant difference if a large effect size (f >.4) exists. Thus it may be a Type 2 error to conclude from this data that intervening silences have no effect on AAT, however, it seems that the effect of intervening silences, if any, is not large. Further research with a larger sample size is needed to make a firmer conclusion.
mean AAT for ongoing 520 Hz signals in Part B (52.4 dBA) compared to Part A (45.5 dBA). This difference is most likely to be a function of the different methodologies employed - 10 dBA increments for level of each signal in Part B compared to 5 dBA increments in Part A - with the different increment levels affecting the threshold averages yielded.
Conclusions:
The low frequency (400 and 520 Hz) square waves yielded significantly lower auditory arousal thresholds (AATs) than white noise, pure tones, whoops and higher frequency square waves. There was no significant advantage in presenting ongoing beeps with 10 or 21 seconds of intervening silence, although a trend for lower AATs with 10 seconds of intervening silence every 12 seconds was found. These findings support our earlier research showing that the best sound for awakening from deep sleep is a low frequency (e.g. 520 Hz) square wave. It is argued that the signal properties that affect human audible sensory processing are identical under awake and asleep conditions, but differ in terms of threshold. Further, waking will be facilitated by perceptual processing that a signal is meaningful and should be responded to. The results have implications for smoke alarm signals and other alarms sounding during the sleep period (e.g. to treat bedwetting).
This research was financially supported by the Australian Research Council, Umow Lai, Australian Building Control Board and the Building Commission (Victoria). Special thanks to Michelle Barnett and Walter Pfister.
REFERENCES
Ahrens, M. Home Smoke Alarms: The Data as Context for Decision Making, Fire Technology, 2008, (on-line). Retrieved 22nd May 2008 from http://www.springerlink.com/content/j2815t8732813m3k/
Ball, M., and Bruck, D. The effect of alcohol upon response to fire alarm signals in sleeping young adults. In: J. Shields (Ed.), Proceedings of the Third Human Behaviour in Fire Conference. Interscience Communications, London, 2004: 291-302.
Berkowitz, J.P., and Casali, S.P. Influence of age on the ability to hear telephone ringers of different spectral content. In: Proceedings of the Human Factors and Ergonomics 34th Annual Meeting, Santa Monica, CA, Human Factors and Ergonomics Society, 1990: 132-136.
Bonnet, M. Performance during sleep. In: W. B. Webb (Ed.), Biological Rhythms, Sleep and Performance. Wiley, New York, 1982: 205-237. Bruck, D. The who, what, where and why of waking to alarms: a review. Fire
Bruck, D. & Ball, M. Optimising emergency awakening to audible smoke alarms: an update Human Factors, 2007, 49: 585-601.
Bruck, D., Reid, S., Kouzma, J., and Ball, M. The effectiveness of different alarms in waking sleeping children. In: J. Shields (Ed.), Proceedings of the Third Human Behaviour in Fire Conference. Interscience Communications, London, 2004: 279-290.
Bruck, D., Thomas, I. and Kritikos A. Reducing fire deaths in older adults: Investigation of auditory arousal with different alarm signals in sleeping older adults, Report for the Fire Protection Research Foundation, 2006. Retrieved 10th October 2007
from http://www.nfpa.org/assets/files//PDF/Research/Investigation_of_ Auditory_Arousal.pdf
http://www.nfpa.org/assets/files//PDF/Research/hardofhearing&al Bruck, D. and Thomas, I. Waking effectiveness of alarms (auditory, visual and
tactile) for adults who are hard of hearing. Report for the Fire Protection Research Foundation, 2007. Retrieved 10th October 2007 from
arms.pdf
Bruck, D. and Thomas, I. Towards a better smoke alarm signal – an evidence
Bruck, ss of different
Bruck, king effectiveness of alarms (auditory, visual and tactile) for the alcohol impaired. Report for the Fire based approach. In: Proceedings of the International Association of Fire Safety Science, Karlsruhe, Sept, 2008a (In press).
D. and Thomas, I. Comparison of the effectivene
emergency notification signals in sleeping older adults. Fire Technology, 2008b, 44: 15-38.
Protection Research Foundation, 2007. Retrieved 10th October 2007 from http://www.nfpa.org/assets/files//PDF/Research/alcohol&alarmsre port.pdf
and evoked potentials of sleeping and waking: Implications for info
Coenen, A. M. L. Neuronal activities underlying the electroencephalogram
rmation processing. Neuroscience & Biobehavioral Reviews, 1995:
Coene
-175. 19(3), 447-463.
n, A. M. L. and Drinkenburg W. H. I. M. Animal models for information processing during sleep International Journal of Psychophysiology, 2002: 46(3), 163
Colman, A. M. "sensation n." A Dictionary of Psychology. Oxford University Press, 2006. Oxford Reference Online, Victoria University. Retrieved on 10 July 2008 from
http://www.oxfordreference.com.library.vu.edu.au:80/views/ENTRY.htm
l?subview=Main&entry=t87.e7476
shanks, K.J., Wiley, T.L
Cruick ., Tweed, T.S., Klein, B.E.K., Klein, R.,
Mares-he epidemiology of Mares-hearing loss
Du Bo
ing ergency Notification and
ity, Perlman, J.A., and Nondahl, D.M. Prevalence of hearing loss in older adults in Beaver Dam, Wisconsin: t
study. Am J Epidemiol., 1998, 148: 878-886.
is, J., Ashley, E., Klassen, M., and Roby, R. Waking effectiveness of audible, visual and vibratory emergency alarms on people of all hear abilities. In: Proceedings of the Accessible Em
Communication: State of the Science Conference, Gallaudet Univers Washington D.C. Nov 2-3, 2005. Retrieved on 27th August, 2006
Edelin
.
Gibson Mifflin
e
16.
ociety, 1970.
Oswal inative responses to
Patters
Rechts terminology,
N
Stant
e, J-M., Manunta, Y. and Hennevin, E. Auditory Thalamus Neurons During Sleep: Changes in Frequency Selectivity, Threshold, and Receptive Field Size. J Neurophysiology 2000: 84, 934-952.
Firth, H. Habituation during sleep. Psychophysiology, 1973, 10: pp. 43 – 51 , J.J. The ecological approach to visual perception. Houghton Company, Boston, MA, 1979.
Hellier, E., Edworthy, J., Weedon, B., Walters, K. and Adams, A. Th perceived urgency of speech warnings’ semantics versus acoustics. Human Factors, 2002, 44: 1 –
Hunt, R.M. Determination of an effective tone ringer signal. Preprint number 722 (M-5) from the 38th Convention of the Audio Engineering Society. New York, NY: Audio Engineering S
ISO 8201. Acoustics - audible emergency evacuation signal. Geneva, Switzerland: International Organisation for Standardisation (ISO), 1987. d, I., Taylor, A. M., and Treisman, M. Discrim
stimulation during human sleep. Brain, 1960, 83: 440-453.
on, R.D. Auditory warning sounds in the work environment. Philosophical Transactions of the Royal Society B, 1990, 327, 485-492.
chaffen, A. and Kales, A. A manual of standardized
techniques and scoring system for sleep stages of human subjects., U. S. ational Institute of Neurological Diseases and Blindness Neurological Information Network, Bethesda. 1968.
linical Neurophysiology.
Thoma
ociation for Fire Safety Science – Proceedings of
Weir,
, 21: 219-225.
s 957, 29, 548-557.
Sforza, E., Chapotot, F., Pigeau, R., Buguet, A. Time of night and first night effects on arousal response in healthy adults. C
2008, 119(7):1590-9.
s, I.R. and Brennan, P. Injuries and fatalities in apartment building fires, International Ass
the Seventh International Symposium, 2002, 1085-1096.
C. Auditory frequency sensitivity in the neonate: a signal detection analysis. Journal of Experimental Child Psychology, 1976
Wilson, W.P. and Zung, W.K. Attention, discrimination, and arousal during sleep. Archives of General Psychiatry, 1966, 15: 523-528.
Zung, W.K. and Wilson, W.P. Response to auditory stimulation during sleep. Archives of General Psychiatry, 1961, 40-44.
Table 1; Percentage sleeping through different sounds, as found in auditory arousal research comparing possible smoke alarm signals. (Unless otherwise specified all non-voice signals were in the Temporal 3 pattern.)
Participants decibel level (duration in sec) N Sleep stage 3100+ Hz pure tone
Voice 450 or
500 Hz pure tone 400 Hz square wave 520 Hz square wave Reference young adults (18-26 yrs) 75 (30 s)
24 4 31% 0% Bruck and
Thomas 2008a
older adults (65-83 yrs)
75 (30 s)
42 3 18% 14% 15.5% 4.5% Bruck &
Thomas 2008b
young adults, 0.05 Blood Alcohol Content
75 (30 s)
32 4 38.5% 14% 7% 0% Bruck et al.
2007
hard of hearing adults 75 (30 s)
38 3/4 56% 13.5% 8% Bruck &
Thomas 2007
hard of hearing adults <75 (120 s)
45 2, REM &
3/4
43% 8% Du Bois et al.
2005
adults <75
(120 s)
34 2, REM &
3/4
0% 0% Du Bois et al.
2005
deep sleeping young adults (18-26 yrs)
75 (30 s)
14 4 43%a 14% 7% Ball & Bruck
2004
young adults, 0.08 Blood Alcohol Content
75 (30 s)
14 4 64%a 43% 50% Ball & Bruck
2004
children (6-10 yrs)
89 (180s)
19-28 not controlled
43%a 3.5% 3.5% Bruck et al.
2004
a
Table 2: Details of the signals presented in Part A. Signal name Signal spectral details
400 Hz square wave Each 0.5 sec sound had a fundamental at 400 Hz, with peaks of decreasing intensity at 1200 Hz, 2000 Hz, 2800 Hz, 3600 Hz etc
520 Hz square wave Each 0.5 sec sound had a fundamental at 520 Hz, with peaks of decreasing intensity at 1560 Hz, 2600 Hz, 3640 Hz, 4680 Hz etc (see Figure 1) 800 Hz square wave Each 0.5 sec sound had a fundamental at 800 Hz,
with peaks of decreasing intensity at 2400 Hz, 4000 Hz, 5600 Hz, 7200 Hz etc
1600 Hz square wave Each 0.5 sec sound had a fundamental at 1600 Hz, with peaks of decreasing intensity at 4800 Hz, 8000 Hz, 11200 Hz etc
White noise Each 0.5 sec sound had a flat power spectral density across all audible frequencies
400 to 1600 whoop Each 0.5 sec sound had a single, flat frequency “peak” that continued across the frequency band between 400 and 1600 Hz
400 to 800 whoop Each 0.5 sec sound had a single, flat frequency “peak” that continued across the frequency band between 400 and 800 Hz
3 pure tones at 400, 800 and 1600 Hz
Each 0.5 sec sound in each pattern of three (T-3) consisted of a different pure tone, presented consecutively from low to high frequencies.
3 square waves at 520, 800 and 1200 Hz
Table 3: Signals presented in Part B. Signal name Signal details
ON continuously 520 Hz square wave T-3 ON continuously for 66 seconds at each volume
ON 12/OFF 10 520 Hz square wave T-3 ON for 12 seconds, then OFF for 10 seconds, with the pattern repeated for 66 seconds at each volume
Table 4: Statistics of auditory arousal thresholds (AATs, in dBA) for the signals presented in Part A. Final column shows post hoc test results comparing the 520 Hz square wave AAT with AATs of other signals.
N Mean
AAT
SD Minimum Maximum post hoc p level 400 Hz square
wave
29 46.2 7.0 35 65 .831
520 Hz square wave
28 45.5 6.9 35 65 comparison
signal 800 Hz square
wave
27 51.8 10.1 35 70 .049
1600 Hz square wave
28 53.2 9.7 40 75 .016
White noise 24 59.6 18.1 35 100 .000
400 to 1600Hz whoop
27 61.3 16.7 35 95 .000
400 to 800 Hz whoop
27 66.3 12.9 40 95 .000
3 pure tones at 400, 800, 1600 Hz
22 60.5 9.3 40 85 .000
3 square waves at 520, 800, 1200 Hz
Table 5: Descriptive statistics of auditory arousal thresholds (AATs, in dBA) for the signals presented in Part B.
N Mean
AAT
SD Minimum Maximum
ON continuously 19 52.4 7.3 45 65
ON 12/OFF 10 22 47.3 6.1 35 65
DM 1685
0 10 20 30 40 50 60 70 80 90
0 1000 2000 3000 4000 5000 6000 7000 8000 9000 10000
Frequency (Hz)
S
o
und L
e
v
e
l (dBA)