1 UiT The Arctic University of Norway; pal.ratnabali@gmail.com, skarifahmed@gmail.com,
dilipprasad@gmail.com
2 National Institute of Technology Durgapur; samarjit.kar@maths.nitdgp.ac.in
* Correspondence: dilipprasad@gmail.com
Abstract: The recent worldwide outbreak of the novel corona-virus (COVID-19) opened up new challenges to the research community. Artificial intelligence (AI) driven methods can be useful to predict the parameters, risks, and effects of such an epidemic. Such predictions can be helpful to control and prevent the spread of such diseases. The main challenges of applying AI is the small volume of data and the uncertain nature. Here, we propose a shallow Long short-term memory (LSTM) based neural network to predict the risk category of a country. We have used a Bayesian optimization framework to optimized and automatically design country-specific networks. We have combined the trend data and weather data together for the prediction. The results show that the proposed pipeline outperforms against state-of-the-art methods for 170 countries data and can be a useful tool for such risk categorization. The tool can be used to predict long-duration outbreak of such an epidemic such that we can take preventive steps earlier.
Keywords:COVID-19; Trend Prediction; Optimized Neural Network
1. Introduction
The novel corona-virus (COVID-19) is one of the most contagious diseases to have hit our blue planet in the past decades [1]. In little over four months since the virus was first spotted in mainland China, it has spread to more than 170 countries, infected more than 549,136 people, and taken more than 24,863 lives as on last week of march, 2020. As governments and health organizations scramble to contain the spread of corona-virus, they need all the help they can get, including from artificial intelligence (AI). Though current AI technologies are far from replicating human intelligence, they are proving to be very helpful in tracking the outbreak, diagnosing patients, disinfecting areas, and speeding up the process of finding a cure for COVID-19. It is noted that the country like Italy, Germany, Spain, etc. suffers due to underestimating the speed of the outbreak and unable to predict the effects on the country. Last few years, AI methods successfully applied in various predictive tasks such as stock value [2], sales [3], weather [4], etc. and also predicting epidemic spread [5].
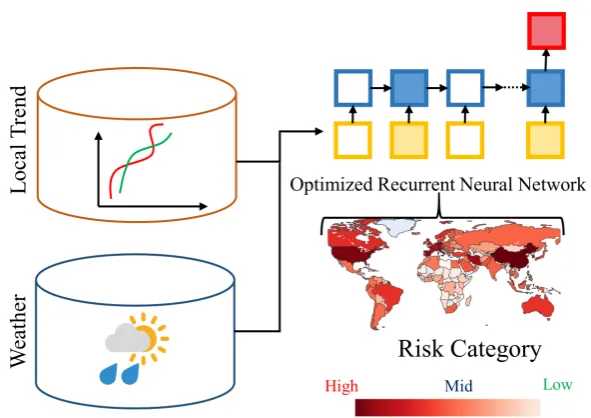
Figure 1. A AI method for predicting country wise risk category combining COVID-19 trend and weather.
A AI method for predicting country wise risk category combining COVID-19 trend and weather. In this paper, we have proposed an AI-guided method to predict long-term country-specific risk. The primary challenges of such methods are:
Small dataset:Majority of the machine learning (ML) algorithms demand a large volume of data for training. It is noted that the COVID-19 dataset is less than 90 days long and it is difficult to design accurate AI methods to train such small volume data.
Uncertain data:The virus is very new to the researchers and majority of the parameters that can be used to predict the outbreak and risk factors are unknown. It is observed that the trend is also different in different countries. Hence, a generic AI tool may not be suitable for tracking all trends. It is also noted state-of-the-art deep neural networks fail because of the uncertainty in the data. This observation encourages us to design shallow and country data specific optimized neural networks.
We have proposed to use local trend data and weather data with a shallow Long Short-Term Memory (LSTM) based neural network combined with a feature selection method and fuzzy rules to predict long term risk of a country (Fig.1). The country-specific neural network is optimized using Bayesian optimization.
Next, we discuss the related works and gaps bridge by the proposed method.
2. Related Works
We note three communities of the related work. (A) AI in epidemic researches (B) Researches on COVID-19, and (C) Multivariate regression in AI. These are discussed below:
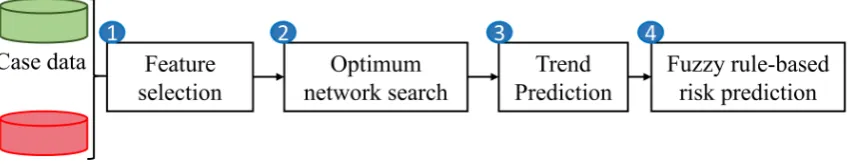
Figure 2.Modules of the proposed framework.
decision-making application using statistical and machine learning methods to predict future growth based on past incident data.
(B) Researches on COVID-19:The recent COVID-19 outbreak attracts many researchers to help and find a way to recover. Rao et al. [18] proposed methods to detect COVID-19 patients using a mobile phone. Yan et al. [19] built a predictive model to identify early detection of high-risk patients before they transmitted from mild to critically ill. In recent days, numerous research articles published on epidemic prediction of the corona-virus pandemic [20–29]. Researchers focused to designed new paradigm based on AI-driven tools [30,31] combining ML algorithms and different modality of data. An improved adaptive neuro-fuzzy inference system (ANFIS) methodology is proposed in [32]. The algorithm is based on an enhanced flower pollination algorithm (FPA) by using the Salp swarm algorithm (SSA) to estimate confirmed cases in the next ten days. Li et al. [33] developed a regression model to calculate the exponential growth of COVID-19 infection based on the total number of daily diagnoses cases outside China. Analysts obtained projections from 10 familiar machine learning and statistical ecological niche models in [34] against the examining of large-scale climatology variation. (C) Multivariate Regression in AI:The key point in time series study [35] is forecasting. Time Series analysis for business prediction helps to forecast the probable future values of a practical field in the industry [36–39]. The method is also applicable in health to predict the health condition of a person on the last diagnosis data[40]. The method uses a feature attention mechanisms to predict future health risks. Other health areas such as antibiotic resistance outbreaks [41] and influenza outbreaks [42,43] are also used multivariate regression models. Different algorithms such as deep neural network [44,45], long short-term memory model (LSTM) [46], and gated recurrent Unit(GRU)-based model [47] are successfully applied in various forecasting. The methods rely on specific less estimation error and running time on artificial network suitable data sets with characteristics of multivariate, sequential and time-series.
Gap bridge by our method:The main challenge of predicting the long term risk of a country is solved by combining different weather data with the daily case data, choosing a feature selector, designing dynamic shallow recurrent neural network (RNN) which is optimized for an individual country, and combining fuzzy rule. It is noted in [31] that custom network for each sample can be a suitable solution for the data which inspired us to design an optimized network for each country. The problem of insufficient data is solved by choosing an optimized shallow network and the problem of predicting local trends is solved by optimizing the neural networks for individual countries. This introduces a new way to predict an epidemic outbreak and correlate with the risk of a country.
3. Proposed Model
3.1. Background
In our proposed method, we propose to use a shallow long short-term memory (LSTM) with a few layers. The LSTM is a variation of RNN like GRU. Fundamentally, an RNN handles the sequence by having a recurrent hidden state whose activation at each time is dependent on that of the previous time. Formally, a set of inputx= (x1,x2, ,xT), the RNN estimates its hidden statehtby
ht=
(
o t=0
ν(ht−1,xt) otherwise
(1)
whereνis the nonlinear function. The LSTM have an outputy= (y1,y2, ...,yT). The hidden states are updated by
ht=g(Wxt+Uht−1) (2)
wheregis a bounded function. A general RNN estimates the conditional probability of each input state as
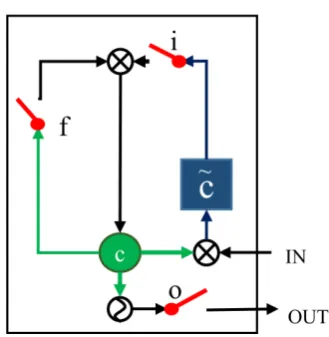
p(xt|x1, ...,xt−1) =g(ht) (3) LSTM is adaptive and estimates dependencies of different time scales. The commonly used RNN variations such as LSTM uses gate and memory cells for sequence prediction. Initially, LSTM initiates with a forgot gate layer(ft)that uses a sigmoid function combined with previous hidden layer(ht−1)
and current input(xt)as:
ft=σ(Wf ·[ht−1,xt] +bf) (4) whereWis weight andbf is the bias. A tanh layer creates candidate valueCerepresents a tanh cell as:
e
C=tanh(WC·[ht−1,xt] +bC) (5) This information is passed to the next cellCtas:
Ct= ft∗Ct−1+it∗Cet (6)
whereitalso a sigmoid function. Finally, this information passed to the next hidden layers as:
ht=ot∗tanh(Ct) (7)
whereotis also a sigmoid function known as output gate. The graphical representation of LSTM is presented in Figure.3. We have used a similar structure of LSTM modules as the building blocks of the proposed system.
3.2. Feature selection
We hypothesize that all the features are not linked with the prediction variable. The data contains 3 main concerns for the risk categorization of a country. Number of cases (κ), number of deaths (δ), and number of recovered (ρ). The active case (α) is calculated byκ−(ρ+δ). Features are selected by backward elimination method. We calculate p-value of all features withαusing ordinary least squares (OLS) regression. We employ a threshold (0.05) for choosing features. Algorithm1demonstrate the method.
3.3. Network search
Figure 3.(a) LSTM,iis input gates,fis forgot gate andois output gate.cis cell state andCeupdate cell.
Algorithm 1:Feature Selection Algorithms Result:Feature Selection (f=set of features) Setpthreshold=0.05;
do
Train OLS with f;
pmax=∀f, MAX(p-value); ifpmax >pthresholdthen
Remove f(pmax); whilepmax> pthreshold; return f
E(φ,Dtrain,Dtest)is the error onDtestof the parameterφ. The hyperparameter is optimized for a given dataset (D) by minimizing:
fD(φ) =E(φ,Dtrain,Dtest) (8) We have considered root-mean-square error (RMSE) error on validation set to chose best architecture. Hence, the problem can be defined as:
φ∗ =arg min φ∈θ
(fD(φ)) (9)
In general, the problem of hyper-parameter search can be very expensive as we need to train and evaluate the dataset for each combination of parameters. Searching algorithms such as random search and grid search are better than manual setup but computationally expensive when we have a large volume dataset and a wide hyper-parameter search space. The methods do not consider the previous outcome to choose the next set of parameters hence the methods to spend most of the time evaluating bad parameters. In our case, the RMSE of a set of parameter (fD(φ
Parameter Description Distribution/Selection Values Learning rate Minimum learning rate Log uniform 1e-1 to 1e-7 Hidden layers Number of layers in the network Discrete numeric 1 to 20
Hidden state Number of memory cell in each layer Discrete numeric 1 to 200 Activation Activation in each layer Category {ReLu,sigmoid,tanh}
Batch size Batch size during training Discrete numeric 1 to 10 Dropout Dropout size before dense layer Log uniform 0 to 0.5
Table 1.Parameters used in optimum network search for COVID-19
Figure 4.Fuzzy membership function for death rate, case rate, and recovery rate.
3.4. Fuzzy rule-based risk categorization
The prediction ofδ,κ, andρis used to predict the risk of the country. We define 3 categories of risks(1)high risk (HR),(2)medium risk (MR),(3)recovering (RE). First, we calculate the death rate, new case rate, and recovery rate as:
death rate= κ
δ (10)
case rate= total population
α (11)
recovery rate= α
ρ (12)
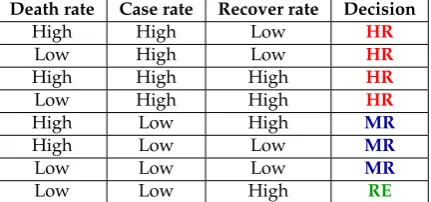
Next, 3 Gaussian fuzzy membership function is defined to represent the risk measurement of these parameters as shown in Figure4. The final class of the risk is estimated my imposing rules defined in Table2
Death rate Case rate Recover rate Decision
High High Low HR
Low High Low HR
High High High HR
Low High High HR
High Low High MR
High Low Low MR
Low Low Low MR
Low Low High RE
Table 2.Fuzzy rule to estimate the risk factor of a country
4. Results and Discussion
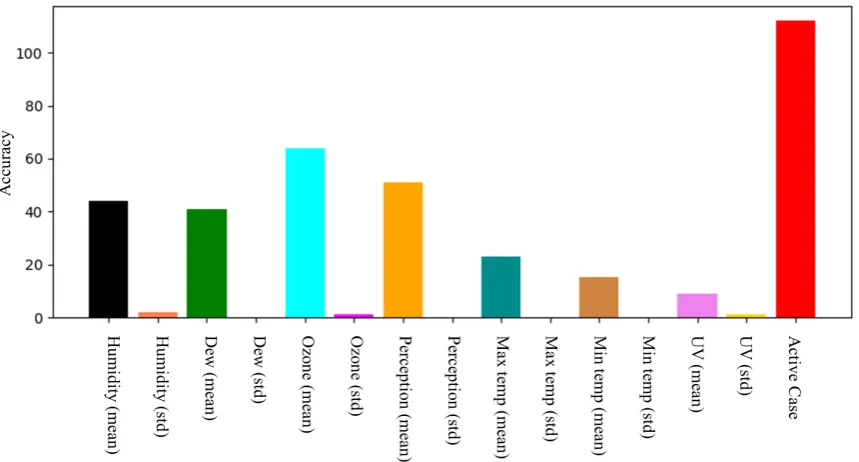
Figure 5.Number of country select a particular feature.
4.1. Dataset
We have used COVID-19 dataset1consists of date, country, confirmed cases, recovered cases, total death. We have combined the data with weather data2consists of humidity, dew, ozone, perception, max temperature, minimum temperature, and UV. We have considered mean and standard deviation over different cities of a country. The data starts from 22-01-2020 to 12-04-2020.
4.2. Feature selection
Here we discuss the results of the feature selection method. It is observed that the active case is chosen by all countries and it is obvious. The second larger chosen feature is Ozone which is a new finding. It is noted that humidity, dew, and temperature are also playing a role in COVID-19 outbreak trends. Figure5shows features selected by the number of countries.
4.3. Network optimization
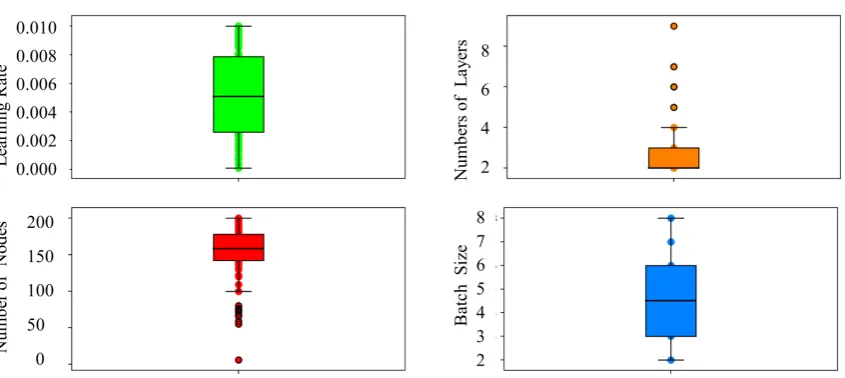
We have used 300 iterations with 0.1 added Gaussian noise to the data. The last 10 days data is used for validation and rest is used for training. Each network generated by Bayesian optimization is trained using a maximum of 5000 iterations. We have used 100 epoch delay on validation loss for early stopping. We have used 300 iterations during optimization. During optimization, RMSE is minimized over the validation set. Each country data is individually used to generate the country-specific optimized network. It is observed that majority of the network optimized with a few layers and hidden units with ReLu activation. The distribution of the parameters over all the generated networks are shown in Figure6. The dropout is chosen zero most of the time.
Case study (China):Here we discuss the optimization output of network using China dataset. The optimization ends with 2 number of hidden layers with 178 hidden nodes in each layer. The network optimized in 0.008 learn rate, dropout=0, batch size=1, and ReLu activation method. Figure7(a) shows
Figure 6.Distribution of the parameters of the optimized 170 country specific LSTM.
minimum RMSE over iterations, (b) shows different RMSE over iterations. In (c), (d) the distribution of the number of layers and hidden unit and the distribution of learning rate and batch size is shown.
4.4. Training
Each country-specific network is trained using own case and weather data. Although during optimization, the network is validated by predicting active cases, the same network is used to predict death, recovery, and the current number of cases. The networks are trained using a maximum of 5000 epochs combined with the early stopping mechanism used during optimization. The last 10 days data are used for test and rest is used for training. Figure8shows the training loss over epochs and active case prediction using the network optimized for China. It is noted that the loss curve is iterative lowering during training.
4.5. Prediction accuracy
Here we discuss the prediction accuracy of the proposed method. The final fuzzy-rule based classification depends ondeath rate,case rate, andrecover rate. First, the suitable model chosen for a country is trained to predict these three values. We have calculated root-mean-square error (RMSE) on the validation data to evaluate the methods. We have compared using baseline algorithms such as linear regression, lasso linear regression, ridge regression. A single model is used to predict the values of all the countries. It is observed that such methods perform very poorly due to the small dataset. We have also compared the method with some advance neural networks such as a variation of LSTM combined with a fully convolutional network [48], a variation of residual RNN [49], and GRU [50]. It is also noted that very deep networks also failed to predict accurately using such a small dataset. Bayesian optimized shallow GRU is performed close to our method. We have used all the features for baseline comparison expect in Bayesian optimization-based GRU. It is also observed that the inclusion of weather data also improved the prediction accuracy. The results are summarized in Table3.
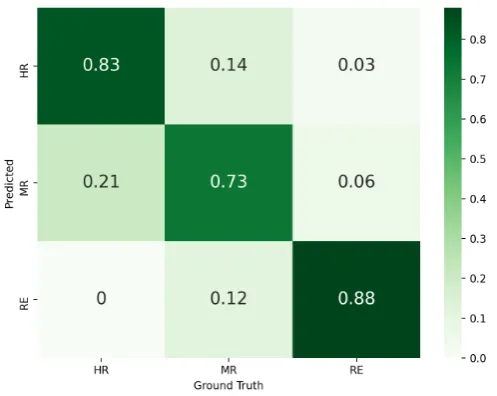
4.6. Risk classification accuracy
Figure 7.(a) minimum validation accuracy over iteration, (b) loss over iteration, distribution of (c) number of layers and hidden nodes, and (d) learning rates and batch size.
Table 3.Average RMSE of last 10 days prediction of death, case, and recovered number.
RMSE Method
COVID-19 Case Recovered Death
Liner Regression 3691.2 1852.5 237.3
Lasso Linear Regression 3602.3 1655.5 242.6
Ridge Regression 3943.0 1655.2 297.9
Elastic Net [51] 3789.3 1411.5 324.3
LSTM-FCNS [48] 3677.0 802.2 266.5
Recidual RNN [49] 3975.5 1266.5 289.5
GRU [50] 3704.5 1206.2 243.5
GRU+Baysian 2605.2 877.3 241.5
Baysian + Without weather data 2605.3 689.3 229.3
Proposed 2156.2 609.7 127.2
Figure 10.Confusion matrix of the four classes for the risk prediction 10 days ahead for 170 countries.
4.7. Computational cost
All the experiments are carried out in Intel(R) Xeon(R) Gold 6154 CPU with 128 GB of RAM and NVIDIA Quadro RTX 6000 GPU of capacity 64 GB. The method utilizes 72 computational hours for feature selection, network optimization, training, and evaluating the method.
5. Conclusion
In this paper, we have proposed a Bayesian optimization guided shallow LSTM for predicting the country-specific risk of the novel corona-virus (COVID-19). We have combined trend data and weather data together to predict different parameters for the risk classification task. We also propose to use the country-specific optimized network for accurate prediction and noted that this is suitable when we have a small and uncertain dataset. Combining the overall optimized LSTMs, we also note that rather deep neural networks, the majority of the cases a small neural network perform well in the data. The method can be useful to predict the long-duration risk of an epidemic like COVID-19.
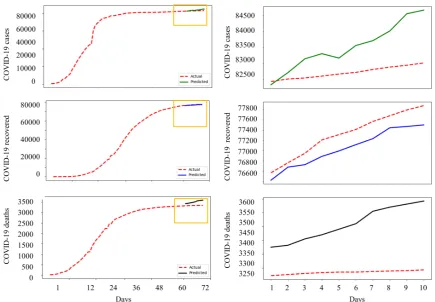
Figure 9.10 days ahead trend prediction in China, COVID-19 cases (row 1), recovered (row 2), and deaths (row 3).
Author Contributions:Conceptualization, R. Pal and A. Ahmed; methodology, R. Pal and D. K. Prasad; software, R. Pal.; validation, S. Kar, D. K. Prasad and A. Ahmed.; formal analysis, , investigation, resources, and data curation, R. Pal.; writing–original draft preparation, R. Pal.; writing–review and editing, A. Ahmed, D. K. Prasad, and S. Kar.; visualization, A. Ahmed.; supervision, A. Ahmed.;
Funding:There is no funding reported for the research. The resources and publication supports are provided by UiT The Arctic University of Norway.
Conflicts of Interest:The authors declare no conflict of interest.
References
1. Wu, F.; Zhao, S.; Yu, B.; Chen, Y.M.; Wang, W.; Song, Z.G.; Hu, Y.; Tao, Z.W.; Tian, J.H.; Pei, Y.Y.; others. A new coronavirus associated with human respiratory disease in China. Nature2020,579, 265–269. 2. Akita, R.; Yoshihara, A.; Matsubara, T.; Uehara, K. Deep learning for stock prediction using numerical
and textual information. 2016 IEEE/ACIS 15th International Conference on Computer and Information Science (ICIS). IEEE, 2016, pp. 1–6.
3. Ali, M.; Lee, Y. CRM Sales Prediction Using Continuous Time-Evolving Classification. Thirty-Second AAAI Conference on Artificial Intelligence, 2018.
4. Xiao, F.; Ai, Q. Data-driven multi-hidden markov model-based power quality disturbance prediction that incorporates weather conditions. IEEE Transactions on Power Systems2018,34, 402–412.
5. Lu, Y.; Wang, S.; Wang, J.; Zhou, G.; Zhang, Q.; Zhou, X.; Niu, B.; Chen, Q.; Chou, K.C. An epidemic avian influenza prediction model based on google trends.Letters in Organic Chemistry2019,16, 303–310. 6. Jia, W.; Li, X.; Tan, K.; Xie, G. Predicting the outbreak of the hand-foot-mouth diseases in China using
7. Hamer, W.B.; Birr, T.; Verreet, J.A.; Duttmann, R.; Klink, H. Spatio-Temporal Prediction of the Epidemic Spread of Dangerous Pathogens Using Machine Learning Methods. ISPRS International Journal of Geo-Information2020,9, 44.
8. Mezzatesta, S.; Torino, C.; De Meo, P.; Fiumara, G.; Vilasi, A. A machine learning-based approach for predicting the outbreak of cardiovascular diseases in patients on dialysis.Computer methods and programs in biomedicine2019,177, 9–15.
9. Jhuo, S.L.; Hsieh, M.T.; Weng, T.C.; Chen, M.J.; Yang, C.M.; Yeh, C.H. Trend Prediction of Influenza and the Associated Pneumonia in Taiwan Using Machine Learning. 2019 International Symposium on Intelligent Signal Processing and Communication Systems (ISPACS). IEEE, 2019, pp. 1–2.
10. Kumar, S.V.; Suresh, V.; Reddy, B.D.K.; Reddy, Y.J. Outbreak Predictions in Healthcare Domain using Machine learning & Artificial Intelligence. TEST Engineering & Management2020,82, 11395–11400. 11. Machado, G.; Vilalta, C.; Recamonde-Mendoza, M.; Corzo, C.; Torremorell, M.; Perez, A.; VanderWaal,
K. Identifying outbreaks of Porcine Epidemic Diarrhea virus through animal movements and spatial neighborhoods. Scientific reports2019,9, 1–12.
12. Philemon, M.D.; Ismail, Z.; Dare, J. A Review of Epidemic Forecasting Using Artificial Neural Networks. International Journal of Epidemiologic Research2019,6, 132–143.
13. Abdulkareem, S.A.; Augustijn, E.W.; Filatova, T.; Musial, K.; Mustafa, Y.T. Risk perception and behavioral change during epidemics: Comparing models of individual and collective learning. PloS one2020. 14. Forna, A.; Nouvellet, P.; Dorigatti, I.; Donnelly, C. Case fatality ratio estimates for the 2013–2016 West
African Ebola epidemic: application of Boosted Regression Trees for imputation.International Journal of Infectious Diseases2019,79, 128.
15. Dallatomasina, S.; Crestani, R.; Sylvester Squire, J.; Declerk, H.; Caleo, G.M.; Wolz, A.; Stinson, K.; Patten, G.; Brechard, R.; Gbabai, O.B.M.; others. Ebola outbreak in rural West Africa: epidemiology, clinical features and outcomes. Tropical Medicine & International Health2015,20, 448–454.
16. Plowright, R.K.; Becker, D.J.; Crowley, D.E.; Washburne, A.D.; Huang, T.; Nameer, P.; Gurley, E.S.; Han, B.A. Prioritizing surveillance of Nipah virus in India. PLoS neglected tropical diseases2019,13.
17. Seetah, K.; LaBeaud, D.; Kumm, J.; Grossi-Soyster, E.; Anangwe, A.; Barry, M. Archaeology and contemporary emerging zoonosis: A framework for predicting future Rift Valley fever virus outbreaks. International Journal of Osteoarchaeology2020.
18. Rao, A.S.S.; Vazquez, J.A. Identification of COVID-19 Can be Quicker through Artificial Intelligence framework using a Mobile Phone-Based Survey in the Populations when Cities/Towns Are Under Quarantine. Infection Control & Hospital Epidemiology2020, pp. 1–18.
19. Yan, L.; Zhang, H.T.; Xiao, Y.; Wang, M.; Sun, C.; Liang, J.; Li, S.; Zhang, M.; Guo, Y.; Xiao, Y.; others. Prediction of criticality in patients with severe Covid-19 infection using three clinical features: a machine learning-based prognostic model with clinical data in Wuhan.medRxiv2020.
20. Peng, L.; Yang, W.; Zhang, D.; Zhuge, C.; Hong, L. Epidemic analysis of COVID-19 in China by dynamical modeling. arXiv preprint arXiv:2002.065632020.
21. Zhao, S.; Lin, Q.; Ran, J.; Musa, S.S.; Yang, G.; Wang, W.; Lou, Y.; Gao, D.; Yang, L.; He, D.; others. Preliminary estimation of the basic reproduction number of novel coronavirus (2019-nCoV) in China, from 2019 to 2020: A data-driven analysis in the early phase of the outbreak. International Journal of Infectious Diseases2020,92, 214–217.
22. Chen, B.; Shi, M.; Ni, X.; Ruan, L.; Jiang, H.; Yao, H.; Wang, M.; Song, Z.; Zhou, Q.; Ge, T. Data Visualization Analysis and Simulation Prediction for COVID-19.arXiv preprint arXiv:2002.070962020.
23. Li, M.; Chen, J.; Deng, Y. Scaling features in the spreading of COVID-19. arXiv preprint arXiv:2002.09199 2020.
24. Hilton, J.; Keeling, M.J. Estimation of country-level basic reproductive ratios for novel Coronavirus (COVID-19) using synthetic contact matrices. medRxiv2020.
25. Kastner, J.; Wei, H.; Samet, H. Viewing the Progression of the Novel Corona Virus (COVID-19) with NewsStand. arXiv preprint arXiv:2003.001072020.
26. Jia, L.; Li, K.; Jiang, Y.; Guo, X.; others. Prediction and analysis of Coronavirus Disease 2019. arXiv preprint arXiv:2003.054472020.
Train/Test Models on Multitudinal/Multimodal Data. Journal of Medical Systems2020,44, 1–5.
32. Al-qaness, M.A.; Ewees, A.A.; Fan, H.; Abd El Aziz, M. Optimization Method for Forecasting Confirmed Cases of COVID-19 in China. Journal of Clinical Medicine2020,9, 674.
33. Li, Y.; Liang, M.; Yin, X.; Liu, X.; Hao, M.; Hu, Z.; Wang, Y.; Jin, L. COVID-19 Epidemic Outside China: 34 Founders and Exponential Growth. medRxiv2020.
34. Araujo, M.B.; Naimi, B. Spread of SARS-CoV-2 Coronavirus likely to be constrained by climate.medRxiv 2020.
35. Dong, M.; Sun, J. Partial Discharge Detection on Aerial Covered Conductors Using Time-Series Decomposition and Long Short-term Memory Network. arXiv preprint arXiv:1907.033782019.
36. Moews, B.; Herrmann, J.M.; Ibikunle, G. Lagged correlation-based deep learning for directional trend change prediction in financial time series.Expert Systems with Applications2019,120, 197–206.
37. Thomas, K. Time Series Prediction for Stock Price and Opioid Incident Location. PhD thesis, Arizona State University, 2019.
38. Lorenzo, A.; Olivas, J.A. Some Considerations on the Use of AI Techniques for Prediction and Forecasting in Political Elections and Stock Market. Proceedings on the International Conference on Artificial Intelligence (ICAI). The Steering Committee of The World Congress in Computer Science, Computer . . . , 2019, pp. 403–407.
39. Bandara, K.; Shi, P.; Bergmeir, C.; Hewamalage, H.; Tran, Q.; Seaman, B. Sales demand forecast in e-commerce using a long short-term memory neural network methodology. International Conference on Neural Information Processing. Springer, 2019, pp. 462–474.
40. Cui, Y.; Hou, H.; Sheng, G.; Jiang, X.; He, M.; Jiang, G.; Chi, J.; Tong, J. A prediction method for power transformer state parameters based on feature attention mechanism. 2019 IEEE PES Asia-Pacific Power and Energy Engineering Conference (APPEEC). IEEE, 2019, pp. 1–5.
41. Jiménez, F.; Palma, J.; Sánchez, G.; Marín, D.; Palacios, F.; López, L. Feature Selection based Multivariate Time Series Forecasting: An Application to Antibiotic Resistance Outbreaks Prediction.Artificial Intelligence in Medicine2020, p. 101818.
42. Tapak, L.; Hamidi, O.; Fathian, M.; Karami, M. Comparative evaluation of time series models for predicting influenza outbreaks: application of influenza-like illness data from sentinel sites of healthcare centers in Iran.BMC research notes2019,12, 353.
43. Su, K.; Xu, L.; Li, G.; Ruan, X.; Li, X.; Deng, P.; Li, X.; Li, Q.; Chen, X.; Xiong, Y.; others. Forecasting influenza activity using self-adaptive AI model and multi-source data in Chongqing, China.EBioMedicine 2019,47, 284–292.
44. Ochodek, M.; Kopczy ´nska, S.; Staron, M. Deep learning model for end-to-end approximation of COSMIC functional size based on use-case names. Information and Software Technology2020, p. 106310.
45. Hu, F.; Zhu, Y.; Liu, J.; Li, L. An efficient Long Short-Term Memory model based on Laplacian Eigenmap in artificial neural networks. Applied Soft Computing2020, p. 106218.
46. Wen, S.; Wang, Y.; Tang, Y.; Xu, Y.; Li, P.; Zhao, T. Real-Time Identification of Power Fluctuations Based on LSTM Recurrent Neural Network: A Case Study on Singapore Power System. IEEE Transactions on Industrial Informatics2019,15, 5266–5275.
47. Yuan, J.; Wang, H.; Lin, C.; Liu, D.; Yu, D. A novel GRU-RNN network model for dynamic path planning of mobile robot. IEEE Access2019,7, 15140–15151.
48. Karim, F.; Majumdar, S.; Darabi, H.; Harford, S. Multivariate lstm-fcns for time series classification. Neural Networks2019,116, 237–245.
50. Althelaya, K.A.; El-Alfy, E.S.M.; Mohammed, S. Stock market forecast using multivariate analysis with bidirectional and stacked (LSTM, GRU). 2018 21st Saudi Computer Society National Computer Conference (NCC). IEEE, 2018, pp. 1–7.