International Journal of Nanomedicine 2016:11 6307–6324
International Journal of Nanomedicine
Dove
press
submit your manuscript | www.dovepress.com 6307
O r I g I N a l r e s e a r c h
open access to scientific and medical research
Open access Full Text article
study of a new bone-targeting titanium
implant–bone interface
Xiangning liu1,*
Ye Zhang1,*
shaobing li2,*
Yayu Wang3
Ting sun1
Zejian li1
lizhao cai1
Xiaogang Wang3,*
lei Zhou2
renfa lai1
1The Medical center of stomatology, The First affiliated hospital of Jinan University, 2The Department of Oral Implantology, guangdong Provincial stomatological hospital, southern Medical University, 3Department of cell Biology, Institute of Biomedicine, college of life science and Technology, Jinan University, guangzhou, People’s republic of china
*These authors contributed equally to this work
Abstract: New strategies involving bone-targeting titanium (Ti) implant–bone interface are
required to enhance bone regeneration and osseointegration for orthopedic and dental implants, especially in osteoporotic subjects. In this study, a new dual-controlled, local, bone-targeting delivery system was successfully constructed by loading tetracycline-grafted simvastatin (SV)-loaded polymeric micelles in titania nanotube (TNT) arrays, and a bone-targeting Ti implant–bone interface was also successfully constructed by implanting the delivery system in vivo. The biological effects were evaluated both in vitro and in vivo. The results showed that Ti surfaces with TNT–bone-targeting micelles could promote cytoskeletal spreading, early adhesion, alkaline phosphatase activity, and extracellular osteocalcin concentrations of rat osteoblasts, with concomitant enhanced protein expression of bone morphogenetic protein (BMP)-2. A single-wall bone-defect implant model was established in normal and ovariecto-mized rats as postmenopausal osteoporosis models. Microcomputed tomography imaging and BMP-2 expression in vivo demonstrated that the implant with a TNT-targeting micelle surface was able to promote bone regeneration and osseointegration in both animal models. Therefore, beneficial biological effects were demonstrated both in vitro and in vivo, which indicated that the bone-targeting effects of micelles greatly enhance the bioavailability of SV on the implant– bone interface, and the provision of SV-loaded targeting micelles alone exhibits the potential for extensive application in improving local bone regeneration and osseointegration, especially in osteoporotic subjects.
Keywords: bone regeneration, titania nanotubes, targeted drug delivery, orthopedic implant,
drug release, micelles
Introduction
Despite rapid development in materials science and biotechnology, satisfactory bone regeneration and osseointegration remain major challenges for orthopedic and dental implants in cases of age-related, postmenopausal and other forms of secondary osteopo-rosis resulting from systemic diseases or pharmacological therapies.1–4 Many clinicians
and researchers have observed that bone regeneration and biomaterial osseointegration are slower in osteoporotic subjects, with an increased rate of prosthetic device failure in both dental and orthopedic reconstructive surgery.5–7 Different strategies have
been proposed to improve implant–bone interfaces on mainstream titanium (Ti) and Ti alloy implants, including the manipulation of surface topography, application of biomimetic coatings, and local delivery of drugs to enhance bone formation or inhibit bone resorption.8–10 To enhance the osseointegration of Ti implants in either normal or
osteoporotic subjects, in some ways, it is important to induce and enhance the osteoblast functions more precisely and more effectively on the implant–bone interface. Thus, the studies of bone-targeting Ti implant–bone interface with bone-targeting effect
correspondence: renfa lai The First Affiliated Hospital of Jinan University, No 613 huangpu avenue, Tianhe District, guangzhou 510630, People’s republic of china Tel +86 20 3868 8109 Fax +86 20 3868 8000 email [email protected]
lei Zhou
guangdong Provincial stomatological hospital, southern Medical University, No 366 Jiangnan avenue south, guangzhou 510280, People’s republic of china
Tel +86 20 8423 3801 Fax +86 20 8443 3177 email [email protected]
Journal name: International Journal of Nanomedicine Article Designation: Original Research
Year: 2016 Volume: 11
Running head verso: Liu et al
Running head recto: Study of a new bone-targeting titanium implant–bone interface DOI: http://dx.doi.org/10.2147/IJN.S119520
International Journal of Nanomedicine downloaded from https://www.dovepress.com/ by 118.70.13.36 on 23-Aug-2020
For personal use only.
Number of times this article has been viewed
This article was published in the following Dove Press journal: International Journal of Nanomedicine
Dovepress
liu et al
have become a focus recently. Among the modifications to the Ti surface, the nanotubular structure fabricated by anodic oxidation has demonstrated accelerated osteoblast adhesion or proliferation and can be used as a carrier for drugs and antibacterial agents,11,12 certainly including bone-
targeting agents.
Simvastatin (SV) is a well-known member of the statin family, which comprises hydroxy-3-methylglutaryl coen-zyme A reductase inhibitors and represents one of the most promising families of antiosteoporotic drugs. Specifically, SV acts as an activator of bone morphogenetic protein-2 (BMP-2), which accounts for the major osteoinductive poten-tial of bone.13 For the systemic administration of SV, a
hydro-phobic small molecule drug, it has been reported that ,5% of an oral dose reaches the systemic circulation and that high doses increase the risk of liver failure, kidney disease, and other side effects.14 However, local administration can
bypass the hepatic degradation of SV to achieve therapeutic concentrations in bone and avoid the side effects caused by systemic administration. Furthermore, local delivery of SV at the desired site of action has been shown to have posi-tive effects on bone formation.15,16 Although there are some
reports about the administration of SV enhancing the bone regeneration around implants, few studies involved the relationship between local delivery of SV and implant–bone interface, especially for the in vivo studies in either normal or osteoporosis models.17,18 As the polymeric micellar system
is considered promising for enhancing the bioavailability and reducing the toxic side effects of hydrophobic drugs, SV-loaded polymeric micelles with sustained-release profiles were developed with preferable bioavailability in our previ-ous study.19 Then, in our additional previous study, SV-loaded
polymeric micelles were loaded in titania nanotube (TNT) arrays to develop a local delivery system.11 However, a big
difficulty for the application of this delivery system was the lack of bone-targeting effects; SV-loaded polymeric micelles could be rapidly released from the TNTs and spread far from the implant–bone interface, which seemingly prevents the best biological efficiency of SV on the osteoblasts, contribut-ing to osseointegration.
Tetracycline (TC) has been shown by numerous studies to display a high affinity for the mineral constituent of bone (hydroxyapatite).20 TC is also well known as a broad-spectrum
antibiotic, as well as an inhibitor of mammalian collagenases and matrix metalloproteinases, which promotes its applica-tions in disorders such as periodontitis, atherosclerotic car-diovascular disease, and osteoarthritis.21,22 As a bone-targeting
drug agent, TC offers the advantages of being relatively nontoxic compared to bisphosphonates.20,23,24 In addition, the
biological activity of pharmaceutical TC is less susceptible to physicochemical factors and physiological environments compared with bone-targeting biological agents such as acidic oligopeptides and aptamers.20,25 Wang et al26 reported the
development of nanoparticles (NPs) that target bone tissue by poly(lactic-co-glycolic acid) copolymers and TC-based bone-targeting moieties and found that the NPs loaded with SV could improve the curative effects of SV on the recovery of bone mineral density in vivo. Consequently, the strong bone-binding potential of TC has inspired our efforts to establish its conjugation to polymer to affect bone targeting in a local delivery system and implant–bone interface.
In the current study, TC-grafted SV-loaded polymeric micelles were prepared and loaded in TNT arrays to develop a dual-controlled, local, bone-targeting delivery system. Then, this system was implanted in vivo to develop a bone-targeting Ti implant–bone interface. The biological effects of this system were evaluated in vitro and in vivo. The local delivery system would be expected to improve local bone regeneration and osseointegration in normal and postmeno-pausal osteoporosis models because of bone-targeting Ti implant–bone interface.
Materials and methods
synthesis and characterization of the
Tc–poly(ethylene glycol)
(Peg)–poly(ε-caprolactone) (Pcl) (Tc–Pecl) polymer
The synthesis process is shown in Figure 1. First, 3.6 g Boc– NH–PEG–OH 2000 (tert-butoxycarbonyl-protected NH2– PEG–OH, MW 2000), 3.6 g caprolactone (CL) [ε-CL], 27 mg Sn(Oct)2 (Suzhou Nord Derivatives Pharm-tech Co., Ltd., Suzhou, China) and a total volume (TV) of 45 mL toluene solution was sequentially added to the sealed reaction flask in the glove box. The sealed reaction flask was placed in an oil bath at 80°C for 48 h of reaction. Then, excess CH3I was added, and the reaction was continued at room temperature for 24 h. Thus, the polymer Boc–NH–PEG–PCL (OCH3) was synthesized by ring-opening polymerization of ε-CL with Boc–NH–PEG–OH 2000 under the catalysis of Sn(Oct)2 and capped with CH3I. Second, under the protection of nitrogen, the resulting polymer NH2–PEG–PCL (OCH3) was produced by deprotection of Boc–NH–PEG–PCL (OCH3) via 4 M HCl in the 1,4-dioxane solution for 4 h at 30°C. When 3 g NH2 -PEG-PCL(OCH3), 4.5 g triphosgene and 3 mL of pyridine were mixed together in 45 mL of dry dichloromethane at room temperature overnight, the polymer NCO-PEG-PCL (OCH3) was synthesized by transformation of –NH2 into –NCO. Third, under the protection of nitrogen and the catalysis of
International Journal of Nanomedicine downloaded from https://www.dovepress.com/ by 118.70.13.36 on 23-Aug-2020
Dovepress study of a new bone-targeting titanium implant–bone interface
Figure 1 synthesis process of the polymer.
Notes: (A) synthesis process diagram of Tc–Pecl polymer: i, under the conditions of sn(Oct)2, methylbenzene, and ch3; ii, under the conditions of 4 M hcl; iii, under
the conditions of triphosgene and pyridine; iv, under the conditions of Tc and dibutyltin dilaurate. (B) synthesis process of Pecl polymer: under the conditions of sn(Oct)2
and methylbenzene (i).
Abbreviations: cl, caprolactone; mPeg, methoxy Peg; Pcl, poly(ε-caprolactone); Pecl, Peg–Pcl; Peg, poly(ethylene glycol); Tc, tetracycline.
2 2
%RF +1 2 P+
L
%RF±1+±3(*±2+
%RF±1+±3(*±3&/2&+ 1&2±3(*±3&/2&+
J&/
P± %RF
Q
+1
2
2
2 2
P±
Q
2&1
2
2
2 2
LLL
1+±3(*±3&/2&+ 7&±3(*±3&/2&+
P±
Q
+1 2
2
2 2
Q
P± 7&
2
2
2 2 LY
LL
P3(*±3&/
2 2 L
P3(*±2+
J&/
2 2
P+
+
Q
2
2 2
2 2
P±
$
%
60 μL dibutyltin dilaurate, the reaction between 1.1 g TC and 2 g NCO–PEG–PCL (OCH3) in 45 mL of dry tetrahydrofuran continued at room temperature for 12 h. Therefore, the final polymer TC–PEG–PCL (OCH3) was synthesized by the reac-tion of –OH on TC and –NCO on NCO–PEG–PCL (OCH3) groups. The proton nuclear magnetic resonance (1H-NMR)
spectra of the products were obtained using an NMR spec-trometer (BioSpin AC-80; Bruker Optik GmbH, Ettlingen, Germany). For testing, 5 mg of TC–PECL was dissolved in 600 μL of deuterated dimethyl sulfoxide.
As a control, methoxy PEG–PCL (2000–2000) block polymer was synthesized by ring-opening polymerization of CL to PEG–OH 2000 under the catalysis of Sn(Oct)2, which is shown in Figure 2. The characterization of the products was obtained as described earlier.
Preparation and properties of Tc-grafted
Pecl micelles
Preparation
As in our previous study,19 SV-loaded micelles were prepared
by a membrane dialysis method. Briefly, 100 mg of TC-PECL polymer and a fixed amount of SV were dissolved in 16 mL acetone. Deionized water (20 mL) was added dropwise to the polymer solution while stirring, followed by
ultrasonication of the solution in an ice bath. This mixture was then dialyzed against deionized water at room tempera-ture for 24 h using a dialysis bag with a molecular weight cutoff of 3,500 g/mol. The dialysis process enabled the solvent exchange between the acetone and deionized water, during which self-assembly of the PECL occurred. After dialysis, the solution in the dialysis bag was collected and filtered through a 0.45 μm syringe filter. As a control, PECL micelles were also prepared.
characterization
The particle sizes of the TC–PECL and PECL micelles were evaluated by dynamic light scattering (Nano ZS, ZEN3600; Malvern Instruments Ltd., Malvern, UK) after appropriate dilution with deionized water. Light-scattering data were obtained at a detection angle of 173° at 25°C and were subsequently analyzed by the cumulant method to obtain the hydrodynamic diameter and polydispersity index (PDI) of the micelles; the pH value and zeta potential were also obtained. The morphological characteristics of the TC–PECL and PECL micelles were examined by transmission electron microscopy (TEM; TecnaiG220; FEI, Hillsboro, OR, USA). For analysis, the samples were placed on copper grids and stained with 1.0 wt% phosphotungstic acid.
International Journal of Nanomedicine downloaded from https://www.dovepress.com/ by 118.70.13.36 on 23-Aug-2020
Dovepress
liu et al
Encapsulation ratio and drug-loading (DL) efficiency
To determine the SV DL ratio and encapsulation efficiency (EE), a known amount of SV-loaded micelles was dissolved in 1 mL of tetrahydrofuran. This solution was then analyzed in an ultraviolet (UV) spectrophotometer at 238 nm, with TC–PECL solution as the control. The drug concentration in the solution was calculated based on the standard curve. The DL ratio and drug EE were obtained according to the following formulae:
DL
The amount of drug loaded in the micelles The amount of drug add
(%)
=
eed during fabrication×100%
EE(
The amount of drug loaded in the micelles The total amount of dr
%)
= uug in the micelles and
PECL conjugate used in the process
×100%
In vitrosV release
TC–PECL micelle solution was loaded with 9 mg SV. The same amounts of SV loaded in PECL micelle solution were
prepared as controls. Both the SV-loaded micelles and the free SV were placed into a dialysis bag suspended in a 0.2% sodium dodecyl sulfate (SDS) solution. The TV of each sample solution was 20 mL. The sealed vials were placed in a gas bath thermostatic oscillator (SHZ-82; Jintan Honghua Instruments Co. Ltd., Jintan, China) at 200 rpm and 37°C. At predetermined time intervals, 3 mL aliquots of the solu-tion were withdrawn from the release medium and replaced with fresh medium. The SV concentration was analyzed by measuring the UV absorbance at 238 nm.
hydroxyapatite-binding assay
Apatite is the main component of bone in its natural state. In vertebrate bones, this inorganic material is known as hydroxyapatite or carbonated hydroxyapatite. To confirm the bone-targeting property of TC–PECL micelles in vitro, a hydroxyapatite-binding assay was performed as follows: 20 mg hydroxyapatite was dispersed in 40 mL TC–PECL micelle solution, and the same amounts of hydroxyapatite in PECL micelle solution were prepared as controls. The micelle solution was placed into the centrifuge tube in the gas bath
7&
7&
7&
D
E E
F G
D
E H
F G
2 2
Q
2
$
%
&
'
P± H 2
P± 2 2
SSP
SSP
SSP
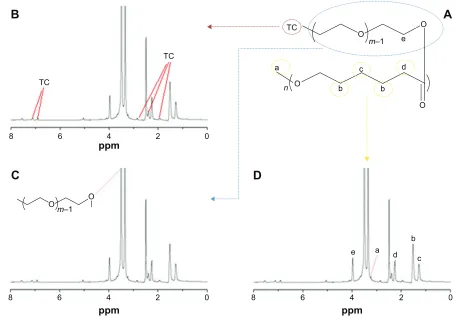
Figure 2 1h-NMr spectrum of the Tc–Pecl polymer.
Notes: (A) Molecular structure diagram of the Tc–Pecl polymer. (B) 1h-NMr spectrum of the Tc–Pecl polymer marked with the hydrogen atoms of the benzene ring
of Tc. (C) 1h-NMr spectrum of the Tc–Pecl polymer marked with the hydrogen atoms of the Peg copolymers. (D) 1h-NMr spectrum of the Tc–Pecl polymer marked
with the hydrogen atoms of the Pcl copolymers.
Abbreviations:1h-NMr, proton nuclear magnetic resonance; Pcl, poly(ε-caprolactone); Pecl, Peg–Pcl; Peg, poly(ethylene glycol); Tc, tetracycline.
International Journal of Nanomedicine downloaded from https://www.dovepress.com/ by 118.70.13.36 on 23-Aug-2020
Dovepress study of a new bone-targeting titanium implant–bone interface
thermostatic oscillator at 200 rpm and 37°C. At predetermined time intervals, the centrifuge tube was removed from the oscillator and centrifuged for 25 min at 8,000 rpm and 20°C. Then, the centrifuged deposit was washed twice with pure water and purified by centrifugation for 10 min at 8,000 rpm and 20°C, which was repeated three times. After completion of 72 h of freeze-drying, the lyophilizate was weighed. The hydroxyapatite-binding rates at 6, 12, 24, 36, 48, and 72 h were calculated according to the following formula:
Hydroxyapatite-binding rate (%) The amount of hydroxyapatite
=
aafter immersion in micelle solution the primary amount of h
− yydroxyapatite
The primary amount of hydroxyapatite ×100
Fabrication and morphology
of TNT arrays
The TNTs were fabricated by the method of anodic oxida-tion on a Ti sheet, as reported earlier.11,27 The Ti sheet was
mechanically polished and cleaned by sonication in acetone for 30 min, prior to anodization. In a typical procedure, a 2×3 cm2, cleaned Ti sheet (99%) with a thickness of 0.1 mm
was used as an anode and an iron/tantalum alloy as a cathode. The electrolyte was a solution containing 1,2,3-propanetriol, NH4F (1.1 wt%), and H2O (15 vol%). The anodizing voltage varied from 0 to 25 V with an increasing rate of 500 mV/s and was maintained at 25 V for 1 h. The prepared TNTs were then annealed in air at 450°C for 4 h to form a steady anatase crystal phase and improve the interfacial structure between the TNT film and Ti substrate.28,29
The surface morphology of the TNTs was examined by field-emission scanning electron microscopy (SEM; ZEISS ULTRA55; Carl Zeiss Company, Oberkochen, Germany) at an acceleration voltage of 20 kV.
loading sV-loaded micelles into the TNTs
SV-loaded TC–PECL micelles were loaded into the TNTs via a simplified drying method with a vacuum, according to our previous study.11 For cytological tests, TNT samples
(1×1 cm ×0.1 mm) were cleaned with deionized water and anhydrous ethanol prior to loading the micelles. Then, a 0.09 mg/mL concentration of SV-loaded TC–PECL micelles and a 0.085 mg/mL concentration of SV-loaded PECL micelles were prepared. A 10 μL aliquot of the micelle solution was pipetted onto the TNT surface and gently spread to ensure even coverage. The surfaces were then allowed to dry under a vacuum at room temperature
for 4 h. For the in vivo tests, a 0.9 mg/mL concentration of SV-loaded TC–PECL micelles and a 0.85 mg/mL concentra-tion of SV-loaded PECL micelles were prepared, and TNT specimens (0.5×0.1 cm ×0.1 mm) were placed into 1 mL micelle solution in centrifuge tubes for 24 h of immersion. After the excess liquid was removed from the centrifuge tubes, the specimens were allowed to dry under a vacuum at room temperature for 24 h.
cytological tests
cell culture
The cytological features of the Ti samples were evaluated in vitro using primary rat calvaria-derived osteoblasts pri-mary cells cultured in complete medium under standard culture conditions (37°C and 5% CO2). The complete medium included Dulbecco’s Modified Eagle’s Medium (Life Tech-nologies Corp., Grand Island, NY, USA) supplemented with 10% fetal calf serum (Gibco Laboratories), 100 U/mL penicillin, and 100 mg/mL streptomycin (Sigma-Aldrich Co., St Louis, MO, USA).
For the siRNA transfection experiments in rat osteoblasts in vitro as given in the “FAM-siRNA transfection test” sec-tion, the following five groups were tested: TNTs loaded with SV-loaded TC-grafted PECL micelles (NT-SVTCPM), TNTs loaded with SV-loaded PECL micelles (NT-SVPM), SV-loaded TC-grafted PECL micelles (SVTCPM), SV-loaded PECL micelles (SVPM), and a blank (BK) as the control. According to our previous study, SV-loaded micelles with 2.5×10⁻⁷ SV molecules were optimal for incubation with
the osteoblasts; therefore, this was used as the concentration reference for micelles in each group in the current study. In the other in vitro tests, the following four groups of Ti sheets were tested: NT-SVTCPM, NT-SVPM, uncoated TNTs (NT) as the positive control, and polished Ti (PT) metal as the negative control. To seed the cells on the surface of the Ti samples (1×1 cm), each sheet was placed onto the bottom of one well of a 24-well plate. The plates were then placed in a biological hood in the presence of UV light for 30 min for sterilization. The surfaces of the Ti sheets were then washed twice with warm phosphate-buffered saline (PBS), and the cells were plated at a density of 2×10⁴ cells/cm2. The medium
was refreshed twice a week.
FaM-sirNa transfection test
Negatively charged siRNAs labeled with carboxyfluores-cein (FAM-siRNAs) were able to be transfected into cells by binding to the positively charged NPs.25,26 To confirm
the bone-targeting abilities of TC–PECL micelles toward rat osteoblasts in vitro, the visualized cellular uptake of the
International Journal of Nanomedicine downloaded from https://www.dovepress.com/ by 118.70.13.36 on 23-Aug-2020
Dovepress
liu et al
micelles was detected using an FAM-siRNA transfection test. In both the NT-SVTCPM and NT-SVPM groups, cells (2×10⁴ cells/cm2) were seeded onto Ti samples in the 24-well
plates and treated with a concentration of 80 nM FAM-siRNAs, during which time the cells attached to the plate. In the SVTCPM, SVPM, or BK groups, the cells were seeded in the 24-well plates and treated instead with SVTCPM plus FAM-siRNAs, SVPM plus FAM-siRNAs, or FAM-siRNAs alone, respectively. After co-incubation for 1–12 h, cells were washed twice with PBS and the samples were observed and imaged by fluorescence microscopy (DMI6000B; Leica, Wetzlar, Germany) at the time points of 1, 2, 3, 4, 5, 6, and 12 h, respectively.
cytoskeletal arrangement and early cell adhesion
Immunofluorescence staining was used to evaluate the cytoskeletal arrangement of rat osteoblasts cultured on Ti samples after 2, 6, 12, and 24 h of incubation, and cell adhe-sion was evaluated after 1, 2, and 6 h of incubation. After incubation, samples were rinsed twice with prewarmed PBS and then fixed in 4% paraformaldehyde at room temperature for 30 min, followed by three PBS rinses. Cells were incu-bated with PBS containing 5 μg/mL rhodamine phalloidin (Cytoskeleton, Inc., Denver, CO, USA) for 30 min at room temperature, followed by three PBS rinses, then with 4′ ,6-diamidino-2-phenylindole (DAPI) for 10 min for nuclei staining followed by two PBS rinses. Next, the fluorescence mounting medium (neutral buffer plus the same amount of glycerol) was added to the samples, which were observed by confocal laser scanning microscopy (CLSM; TCS SP2 AOBS; Leica). The samples used for the evaluation of early cell adhesion were incubated only with DAPI for 10 min. High-magnification immunofluorescence images were used to examine the actin arrangement and adhesion points. For the evaluation of early cell adhesion, each sample was selected to obtain a relatively uniform distribution of five dif-ferent horizons for images at 126× magnification. An image-processing system (Image-Pro Plus 7.0; Media Cybernetics, Inc., Rockville, MD, USA) was used to analyze and count the number of adherent cells. The adhesion rate was calcu-lated according to the following formula:
Adhesion rate ( ) The number of adherent cells The number of
% =
inoculated cells×100
cell proliferation
Cell proliferation was evaluated by determining the mito-chondrial dehydrogenase enzymatic activity in metabolically active cells, using the methyl tetrazole sulfate (MTS) assay
kit (CellTiter 96VR AQueous One Solution Cell Proliferation Assay; Promega, Madison, WI, USA), which measures the conversion of MTS to a colored aqueous soluble formazan product. After 1, 2, and 3 days of incubation, Ti samples were rinsed three times with PBS and then incubated with 10% MTS reagent at 37°C for 4 h in a humidified, 5% CO2 atmosphere. Thereafter, the absorbance of 100 μL of culture medium containing colored formazan product was measured in a 96-well plate, using a spectrophotometric microplate reader (Multiskan MK3; Thermo Fisher Scientific Inc., Hudson, NH, USA) at 492 nm.
alkaline phosphatase (alP) activity
The ALP produced by the cells was measured to determine the degree of osteoblastic differentiation. After 1, 2, and 3 days of incubation, Ti samples were rinsed three times with PBS and cells were digested and collected by centrifugation at 800 rpm for 3 min at room temperature. The cell pellets were lysed in 100 μL 0.1% Triton X-100 by three standard freeze-thaw cycles. The cell lysates were quantified with a colorimetric quantitative assay kit (Nanjing Jiancheng Bioengineering Institute, Nanjing, China). According to the experimental protocol of the kit, the amount of ALP was measured at a wavelength of 405 nm. The protein concen-trations were evaluated using the bicinchoninic acid (BCA) assay kit (Thermo Fisher Scientific Inc.). The absorbance of the solution was measured at 560 nm, and the amount of total protein was calculated using a standard curve. To determine the ALP activity, the amount of ALP was normalized to the amount of total proteins synthesized.
enzyme-linked immunosorbent assay (elIsa) for osteocalcin (Oc)
OC, a marker for the late stage of osteoblast differentiation, is expressed by highly differentiated osteoblasts during the mineralization stage. The extracellular OC concentration was determined via ELISA using a rat OC ELISA kit (Shanghai Westang Biological Scientific Technology Co., Ltd., Shanghai, China). After 3, 7, and 14 days of incubation, the cell lysates and supernatants of each Ti sample were collected and sub-jected to ELISA. According to the manufacturer instruction, the OC concentrations were quantified by measuring the absor-bance at 450 nm with reference to the standard curve calculated by detecting the samples provided in the ELISA kit.
Western blot analysis
Western blotting was used to measure the protein expression of BMP-2 in the rat osteoblasts cultured for 48 h with the different Ti samples. Cells were washed with ice-cold PBS
International Journal of Nanomedicine downloaded from https://www.dovepress.com/ by 118.70.13.36 on 23-Aug-2020
Dovepress study of a new bone-targeting titanium implant–bone interface
three times and lysed with a lysis buffer containing protease inhibitors. The protein content was quantified using the BCA protein assay. Equal amounts of protein (30 μg per lane) were loaded onto a 10% SDS-polyacrylamide gel, followed by transfer to a polyvinylidene difluoride membrane. The membrane was blocked with 5% nonfat milk solution in Tris-buffered saline with 0.1% Triton X-100 (TBST) for 1 h and then incubated with the primary antibody (Anti-BMP2 antibody; Abcam, Cambridge, MA, USA) in TBST (1/300 dilution) at 4°C overnight. The membrane was then washed and incubated with the secondary antibody (goat anti-mouse IgG(H+L)-horseradish peroxidase; Tianjin Sungene Biotech Co., Ltd, Tianjin, China) for 1 h at room temperature. Band-Scan 5.0 software was used with a gray scale scan to evaluate the relative values for protein expression.
In vivo tests
animals and surgical procedures
The in vivo experiments were performed using both normal and postmenopausal osteoporosis animal models in equal numbers. Seventy-eight 8-week-old female Sprague Dawley rats were obtained from Guangdong Medical Laboratory Ani-mal Center (Guangzhou, People’s Republic of China), which were randomly divided into 39 rats for each model. The study protocol was approved by the Ethics Committee of Jinan University, and animal care guidelines of The Regulations on Administration of the Institute of Laboratory Animal Science, Jinan University, were followed in this study. All rats were reared in individual cages; the temperature was maintained at 20°C–25°C and the relative humidity at 30%–50%. All surgical procedures were performed under intraperitoneal anesthesia induced with pentobarbital sodium (30 mg/kg). A phytoestrogen-free diet and tap water were available ad libitum. To establish the postmenopausal osteoporosis animal model, the 39 female rats were subjected to ovariectomy and three animals were sacrificed at 14 weeks after ovariectomy (ie, at the time of implant surgery) to confirm the degree of reduced bone mineral density of the ovariectomized rats. The bone mineral density of the tibia compartment in the knee joint was compared to that of the three otherwise identical animals that had not undergone ovariectomy.
In both rat models, the following four groups of Ti speci-mens (5×1×0.1 mm) were used for implantation in the rat tibia: NT-SVTCPM (n=3), NT-SVPM (n=3), NT (n=3) as the positive control, and PT (n=3) as the negative control. These were labeled as NT-SVTCPM1 for the normal model and NT-SVTCPM2 for the ovariectomized rat models.
The implants were inserted into the middle tibia on the right side of each rat. Under intraperitoneal anesthesia
induced with pentobarbital sodium (30 mg/kg), after incision and dissection of the skin, muscle, fascia, and periosteum in the inner side of the right leg, a 5×1×0.5 mm bone-defect groove (a wall of bone defect) was made in the middle tibia, using handheld drills moving parallel to the longitudinal axis of the tibia. A Ti specimen serving as the implant was then horizontally placed into the bone groove ensuring contact with the undersurface as well as the upper and the lower ends of the bone groove. Dental resin was used to wrap the tibial groove with a collagen membrane covering to fix the Ti specimens in place, followed by wound stitching. Antibiotics (penicillin and streptomycin, 50,000 U/kg) were administered subcutaneously daily on the first 3 postoperative days. Postoperative antibiotic treatment was administered according to the body weight by injection into the rats twice daily for 4 days.
Microcomputed tomography (m-cT) analysis
m-CT was performed using the ZKKS-MCT-Sharp apparatus (Guangzhou Zhongke Kaisheng Medical Technology Com-pany, Guangzhou, People’s Republic of China), operating with an anode electrical current of 60 kV with an aluminum filter for elimination of the hardening beam at a resolution of 20 μm. The normal rats in each group at 1, 2, and 4 weeks after implantation and the ovariectomized rats in each group at 2, 4, and 8 weeks after implantation were sacrificed, and the legs were scanned by m-CT to evaluate the bone–implant contact changes. Regions of interest (ROI) that included the tibia compartment around the implants and in the knee joint were selected. After scanning, three-dimensional (3D) models were generated and trabecular analysis of the tibia compart-ment in the knee joint was analyzed using a medical image-processing and analyzing program (Medproject; Guangzhou Zhongke Kaisheng Medical Technology Company). Bone volume to TV (BV/TV) of ROI for the tibia compartment in the knee joint was calculated as a typical indicator for trabe-cular analysis, which was always used to evaluate relative changes in BV density following a given treatment.
Western blot analysis
Western blotting was performed to measure the protein expression of BMP-2 in the bone tissue in the implantation region. The protein content was extracted from the rat bone tissue of the subject rats at 2 and 4 weeks after implanta-tion. A small sample of fresh bone tissue was lysed with a lysis buffer containing protease inhibitors accompanied by 3–5 min of homogenization. The subsequent procedures were as described earlier in the “Western blot analysis” section regarding in vitro.
International Journal of Nanomedicine downloaded from https://www.dovepress.com/ by 118.70.13.36 on 23-Aug-2020
Dovepress
liu et al
statistical analysis
Data were expressed as mean ± standard deviation and the mean ± standard error of the mean. Statistical analysis was performed with a factorial-designed ANOVA using the IBM SPSS Statistics 21.0 (International Business Machines Corp., Armonk, NY, USA). The Levene’s test for homogeneity of variance was used followed by a pairwise comparison by the Bonferroni test in the case of homogeneity variance or by Tamhane’s T2 test in the case of heterogeneity of variance. Differences were considered significant when the P-value was ,0.05.
Results
characterization of the Tc–Pecl
polymer
TC–PECL was successfully synthesized by the conjugation of –OH on TC and –NCO on NCO–PEG–PCL (OCH3) groups. To characterize the TC–PECL polymer, the product was evaluated by 1H-NMR spectroscopy. As shown in Figure 2, the 1H-NMR spectra revealed peaks at 1.5–3.0 and 6.5–7.5 ppm
that corresponded to the hydrogen atoms of the benzene ring of TC, a peak at 3.5–4.0 ppm representing the hydrogen atoms of the PEG copolymers, as well as the peak at 3.5–4.0 ppm representing the hydrogen atoms of the PCL copolymers.
Properties of Tc–Pecl micelles
characterization of Tc–Pecl micelles
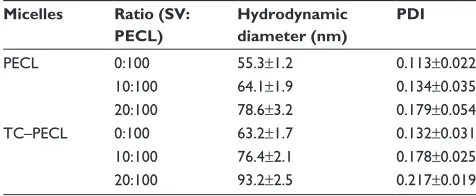
Table 1 lists the hydrodynamic diameter and PDI of micelles from different ratios of SV/TC–PECL in addition to SV/PECL as a control. The SV loading caused an increase in size, most likely because of a change in the micellar structure caused by the SV enclosed in the hydrophobic core of the micelles. The mean diameter of the micelles produced from 10% SV/TC–PECL copolymer was ~76 nm with a narrow distribution in size, whereas that from 10% SV/PECL copolymer was ~64 nm. For both TC–PECL and PECL micelles; however, no obvious change was observed in the narrow size distributions of micelles upon SV loading. TEM images of SV-loaded micelles are shown in Figure 3A. The micelles were sparsely scattered and nearly spherical in shape. The SV-loaded TC–PECL micelle sizes in the TEM were ~80 nm, which was consistent with the dynamic light-scattering determination. In this study, SV-loaded TC–PECL micelles produced from 10% SV/ TC–PECL with DL and EE of 9.1% and 91%, respectively, with a zeta potential of -40.9 and pH value of 6.8 were selected for the in vitro release test and cytological and in vivo experiments. SV-loaded PECL micelles produced from 10% SV/PECL with DL and EE of 8.7% and 87%,
respectively, with a zeta potential of -45.8 and pH value of 7.2 were applied as a control. These DL and EE values accounted for the higher loading capacity of TC–PECL micelles than that of PECL micelles.
In vitro sV release
The cumulative release profiles of SV from drug-loaded micelles are shown in Figure 3B. A typical sustained-release profile for the micelle solution was observed, indicating that a sustained and slow release of the drug over a prolonged period of time was achieved. TC–PECL micelles exhibited a cumulative drug release of 91.7% or so during a 126 h time span, whereas PECL micelles showed ~84.9% release within the same time span. There were no significant differences in cumulative drug release between SV-loaded TC–PECL micelles produced from 10% SV/TC–PECL and SV-loaded PECL micelles from 10% SV/PECL (P.0.05).
hydroxyapatite-binding rate of micelles
As shown in Figure 3C, the hydroxyapatite-binding rate of TC–PECL micelles increased with the time extension and reached 100% at 72 h; however, the rate of PECL micelles remained under 21.5%.
Morphology of TNT arrays and TNTs
loaded with micelles
The morphologies of the TNT arrays and TNTs loaded with micelles were characterized by field-emission SEM and are shown in Figure 3D. A typical cross-sectional image of free-standing TNT structures, removed from the Ti substrate for imaging purposes, is presented. A high-resolution image of the cross-sectional SEM image of the TNT layer shows a vertically aligned and densely packed array of TNTs across the entire structure. SEM images of the top of the TNT surface (Figure 3D1) shows the presence of pores with diameters of ~100–120 nm and a tube wall thickness of ~15–20 nm.
Table 1 hydrodynamic diameter and PDI of micelles with
different sV ratios
Micelles Ratio (SV: PECL)
Hydrodynamic diameter (nm)
PDI
Pecl 0:100 55.3±1.2 0.113±0.022
10:100 64.1±1.9 0.134±0.035
20:100 78.6±3.2 0.179±0.054
Tc–Pecl 0:100 63.2±1.7 0.132±0.031
10:100 76.4±2.1 0.178±0.025
20:100 93.2±2.5 0.217±0.019
Note: Data are expressed as mean ± sD (n=3).
Abbreviations: Pcl, poly(ε-caprolactone); PDI, polydispersity index; Pecl, Peg–Pcl; Peg, poly(ethylene glycol); sD, standard deviation; sV, simvastatin; Tc, tetracycline.
International Journal of Nanomedicine downloaded from https://www.dovepress.com/ by 118.70.13.36 on 23-Aug-2020
Dovepress study of a new bone-targeting titanium implant–bone interface
A side view of the TNTs (Figure 3D2) indicates that the thick-ness of the TNT layer is ~400 nm. Compared to our previous study, the diameters of the TNTs were increased to 100–120 nm to load the micelles, which exhibit diameters of ~80 nm, more effectively. The SEM image of the TNT loaded with SV-loaded TC–PECL micelles is shown in Figure 3E1, which illustrates that the TNT pores were covered by granular drug deposits. An image of the TNT loaded with SV-loaded PECL micelles is shown in Figure 3E2, showing that the TNT pores were covered by drug sediments gathering together into flakes.
cytological tests
FaM-sirNa transfection test
Visualization of micelle cellular uptake was obtained through FAM-siRNA transfection. As shown in Figure 4, the overlaid microscopy images of treated cells indicated that the FAM-siRNA appeared as green fluorescence inside the cells. At the earliest, SVTCPM with electrostatic adhesion
of FAM-siRNA fluorescence achieved entry into the cells at the 2 h time point. At 3 h, the fluorescence associated with NT-SVTCPM had entered the cells, whereas in SVPM and NT-SVPM, intracellular fluorescence was observed for the first time at the 6 h time point, at which time the fluorescence intensity for SVTCPM and NT-SVTCPM reached its highest levels. At 12 h, the fluorescence intensity in NT-SVTCPM and NT-SVPM was reduced because of fluorescence quench-ing effects; a small amount of fluorescence was also observed inside the cells in the BK group at this time because of cell phagocytosis. Therefore, the fluorescence entry into the cells in the SVTCPM and NT-SVTCPM groups occurred earlier and faster than in the SVPM and NT-SVPM groups.
cytoskeletal arrangement and early cell adhesion
cytoskeletal arrangement
The results of immunofluorescence staining of rat osteoblasts cultured on the surfaces of Ti samples are shown in Figure 5.
7LPHK
7LPHK
&XPXODWLYHUHOHDVH
+\GUR[\DSDWLWHELQGLQJUDWH
69
7&±3(&/PLFHOOH 3(&/PLFHOOH
%
&
7&±3(&/PLFHOOH
$
'
(
' '
( (
QP QP
QP QP
QP QP
3(&/PLFHOOH
K K K K K K
7&±3(&/PLFHOOH 3(&/PLFHOOH
Ú Ú
Ú Ú
Ú Ú
Figure 3 Images and graphs for properties of micelles and TNT.
Notes: (A) TeM images of sV-loaded micelles including Tc–Pecl and Pecl micelles (15,000× magnification). (B)In vitro drug release profile of SV-loaded TC–PECL micelles, sV-loaded Pecl micelles, and free sV. (C) hydroxyapatite-binding rate of Tc–Pecl and Pecl micelles. Data are expressed as mean ± standard error of the mean (n=3), P,0.05 indicates significance vs the PECL micelle. (D) Field-emission seM images of the morphology of TNTs: D1, top view of the nanotubular surface showing
a tube diameter of ~100–120 nm (50,000× magnification); D2, cross-sectional view of a mechanically fractured sample showing that the length of the tubes is ~400 nm (30,000× magnification). (E) Field-emission seM images of the morphology of TNTs loaded with micelles (30,000× magnification): E1, image of the TNT loaded with SV-loaded Tc–Pecl micelles; e2, seM image of the TNT loaded with sV-loaded Pecl micelles.
Abbreviations: Pcl, poly(ε-caprolactone); Pecl, Peg–Pcl; Peg, poly(ethylene glycol); seM, scanning electron microscopy; sV, simvastatin; Tc, tetracycline; TeM, transmission electron microscopy; TNT, titania nanotube.
International Journal of Nanomedicine downloaded from https://www.dovepress.com/ by 118.70.13.36 on 23-Aug-2020
Dovepress
liu et al
Actin, which is the major cytoskeleton protein around the blue nuclei, was stained red. After 2 h of incubation, most of the cells on the NT-SVTCPM and NT-SVPM surfaces had spread and acquired a bipolar, tripolar, or multipolar shape, accompanied by bundling of the actin filaments; whereas on the NT and on the PT surface, most or just a small fraction of the cells, respectively, had begun to spread accompanied by the presence of sparse filopodia (Figure 5A1–D1). At 6 h after seeding (Figure 5A2–D2), the cells on the NT-SVTCPM and NT-SVPM surfaces had extended into a triangular or polygo-nal shape; simultaneously, the actin filaments that had been organized in well-defined stress fibers were mostly arranged along the major cellular axis. In contrast, on the NT and PT surfaces, most of the cells had spread into spindle, triangular, or polygonal shapes, wherein the actin was organized along the spreading direction and had formed a number of filopodia. As shown in Figure 5A3–D3, by 12 h, cells on the different surfaces were well extended. After 24 h of incubation, cells on the different surfaces had spread out to a flat shape and stacked together (Figure 5A4–D4). Therefore, compared to the NT and PT surfaces, cell spreading on the NT-SVTCPM and NT-SVPM surfaces was more rapid.
early cell adhesion
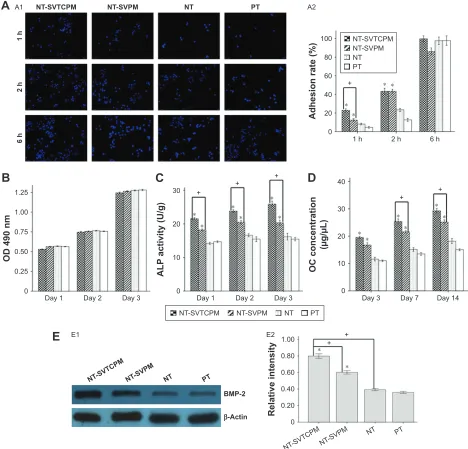
As presented in Figure 6A1, blue nuclei were directly counted on different fluorescently stained images at 126× magnifi-cation. Next, the adhesion rates of the different cells were calculated to compare the attachment of cells on different surfaces over a 6 h period, as shown in Figure 6A2. Observa-tions after 1, 2, or 6 h of incubation indicated that the adhe-sion rate of cells on the NT-SVTCPM, NT-SVPM, NT, and PT surfaces gradually increased over time (P,0.05). At 1 h after seeding, the adhesion rate of the cells on NT-SVTCPM was the highest followed by NT-SVPM among the different surfaces (P,0.05). At 2 h after seeding, a higher adhesion rate was observed for cells on the SVTCPM and NT-SVPM surfaces than on the NT and PT surfaces (P,0.05). No difference in the adhesion rate among the NT-SVTCPM, NT-SVPM, NT, and PT surfaces was observed after 6 h of incubation (P.0.05).
cell proliferation
Cell proliferation was evaluated by the MTS assay; the results are shown in Figure 6B. No significant difference in the proliferative activity of cells was observed among
Figure 4 Overlaid microscopy images of rat osteoblasts subjected to FaM-sirNa transfection in NT-sVTcPM, NT-sVPM, sVTcPM, sVPM, and BK groups at 2, 3, 6, and 12 h after incubation (the sirNas appear as green signals). 12.6× magnification.
Abbreviations: BK, blank; NT-sVPM, TNTs loaded with sV-loaded Pecl micelles; NT-sVTcPM, TNTs loaded with sV-loaded Tc-grafted Pecl micelles; Pcl, poly(ε-caprolactone); Pecl, Peg–Pcl; Peg, poly(ethylene glycol); sV, simvastatin; Tc, tetracycline.
17697&30
K
K
K
K
176930 697&30 6930 %.
International Journal of Nanomedicine downloaded from https://www.dovepress.com/ by 118.70.13.36 on 23-Aug-2020
Dovepress study of a new bone-targeting titanium implant–bone interface
the groups at 1, 2, and 3 days of incubation (P.0.05). The proliferative activities of cells on the NT-SVTCPM, NT-SVPM, NT, and PT surfaces increased over time with significant differences among 1, 2, and 3 days after seeding (P,0.05).
alP activity
ALP activity was determined to detect the early differentia-tion of cells on the different surfaces. As shown in Figure 6C, at 1, 2, and 3 days after seeding, the cells on the NT-SVTCPM surface demonstrated the highest ALP activity, followed by those on the NT-SVPM surface (P,0.05). No significant
differences were found between the NT and PT surfaces (P.0.05). The ALP activity of cells on the NT-SVTCPM surfaces at 3 days after seeding were higher than that at 1 day after seeding (P,0.05), whereas no significant differences were found among different times on the NT-SVPM, NT, or PT surfaces (P.0.05).
Oc concentration
The OC concentration is shown in Figure 6D. At 3 days after seeding, the cells on the NT-SVTCPM and NT-SVPM surfaces exhibited higher OC concentrations than those on the NT and PT surfaces (P,0.05). At 7 and 14 days after
Figure 5 cytoskeleton morphology as determined by clsM of rat osteoblasts inoculated on NT-sVTcPM, NT-sVPM, NT, and PT surfaces at 2, 6, 12, and 24 h after seeding (a1–D1, a2–D2, a3–D3, a4–D4, respectively; scale bars =20 μm; 63× magnification).
Abbreviations: clsM, confocal laser scanning microscopy; NT, uncoated TNTs; NT-sVPM, TNTs loaded with sV-loaded Pecl micelles; NT-sVTcPM, TNTs loaded with sV-loaded Tc-grafted Pecl micelles; Pcl, poly(ε-caprolactone); Pecl, Peg–Pcl; Peg, poly(ethylene glycol); PT, polished Ti; sV, simvastatin; Tc, tetracycline; Ti, titanium.
17697&30 176930
K
K
K
K
17 37
$ % & '
$ % & '
$ % & '
$ % & '
P
P
P P P P
P P
P
P P P P
P P P
International Journal of Nanomedicine downloaded from https://www.dovepress.com/ by 118.70.13.36 on 23-Aug-2020
Dovepress
liu et al
Figure 6 The cytological results on different surfaces.
Notes: (A) early adhesion: a1, stained nuclei of rat osteoblasts adhered to NT-sVTcPM, NT-sVPM, NT, and PT surfaces; a2, early adhesion rate of rat osteoblasts on NT-sVTcPM, NT-sVPM, NT, and PT surfaces at 1, 2, and 6 h after seeding. 12.6× magnification. (B) Proliferation of rat osteoblasts on NT-sVTcPM, NT-sVPM, NT, and PT surfaces at 1, 2, and 3 days after seeding. (C) alP activity of rat osteoblasts on NT-sVTcPM, NT-sVPM, NT, and PT surfaces at 1, 2, and 3 days after seeding. (D) Oc concentration of rat osteoblasts on NT-sVTcPM, NT-sVPM, NT, and PT surfaces at 3, 7, and 14 days after seeding. (E) Western blots of BMP-2 protein expression: e1, Western blots of BMP-2 protein expression in rat osteoblasts after 48 h of culture on NT-sVTcPM, NT-sVPM, NT, and PT surfaces, the β-actin band served as the calibration band; e2, the relative intensity of BMP-2 expression after 48 h of culture on NT-sVTcPM, NT-sVPM, NT, and PT surfaces. Data in (A), (B), (C), and (D) are expressed as mean ± standard error of the mean (n=4). Data in (E) are expressed as mean ± standard error of the mean (n=3), *P,0.05 indicates significance vs PT, +P,0.05 indicates significance.
Abbreviations: alP, alkaline phosphatase; BMP, bone morphogenetic protein; NT, uncoated TNTs; NT-sVPM, TNTs loaded with sV-loaded Pecl micelles; NT-sVTcPM, TNTs loaded with sV-loaded Tc-grafted Pecl micelles; Oc, osteocalcin; OD, optical density; Pcl, poly(ε-caprolactone); Pecl, Peg–Pcl; Peg, poly(ethylene glycol); PT, polished Ti; sV, simvastatin; Tc, tetracycline; Ti, titanium.
$
(
5HODWLYHLQWHQVLW\
17697&3 0
17693
0 17 37
(
17697&30 176930 17 37
%03
β$FWLQ
(
'D\
2'QP
'D\ 'D\
$/3
DFWLYLW\8J
'D\ 'D\ 'D\
'D\ 'D\ 'D\
2&FRQFHQWUDWLRQ
J/
%
&
'
17697&30 176930 17 37
17697&30 176930 17 37
K
K
K
$
K
$GKHVLRQUDWH
K K
17697&30 176930 17 37 $
seeding, the cells on the NT-SVTCPM surface demonstrated the highest OC concentration, followed by those on the NT-SVPM surface (P,0.05). The OC concentrations of cells on the NT-SVTCPM and NT-SVPM surfaces increased over time with significant differences among 1, 2, and 3 days after seeding (P,0.05).
BMP-2 expression in rat osteoblastsin vitro
The protein expression level of BMP-2 in the rat osteoblasts cultured on different surfaces at 2 days after seeding was determined by Western blot analysis. The photodensity scanning profiles of SDS-polyacrylamide gel electropho-resis (PAGE) for BMP-2 (Figure 6E1) indicate that the
International Journal of Nanomedicine downloaded from https://www.dovepress.com/ by 118.70.13.36 on 23-Aug-2020
Dovepress study of a new bone-targeting titanium implant–bone interface
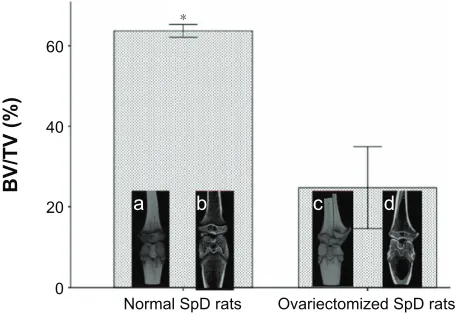
Figure 7 m-cT analysis of normal and ovariectomized rats before implantation.
Notes: BV/TV for the tibia compartment in the knee joint was used to identify relative changes in BV density. Data are expressed as mean ± standard error of the mean (n=3), *P,0.05 indicates significance vs PT: a, complete 3D image in the knee joint of a normal rat; b, coronal 3D screenshot in the knee joint of an ovariectomized rat; c, complete 3D image in the knee joint of an ovariectomized rat; d, coronal 3D screenshot in the knee joint of an ovariectomized rat.
Abbreviations: 3D, three-dimensional; BV, bone volume; m-cT, microcomputed tomography; PT, polished Ti; spD, sprague Dawley; Ti, titanium; TV, total volume.
1RUPDO6S'UDWV
%979
2YDULHFWRPL]HG6S'UDWV
D E F G
greatest photodensity was shown in the NT-SVTCPM group and the second highest photodensity was shown in the NT-SVPM group (P,0.05). The densitometry values of the BMP-2 bands normalized to the β-Actin bands are shown in Figure 6E2. The protein expression of BMP-2 in the NT-SVTCPM group was the highest, followed by that in the NT-SVPM group (P,0.05). There was no difference between the NT and BK groups (P.0.05).
In vivo tests
m-cT analysis
This study examined whether the SVTCPM and NT-SVPM surfaces influenced local bone regeneration and osseointegration on a wall of bone defect at the implant site in the middle tibia of the normal and ovariectomized rat models. m-CT analysis of the three ovariectomized animals sacrificed at 14 weeks after ovariectomy (equivalent to the time of implant surgery) showed significantly lower BV/TV ratio when compared to three animals that had not undergone ovariectomy, confirming that the osteoporosis animal model had been successfully created (Figure 7). In both normal and ovariectomized models, NT-SVTCPM, NT-SVPM, NT, and PT implants were inserted into the site of a one-wall bone defect in the tibia. For in vivo implantation in normal rats, a 1-month period was allowed for complete healing, whereas a 2-month period was allowed for ovariectomized rats.
m-CT analysis was carried out for the structural assess-ment of new bone formation at the implantation site and the quantitative assessment of BV density postimplantation near the implantation site. The BV/TV ratio was used to identify relative changes in BV density after implantation in normal and ovariectomized rats. 3D and two-dimensional (2D) m-CT images showed the integral and a cross-section of the morphology of bone formation, respectively, around the implants on different days.
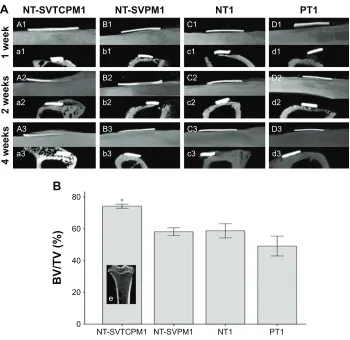
As shown in Figure 8A, the m-CT images for normal rats clearly demonstrated new bone formation around the implant site in a time-dependent manner after implantation. At the first week postimplantation, different degrees of new bone formation connecting the implant inner surface and the defect undersurface were observed, in which the NT-SVTCPM1 implant exhibited the tightest anchorage. At 2 weeks post implantation, images showed that the new bone forma-tion partly overlaid the outer surface of the NT-SVTCPM1 implant only, with more new bone was observed connecting the implant inner surface and the defect undersurface in the other three groups. At 4 weeks postimplantation, the images showed thick new bone formation overlaying all of the outer
surface of the NT-SVTCPM1 implant; in particular, the 2D images showed new bone surrounding the two surfaces and two ends of the implant. In comparison, in the other three groups, the 2D images illustrated that new bone surrounded the inner surface and one end of the implant. As shown in Figure 8B, the BV/TV ratio in the NT-SVTCPM1 group was higher than that in the PT1 group (P,0.05), indicating the significant increase in BV density in the NT-SVTCPM1 group. No differences were observed among the NT-SVPM1, NT1, and PT1 groups (P.0.05).
In the m-CT images of the ovariectomized rats, the formation of new bone around the implant site in a time-dependent manner after implantation was only observed in the NT-SVTCPM2 group and the successful anchorage of the implant was not apparent until 4 weeks postimplanta-tion. Furthermore, thin new bone formation almost overlaid the outer surface until 8 weeks postimplantation (Figure 9A [A1–A3, a1–a3]). In the NT-SVPM2 group, only a small amount of new bone tissue connecting some part of the implant inner surface and the defect undersurface was observed (Figure 9A [B1–B3, b1–b3]), whereas no new bone was found between the implant and the defect undersurface in the NT and PT groups. At 8 weeks postimplantation for the ovariectomized rats, as shown in Figure 9B, the BV/TV ratio in the NT-SVTCPM2 group was higher than that in the PT group (P,0.05), which indicated the significant increase in BV density in the NT-SVTCPM2 group. No significant differences among the NT-SVPM2, NT2, and PT2 groups were observed (P.0.05).
International Journal of Nanomedicine downloaded from https://www.dovepress.com/ by 118.70.13.36 on 23-Aug-2020
Dovepress
liu et al
Figure 8 The results of m-cT analysis in normal rats (1).
Notes: (A) m-cT images for implant–bone integration around the implant site for implants with NT-sVTcPM, NT-sVPM, NT, and PT surfaces in normal rats at 1, 2, and 4 weeks after implantation (a1–D1, a2–D2, and a3–D3 for the sagittal view of complete 3D images; a1–d1, a2–d2, and a3–d3 for cross-sectional 2D screenshots). (B) BV/ TV for the tibia compartment in the knee joint near the implant site in normal rats at 4 weeks after implantation. Data are expressed as mean ± standard error of the mean (n=3), *P,0.05 indicates significance vs PT; e, coronal 3D screenshot for the tibia compartment in the knee joint near the implant site in normal rats.
Abbreviations: 2D, two dimensional; 3D, three dimensional; BV, bone volume; m-cT, microcomputed tomography; NT, uncoated TNTs; NT-sVPM, TNTs loaded with sV-loaded Pecl micelles; NT-sVTcPM, TNTs loaded with sV-loaded Tc-grafted Pecl micelles; Pcl, poly(ε-caprolactone); Pecl, Peg–Pcl; Peg, poly(ethylene glycol); PT, polished Ti; sV, simvastatin; Tc, tetracycline; Ti, titanium; TV, total volume.
%
H
17697&30 176930 17 37
%979
17697&30
$
ZHHN
ZHHNV
ZHHNV
176930 17 37
$ % & '
D E F G
$ % & '
D E F G
$ % & '
D E F G
Figure 9 The results of m-cT analysis in ovariectomized rats (2).
Notes: (A) m-cT images for implant–bone integration around the implant site for implants with NT-sVTcPM and NT-sVPM surfaces in ovariectomized rats at 2, 4, and 8 weeks after implantation (a1–B1, a2–B2, and a3–B3 for a sagittal view of complete 3D images; a1–b1, a2–b2, and a3–b3 for cross-sectional 2D screenshots). (B) BV/TV for the tibia compartment in the knee joint near the implant site in ovariectomized rats at 8 weeks after implantation. Data are expressed as mean ± standard error of the mean (n=3), *P,0.05 indicates significance vs PT; c), coronal 3D screenshot for the tibia compartment in the knee joint near the implant site in ovariectomized rats.
Abbreviations: 2D, two dimensional; 3D, three dimensional; BV, bone volume; m-cT, microcomputed tomography; NT, uncoated TNTs; NT-sVPM, TNTs loaded with sV-loaded Pecl micelles; NT-sVTcPM, TNTs loaded with sV-loaded Tc-grafted Pecl micelles; Pcl, poly(ε-caprolactone); Pecl, Peg–Pcl; Peg, poly(ethylene glycol); PT, polished Ti; sV, simvastatin; Tc, tetracycline; Ti, titanium; TV, total volume.
17697&30
ZHHNV
ZHHNV
ZHHNV
176930
$
$
$
% %
E
E
E D
D D
%
17697&30 17
6930 17 37
%979
F
$
%
International Journal of Nanomedicine downloaded from https://www.dovepress.com/ by 118.70.13.36 on 23-Aug-2020
Dovepress study of a new bone-targeting titanium implant–bone interface
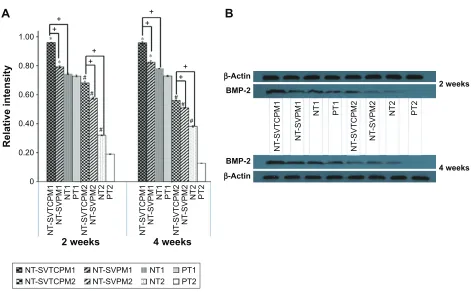
Figure 10 The results of Western blots of BMP-2 protein expression.
Notes: (A) Western blots of BMP-2 protein expression in the bone tissue around implants with NT-sVTcPM, NT-sVPM, NT, and PT surfaces in normal (1) and ovariectomized (2) rats at 2 and 4 weeks after implantation. The β-actin band was used as the calibration band. (B) relative intensity of BMP-2 protein expression in the bone tissue around implants with NT-sVTcPM, NT-sVPM, NT, and PT surfaces in normal and ovariectomized rats at 2 and 4 weeks after implantation. Data are expressed as mean ± standard error of the mean (n=3), *P,0.05 indicates significance vs PT, #P,0.05 indicates significance vs PT in ovariectomized rats, +P,0.05 indicates significance.
Abbreviations: BMP, bone morphogenetic protein; NT, uncoated TNTs; NT-sVPM, TNTs loaded with loaded Pecl micelles; NT-sVTcPM, TNTs loaded with sV-loaded Tc-grafted Pecl micelles; Pcl, poly(ε-caprolactone); Pecl, Peg–Pcl; Peg, poly(ethylene glycol); PT, polished Ti; sV, simvastatin; Tc, tetracycline; Ti, titanium.
17 37
17
697&30
β$FWLQ %03
β$FWLQ %03
17
6930
17
697&30 176930
17 37
ZHHNV
ZHHNV
17
697&30 176930 17 37
17
697&30 176930 17 37
17
697&30 176930 17 37
17
697&30 176930 17 37
ZHHNV
5HODWLYHLQWHQVLW\
ZHHNV
17697&30 176930 17 37
17697&30 176930 17 37
$
%
BMP-2 protein expression in the rat
osteoblastsin vivo
The protein expression levels of BMP-2 in the rat osteoblasts obtained from the bone tissue around the implants in the different groups at 2 and 4 weeks postimplantation in vivo were determined by Western blot analysis. The photodensity scanning profiles of SDS-PAGE for BMP-2 (Figure 10A) indicate that there were significant differences between normal and ovariectomized rats at both 2 and 4 weeks postimplantation. Among the different normal rat groups, the greatest photodensity was shown in the NT-SVTCPM1 group; similarly, the highest photodensity among the ovariec-tomized rat groups was shown in NT-SVTCPM2 (P,0.05). The BMP-2 band density values normalized to those of
β-Actin are represented in Figure 10B. BMP-2 expression in the NT-SVTCPM1 and NT-SVTCPM2 groups was the highest among the different groups for the normal and ova-riectomized rats, respectively (P,0.05). Among the normal rat groups, BMP-2 expression in the NT-SVPM1 group was higher than that in the PT group (P,0.05), whereas there was no difference between that in the NT-SVPM1 and NT1 groups (P.0.05).
Discussion
In this study, TC-grafted SV-loaded polymeric micelles were prepared and loaded in TNT arrays to develop a dual-controlled, local, bone-targeting delivery system, and this system was implanted in vivo to develop a bone-targeting Ti implant–bone interface. In vitro and in vivo testing dem-onstrated good biological effects of the local bone-targeting delivery system; in particular, improvements in local bone regeneration and osseointegration in normal and postmeno-pausal osteoporosis models were highlighted in the bone-targeting Ti implant–bone interface.
First, the TC-grafted polymer was successfully synthe-sized as all of the expected molecular characteristics were observed in the 1H-NMR spectra, which indicated that the
carboxyl group of PECL had conjugated with the hydroxyl group of TC. Second, TC-grafted SV-loaded polymeric micelles were prepared, and the in vitro release experi-ment indicated that they could provide a sustained release of SV and that the TC graft could be considered to have no effect on drug release. The results of hydroxyapatite binding assay indicated that after grafting, TC was able to maintain its affinity for hydroxyapatite and that, in addition,
International Journal of Nanomedicine downloaded from https://www.dovepress.com/ by 118.70.13.36 on 23-Aug-2020