c
Owned by the authors, published by EDP Sciences, 2015
When do interfaces become important for failure?
S.J. Fensin1,a, E.K. Walker1,2, E.K. Cerreta1, and G.T. Gray III1 1Los Alamos National Laboratory, Los Alamos, NM 87544, USA
2School of Materials Engineering, Purdue University, West Lafayette, IN 47907, USA
Abstract. Previous experimental research has shown that microstructural features such as interfaces, inclusions, vacancies and heterogeneities can all act as void nucleation sites. However, it is not well understood how important these interfaces are to the damage evolution as a function of the surrounding parent materials. In this work, we present results on three different materials: 1) Cu, 2) Cu-10 wt%Ag, and 3) Cu-15 wt%Nb examined to probe the influence of bi-metal interfaces on void nucleation and evolution. These materials were chosen due to the differences in the stacking fault energy between the two phases. The initial results suggest that when there are significant differences between the bulk properties (for example: stacking fault energy and melting temperature etc) the type of interface between the two parent materials does not influence the damage process. Rather, it is the “weaker” material that dictates the dynamic spall strength of the material.
1. Introduction
Multi-phase alloys are one class of materials that are widely utilized in modern engineering applications. The two-phase nature of such engineering alloys is balanced to enhance the best properties of each phase. For example, strength from one and ductility from the other. In this work, we consider two Cu matrices with a small amount of a softer (Ag) and a harder second phase (Nb), respectively. The aim of this study is to not only understand the role of a second phase in void nucleation and growth but also to investigate conditions (soft/soft vs. soft/hard) under which interfaces between the two phases are not important to the damage evolution and failure process. In addition, we are also interested in studying the mechanisms and how they change when the bi-metal interface changes from FCC/FCC to FCC/BCC.
In the past, extensive research has focused on understanding the dynamic fracture response of both metals and alloys, especially in cases where the second phase additions are stiffer than the primary metallic phase. In the case of single-phase ductile materials, it is widely accepted that microstructure affects the response of a material to dynamic loading [1–7]. For example, experiments by Kanel et al. [8] on high-purity copper indicate that the onset stress for dynamic fracture (i.e. spall strength) of single-crystal copper is two to three times higher than that of polycrystalline copper. This observation suggests that the threshold stress for void nucleation at a grain boundary (GB) might be significantly lower than for nucleation at other defects like dislocation cell walls [8]. Recent experiments by Escobedo et al. [9] on polycrystalline Cu additionally demonstrate that certain special (3) boundaries are more resistant to void nucleation during dynamic loading. This work also corroborates the experimental results of Wayne et al.
aCorresponding author:[email protected]
[10] on Cu, which shows that boundaries with certain misorientations are preferred locations for intergranular damage. These results collectively suggest that the types of grain boundaries in a sample can strongly influence the amount and location of damage in a material during dynamic loading. However, less is understood about this effect under conditions of two-phase boundaries or at bimetallic interfaces.
In contrast, work by Minich et al. [5] on two phase materials like single crystal copper with SiO2 inclusions
shows that the presence of small, hard SiO2 precipitates
lowers the stress required to nucleate voids in this material as compared to that for pure Cu. Similarly, work by Christy et al. [11] that studies inclusions present at a grain boundary in Cu, reveals that voids prefer to nucleate at these inclusions along the grain boundaries. Gray et al. [12] show an interface dependence of this phenomena based on the response of aluminum with alumina inclusions and within a Cu/Nb material. The spall strength of the Al/Al2O3system is found to be lower than
that of pure aluminum and is highly dependent on the volume fraction of inclusions and their specific particle morphology. On the other hand, the spall strength of a Cu/Nb system remains unchanged by the presence of 15 vol % Nb particles embedded in the Cu matrix in comparison to high purity copper. Although these and other experimental observations show that the presence of a second phase can impact the spall strength of a material, the specific mechanisms behind damage nucleation and its evolution in these two-phase materials remain poorly understood.
To thoroughly understand the role of bi-metal or metal/inclusion interfaces on damage behavior, we have conducted a series of systematic plate impact experiments on Cu-10 wt%Ag and Cu-15 wt%Nb. These results have been compared with similar experiments performed on high-purity Cu. The remainder of this paper is organized as
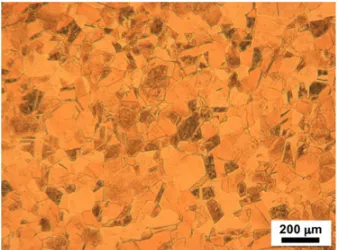
Figure 1. Optical image showing the equiaxed grain structure of
the annealed high purity Cu.
follows. The next section discusses the details of the plate-impact experiments and resulting analysis undertaken in this study. The results and conclusions are presented in Sects. III and IV, respectively.
2. Experimental methodology
In this section, we outline the materials, as well as experimental and analytical approaches utilized in this investigation.
2.1. Initial material characterization
The target materials were prepared from 1) high purity annealed Cu, 2) annealed Cu-Ag alloy with 10 wt%Ag and 3) Cu-Nb alloy with 15 wt%Nb. It is important to note that the CuNb was not heat treated in this case.
The microstructure of the annealed specimens was examined with optical microscopy using a Zeiss mi-croscope. It was difficult to obtain EBSD data for the CuAg and CuNb alloys due to their two-phase nature. Standard metallographic techniques were used to prepare samples for inspection. For all samples, a final polish of 1µm Al2O3 was followed by vibratory polishing using a
solution of 0.04µm colloidal silica. The Cu samples were lightly etched using a solution of FeCl3and HCl whereas
the CuAg and CuNb samples were not etched.
Figure 1 shows an optical image for the high-purity Cu. This micrograph shows that Cu has equiaxed grains with an average grain size of 60µm, whereas Fig.2shows the optical micrographs for CuAg and CuNb. In contrast to pure Cu, CuAg has a eutectic microstructure with a small effective grain size (typical for eutectic materials) and Nb is present in precipitate form in the Cu matrix in the CuNb material. Even though the initial microstructures for these materials are different, phenomenological comparison of the locations for void nucleation is made to determine the role of a second phase in void nucleation and growth processes.
2.2. Plate impact experiments
A plate impact experiment was conducted using a 80-mm bore gas launcher and soft-recovery techniques as shown using the configuration in Fig. 3 [13]. An impactor of Cu was accelerated using an 80 mm bore gas gun at a velocity of 190 m/s and impacted onto the Cu, CuAg and
Figure 2. Optical images showing the initial microstructure of
Cu-10%Ag (top) and Cu-15%Nb (bottom), respectively. In the top image the white regions show silver and the grey particles in the bottom image depict Nb.
Figure 3. Experimental configuration used to produce incipient
damage or complete spall in three samples simultaneously. Copper impactors were accelerated in an 80 mm gas gun and impacted onto the target. PDV probes were placed over the center of each sample to provide free-surface velocimetry data from each sample in each experiment.
CuNb targets. The impactor was roughly 1.29 mm thick. The target consisted: a target plate with three samples, and a momentum ring for the whole target. Targets were 2.59 mm thick and designed specifically such that recovery of the shocked samples was facilitated for post-mortem examination. The momentum rings were press-fit into the target plate to ensure intimate contact of all the components. For the three-sample targets, samples were machined as right, regular cylinders 12.7 mm in diameter. In the experiment, the impactor thickness was one-half the sample thickness to cause tensile damage to occur in the center of the sample thickness. A single momentum trapping ring made out of Cu surrounded the whole assembly. This was done because the sample diameters were large such that the sample had ample time to release before the edge waves came back to the sample. Placement of the samples in the target ring were set such that the shortest distance between sample edges to each other and to the edge of the target plate were equal.
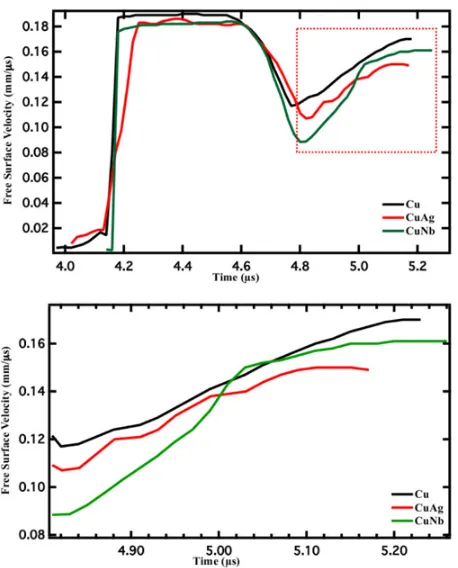
Figure 4. (Top) traces of the free surface velocity showing shock
loading for Cu, CuAg and CuNb experiments. (Bottom) free surface velocity rise after the minima.
[14,15]. Collimated probes provided by AC Photonics (Part #: 1CL15P020LC-C01) were positioned to collect velocimetry data from the center of each sample and connected to a LANL-built 4-channel PDV system. One additional PDV probe (not shown in figure) was placed next to each target plate to measure the projectile velocity directly to an accuracy of 0.1% [15]. A single PZT trigger pin (Dynasen, Inc.) was also positioned next to each target plate with a typical standoff distance of a few millimeters to provide a trigger to the digitizer used to collect the PDV data. Following impact, all samples were “soft recovered” by decelerating them into low-density foam.
2.3. Postimpact metallurgical characterization
Subsequent characterization of the damage in the spalled samples included both optical microscopy. In preparation for the optical analyses, each recovered specimen was diametrically sectioned. They were subsequently mounted in an epoxy resin and prepared following standard metallographic techniques as listed above in Sect. 2.1.
3. Results
3.1. Free surface velocity analysis
Free surface velocity (FSV) profiles provide in-situ information regarding the motion of shock waves in a sample and can be used to infer the stresses and kinetics associated with void nucleation and growth. Figure 4 shows the FSV histories for the incipient spall experiments on Cu, CuAg and CuNb.
Table 1. Parameters used to calculate peak stress and spall
strength. Parameters for CuAg and CuNb were calculated through using a weighted average of the individual parameters for each component.
Experiment ρ CB CL s γ h
(g/cm3) (mm/µs) (mm/µs) (mm)
Cu 8.924 3.94 4.72 1.489 1.96 1.08 CuAg 9.081 3.87 4.72 1.495 1.96 0.43 CuNb 8.873 4.02 4.77 1.445 1.96 1.06
The wave profiles for the three materials are seen to display a number of features: 1) Lack of elastic-plastic transitions, or Hugoniot Elastic Limits (HEL’s), as seen in the loading portion of the profile, 2) CuAg has a different slope in the loading part of the velocity profile. This could be related to non-uniform dissipation of energy through plasticity which is further related to the higher propensity of Ag to undergo extensive deformation twinning, 3) Constant responses upon the peak stress on the Hugoniot suggestive of uniform plastic deformation with all the samples, 4) Upon release all profiles exhibit a classic pull-back signal and ringing, which generally is associated with spall or dynamic fracture in the sample. However, there are different magnitude of the “pull-back” signal quantified by
FSV suggesting different damage nucleation responses in the materials and 5) Similar slopes for the free surface velocity rise for Cu and CuAg are observed. These slopes are different from the one observed in CuNb which shows two different slopes in this rise region.
Due to the different composition of the materials, the peak free surface velocities are 0.187, 0.182, 0.182 mm/µs in Cu, CuAg and CuNb, respectively. The corresponding average peak compressive stresses are 3.40, 3.31 and 3.35 GPa in Cu, CuAg and CuNb, respectively. These values are calculated using the Mie Gr ¨uneisen equation of state with parameters listed in Table1. Parameters for CuAg and CuNb were calculated by using a weighted average of the individual parameters for each component obtained from the LASL Hugoniot EOS database [16].
The spall strength (σspall), which is one measure of dynamic failure stress, is calculated using the relationship proposed by Novikov [17] and the correction proposed by Kanel [18]:
σspall ≡ 1
2ρoCB(F SV +δ), (1) whereρois the ambient density, CBis the bulk sound speed andF SV is the difference in the free surface velocity
from the peak state to the pull-back minima (Fig.4). The accuracy of the spall strength calculation is improved by correcting for theF SV in Eq. 1 [18]:
δ=h
1
CB
− 1
CL
∗| ˙u1∗˙u2|
| ˙u1|+˙u2
, (2)
where h is the thickness of the spalled region (measured from optical images), CL is the longitudinal sound speed, and ˙u1and ˙u2 are the unloading and re-compression rates
calculated as | ˙u1|=−1/2
d F SV
dt and ˙u2=1/2 d F SV
Table 2. Calculated and measured parameters from the FSV data.
Pull back characteristics
Shot FSV (mm/µs) ˙u1(mm/µs2) ˙u2(mm/µs2) δ(mm/µs) Average Spall Strength (GPa) Corrected Spall Strength (GPa)
Cu 69 0.39 0.148 0.0052 1.328 1.333
CuAg 74 0.37 0.155 0.0020 1.421 1.423
CuNb 94 0.49 0.284 0.0069 1.806 1.813
Here, d F SVdt is measured from the pullback signal as described in Ref. [19] and these values for the current experiments are listed in Table2. The unloading rates ˙u1
are indicators of the kinetics of the tensile pulse imposed on the target. These results (Table2) indicate that the CuNb experiences a faster tensile stress rate as compared to the Cu and CuAg.
The corrected spall strength values calculated using Eqs. (1), (2) and (3) are listed in Table.2. The data reveals that the spall strength of Cu increases with the addition of 10% Ag and 15 %Nb. Specifically, the spall strengths for CuAg and CuNb are 1.42 and 1.81 GPa, respectively. These values are 6% and 26% higher than the average spall strength for Cu. The slight increase in the spall strength of CuAg could be due to second phase hardening (not precipitate hardening) especially because in general silver has a slightly higher tensile strength in comparison to Cu [20]. In addition, the effective grain size in CuAg is much lower than Cu due to its eutectic microstructure and as such can increase the spall strength of the material. In contrast, increase in the spall strength of CuNb is related to precipitation hardening since Nb is dispersed through the matrix in the form of fine precipitate particles (Refer Fig.2). Also, Nb is much harder than both Cu and Ag and is an efficient barrier to dislocation motion. In general, the microstructures of these three materials differ to the extent that it would not be fair to do a one-to-one quantitative comparison. Nonetheless, the trends in spall strengths are reasonable.
In addition, differences are also observed in the rate at which the free surface velocity rises beyond the pull-back signal minima between the three samples. Specifically, the rate of increase is similar for Cu and CuAg (0.148 and 0.155 mm/µs2) but is 23% higher in CuNb (0.194 mm/µs2). In fact, the rise rate of CuNb can be divided into two parts; the first part rises faster (0.284 mm/µs2) and the second part is much flatter
(0.054 mm/µs2). This bi-linear pull-back slope in CuNb
is perhaps suggestive of differing energy partitioning during nucleation and growth of damage as compared to Cu and CuAg which display a linear “pull-back” signal.
3.2. Post-impact metallurgical examination
Even though the in-situ, FSV measurements provide insight into the stress history of the dynamically loaded materials, these continuum level measurements can only provide limited information regarding the specific details of the operative, internal damage evolution within a material. For this reason, metallographic characterization of the incipiently spalled samples was performed to gain insight into the relationship of damage evolution and
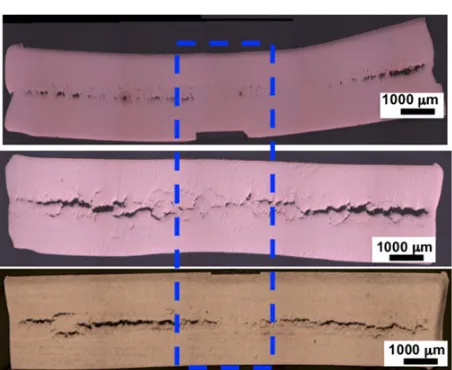
Figure 5. Optical micrographs of spalled high purity Cu,
Cu-10%Ag and Cu-15%Nb respectively. The spall plane is approximately located in the center of the samples except in the case of CuPb.
microstructure as a function of material and the imposed drive condition.
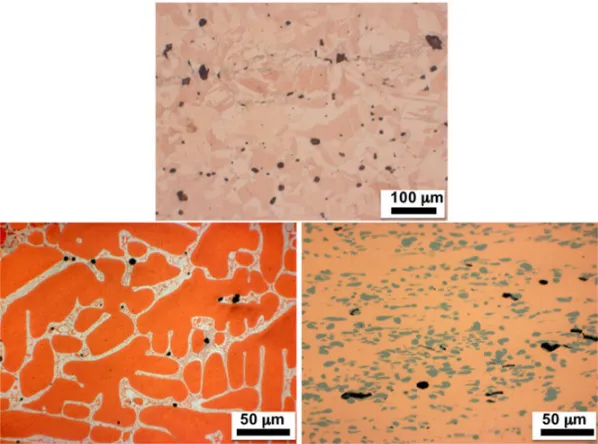
Figure 6. (Top) optical image for spalled Cu with black regions representing void. (Bottom right) optical image of spalled CuAg where
white regions represent silver and black regions are voids. (Bottom left) optical image of spalled CuNb where the grey particles are Nb and the black areas are voids.
makes it easier for the voids to coalesce. In CuNb, there is a larger number of coalesced voids in comparison to Cu but a lower number of coalesced voids in comparison to CuAg. This could be because even though it is much harder to nucleate voids in this material (highest spall strength) the rate of growth of these voids is the highest (highest slope for FSV rise) once damage is formed. However, since the microstructures are not exactly the same, other factors like texture and grain size could also be influencing these results.
Figure 6 shows higher magnification optical images of the spalled Cu, CuAg and CuNb. These images show that in Cu voids tend to nucleate at grain boundaries as previously observed [9] whereas in CuAg voids nucleate in Ag and in CuNb voids tend to be located on the Cu side of the Cu/Nb interface. Although, the majority of the voids in CuNb were too well developed to unambiguously determine their exact nucleation location. Despite the different microstructures, the phenomenological observations regarding the location for void nucleation appear reasonable.
4. Conclusions
In this research, we present the spallation response of three different materials: 1) Cu, 2) 10%Ag, and 3) Cu-15%Nb to investigate the influence of bi-metal interfaces on void nucleation and evolution. These materials were chosen due to the differences in crystallographic structure (FCC/FCC vs. FCC/BCC) and strength of the individual parent phases. Preliminary results indicate that the spall strength of Cu increases with the addition of Ag and Nb by 6% and 26%, respectively. This increase was attributed to the smaller effective grain size and precipitate hardening in CuAg and CuNb, respectively. The spall strength along
with the void growth rates (inferred from the rise in the FSV) were also used to determine that void nucleation was the dominant process for stress dissipation in Cu (lowest spall strength) whereas void growth was more dominant in CuNb (highest spall strength). In contrast, in CuAg, which has a slightly, higher spall strength and void growth rate than Cu, the small effective grain size of the microstructure dominated its spallation response. Most importantly the location for the void nucleation was observed to vary with material. In Cu, voids were observed to nucleate at grain boundaries, whereas in CuAg and CuNb voids nucleated in Ag (the softer phase) and on the Cu size of the Cu/Nb interface. As such, this work demonstrates that there are cases where bi-metal interfaces (Like in CuAg) do not control void nucleation in contrast to cases where interfaces can be important as shown in CuNb. In our future work, we plan to quantify the mechanisms that control void nucleation and growth in these materials using molecular dynamic simulations.
Los Alamos National Laboratory is operated by Los Alamos National Security, LLC, for the National Nuclear Security Administration of the U.S. Department of Energy under contract DE-AC52-06NA25396. This work was partially sponsored by the Joint DoD/DOE Munitions Technology Development Program.
References
[1] L. Seaman, D.R. Curran and D.A. Shockley, Phys. Today 30, 46–55 (1977)
[2] L. Seaman, D.R. Curran and D.A. Shockley, J. Appl. Phys. 47, 1414–26 (1976)
[4] D.R. Curran, L. Seaman and D.A. Shockley, Phys. Reports 147, 253–388 (1987)
[5] R.W. Minich, J. Cazamias, M. Kumar and A. Schwartz, Metall. Mater. Trans. A 35, 2663–73 (2004)
[6] R.W. Minich, M. Kumar, A. Schwartz and J. Cazamias, AIP Conf. Proc. 845, 642–45 (2006) [7] G.T. Gray III, Ann. Rev. Mater. Res. 42, 285–303
(2012)
[8] G.I. Kanel, S.V. Rasorenov and V.E. Fortov,
Shock Wave and High-Strain-Rate Phenomena
in Materials(Marcel Dekker, New York, NY
1992)
[9] J.P. Escobedo, D. Dennis-Kolle, E.K. Cerreta, B.M. Patterson, C.A. Bronkhorst, B.L. Hansen, D. Tonks and R.A. Lebensohn, J. Appl. Phys. 110, 033513 (2011)
[10] L. Wayne, K. Krishnan, S. DiGiacomo, N. Kovvali, P. Peralta, S.N. Luo, S. Greenfield , D. Byler, D. Paisley, K.J. McClellan, A. Koskelo and R. Dickerson, Scripta Mater. 63, 1065–68 (2010)
[11] S. Christy, H.R. Pak and M.A. Meyers, Metallurgical
Applications of Shock-Wave and High-Strain-Rate Phenomena (Marcel Dekker, New York, NY, 1986)
835
[12] R.S. Hixson, J.N. Johnson, G.T, Gray III and J.D. Price, AIP Conf. Proc. 370, 555–8 (1996)
[13] G.T. Gray III, ASM International 8, 530 (2000) [14] O.T. Strand, D.R. Goosman, C. Martinez, T.L.
Whitworth, W.W. Kuhlow, Rev. Sci. Instrum. 77, 083108 (2006)
[15] B.J. Jensen, D.B. Holtkamp, P.A. Rigg, D.H. Dolan, J. Appl. Phys. 101, 013523 (2007)
[16] S.P. Marsh, LASL Shock Hugoniot Data (University of California Press, 1980)
[17] S.A. Novikov, I.I. Divnov. and A.G. Ivanov, Phys. Met. Metallogr. 21, 122 (1966)
[18] G.I. Kanel, J. Appl. Mech. Tech. Phys. 42, 358 (2001) [19] J.P. Escobedo, E.N. Brown, C.P. Trujillo, E.K. Cerreta and G.T. Gray III, J. Appl. Phys. 113 (2013) [20] E.B. Zaretsky and G.I. Kanel, J. Appl. Phys. 110,