EVOLUTION I N MENDELIAN POPULATIONS
SEWALL WRIGHT University of Chicago. Chicago. Illinois
Received January 20. 1930
TABLE O F CONTENTS
Theoriesof evolution . . . 97
Variation of gene frequency . . . 100
Simple Mendelian equilibrium . . . 100
Mutation pressure . . . 100
Migration pressure . . . 100
Selection pressure . . . 101
Equilibrium under selection . . . 102
Multiple allelomorphs . . . 104
Random variation of gene frequency . . . 106
Rate of decrease in heterozygosis . . . 107
The population number . . . . . . 110
The distribution of gene frequencies and its immediate consequences . . . 111
PAGE No mutation. migration or selection Nonrecurrent mutation . . . Reversible recurrent mutation . . . Migration ... Irreversible recurrent mutation . . . Selection ... General formula . . . The distribution curves . . . . . . 111
. . . 116
. . . 121
. . . . . . 126
. . . 128
. . . . . . 129
. . . . . . 133
. . . . . . 134
Dominanceratio . . . 137
The mean and variability of characters . . . The evolution of Mendelian systems . . . Classification of the factors of evolution . . . Lability as the condition for evolution . . . 147
Controlof evolution . . . 151
Agreement with data of evolution . . . 153
“Creative” and “emergent” evolution . . . . . . 154
SUMMARY . . . . . . 155
LITERATURE CITED . . . . . . 158
THEORIES O F EVOLUTION
One of the major incentives in the pioneer studies of heredity and varia- tion which led to modern genetics was the hope of obtaining a deeper insight into the evolutionary process
.
Following the rediscovery of the Men- delian mechanism. there came a feeling that the solution of problems of evolution and of the control of the process. in animal. and plant breedingand in the human species, was a t last well within reach. There has been no halt in the expansion of knowledge of heredity but the advances in the field of evolution have, perhaps, seemed disappointingly small. One finds the subject still frequently presented in essentially the same form as before 1900, with merely what seems a rather irrelevant addendum on Mendelian heredity.
The difficulty seems to be the tendency to overlook the fact that the evolutionary process is concerned, not with individuals, but with the species, an intricate network of living matter, physically continuous in space-time, and with modes of response to external conditions which i t appears can be related to the genetics of individuals only as statistical consequences of the latter. From a still broader viewpoint (compare LOTKA
1925) the species itself is merely an element in a much more extensive evolving pattern but this is a phase of the matter which need not concern us here.
The earlier evolutionists, especially LAMARCK, assumed that the somatic effects of physiological responses of individuals to their environments were transmissible to later generations, and thus brought about a directed evo- lution of the species as a whole. The theory remains an attractive one to certain schools of biologists but the experimental evidence from genetics is so overwhelmingly against it as a general phenomenon as to render it unavailable in present thought on the subject.
DARWIN was the first to present effectively the view of evolution as pri- marily a statistical process in which random hereditary variation merely furnishes the raw material. He emphasized differential survival and fe- cundity as the major statistical factors of evolution. A few years later, the importance of another aspect of group biology, the effect of isolation, was brought to the fore by WAGNER. Systematic biologists have continued to insist that isolation is the major species forming factor. As with natural selection, a connection with the genetics of individuals can be based on statistical considerations.
There were many attempts in the latter part of the nineteenth century to develop theories of direct evolution in opposition to the statistical viewpoint. Most of the theories of orthogenesis (for example, those of
EIMER and of COPE) implied the inheritance of “ acquired characters.”
NAGELI postulated a slow but self contained developmental process within
EVOLUTION I N MENDELIAN POPULATIONS 99
tion or isolation, was indeed necessary to bring the new species into pre- dominance, but the center of interest, as with Lamarckism, was in the physiology of the mutation process.
The rediscovery of Mendelian heredity in 1900 came as a direct con- sequence of DE VRIES’ investigations. Major Mendelian differences were naturally the first to attract attention. It is not therefore surprising that the phenomena of Mendelian heredity were looked upon as confirming DE
VRIES’ theory. They supplemented the latter by revealing the possibili- ties of hybridization as a factor bringing about an extensive recombination of mutant changes and thus a multiplication of incipient species, a phase emphasized especially by LOTSY. JOHANNSEN’S study of pure lines was interpreted as meaning that DARWIN’S selection of small random varia- tions was not a true evolutionary factor.
A reaction from this viewpoint was led by CASTLE, who demonstrated the effectiveness of selection of small variations in carrying the average of a stock beyond the original limits of variation. This effectiveness turned out to depend not so much on variability of the principal genes concerned as on residual heredity. As genetic studies continued, ever smaller differ- ences were found to mendelize, and any character, sufficiently investigated, turned out to be affected by many factors. The work of NILSSON-EHLE, EAST, SHULL, and others established on a firm basis the multiple factor hy- pothesis in cases of apparent blending inheritance of quantitative variation. The work of MORGAN and his school securely identified Mendelian hered- ity with chromosomal behavior and made possible researches which fur- ther strengthened the view that the Mendelian mechanism is the general mechanism of heredity in sexually reproducing organisms. The only ex- ceptions so far discovered have been a few plastid characters of plants. That differences between species, as well as within them, are Mendelian, in the broad sense of chromosomal, has been indicated by the close paral- lelism between the frequently irregular chromosome behavior and the ge- netic phenomena of species crosses (FEDERLEY, GOODSPEED and CLAUSEN, etc.
>.
Most of DE VRIES’ mutations have turned out to be chromosomeaberrations, of occasional evolutionary significance, no doubt, in increas- ing the number of genes and in leading to sterility of hybrids and thus iso- lation, but of secondary importance to gene mutation as regards character changes. As to gene mutation, observation of those which have occurred naturally as well as of those which MULLER, STADLER, and others have recently been able to produce wholesale by X-rays, reveals characteris- tics which seem as far as possible from those required for a directly adaptive evolutionary process. The conclusion nevertheless seems warranted by
the present status of genetics that any theory of evolution must be based on the properties of Mendelian factors, and beyond this, must be con- cerned largely with the statistical situation in the species.
VARIATION OF GENE FREQUENCY
Simple Mendelian equilibrium
The starting point for any discussion of the statistical situation in Mendelian populations is the rather obvious consideration that in an indefinitely large population the relative frequencies of allelomorphic genes remain constant if unaffected by disturbing factors such as mutation, migration, or selection. If [(l -q)a+qA] represents the frequencies of two allelomorphs, (a, A) the frequencies of the zygotes reach equilibrium according to the expansion of [ ( l - q)a+qAI2 within a t least two genera- tions,' whatever the initial composition of the population (HARDY 1908). Combinations of different series are in equilibrium when these are com- bined a t random, but as WEINBERG (1909) and later, in more detail, ROBBINS (1918) have shown, equilibrium is not reached a t once but is ap- proached asymptotically through an infinite number of generations. Linkage slows down the approach to equilibrium but has no effect on the ultimate frequencies.
Mutation pressure
The effects of different simple types of evolutionary pressure on gene frequencies are easily determined. Irreversible mutation of a gene a t the rate U per generation changes gene frequency (9) a t the rate Aq = -uq. With reverse mutation a t rate v the change in gene frequency is Aq=
- uq +v( 1 - q). I n the absence of other pressures, an equilibrium is reached between the two mutation rates when A q = 0, giving q = v/(u +v).
Migration pressure
The frequency of a gene in a given population may be modified by mi-
gration as well as by mutation. As an ideal case, suppose that a large popu- lation with average frequency q,, for a particular gene, is composed of sub- groups each exchanging the proportion m of its population with a random sample of the whole population. For such a subgroup, Aq = - m(q - q,.).
The conditions postulated above are rather artificial since, in an actual species, subgroups exchange individuals with neighboring subgroups rather 1 This statement assumes that there is no overlapping of generations which may bring about
EVOLUTION I N MENDELIAN POPULATIONS 101 than with a random sample of the whole species and the change in q will be only a fraction of that given above. The fraction is the average degree of departure of the neighboring subgroups toward the population average. The formula may be retained by letting q, stand for the gene frequency of immigrants rather than of the whole species.
Selection pressure
Selection, whether in mortality, mating or fecundity, applies to the or- ganism as a whole and thus to the effects of the entire gene system rather than to single genes. A gene which is more favorable than its allelomorph in one combination may be less favorable in another. Even in the case of cumulative effects, there is generally an optimum grade of development of the character and a given plus gene will be favorably selected in combi- nations below the optimum but selected against in combinations above the optimum. Again the greater the number of unfixed genes in a population, the smaller must be the average effectiveness of selection for each one of them. The more intense the selection in one respect, the less effective i t can be in others. The selection coefficient for a gene is thus in general a function of the entire system of gene frequencies. As a first approximation, relating to a given population a t a given moment, one may, however, as- sume a constant net selection coefficient for each gene. Assume that the genes a and A tend to be reproduced in the ratio (1 -s):l per generation. Thegenearray [(l-q)a+qA] becomes[(l-s) (1-q)a+qA]/[l-~(l-q)]. The change in the frequency of A is Aq= [sq(l - q ) ] / [ l - s ( l -q)] or with sufficiently close approximation Aq = sq(1- q) if the selection coefficient is
small.
A second approximation may be obtained by considering the zygotic frequencies. Assume that the types aa, Aa, and AA reproduce in the ratio (1 -s’) : (1 -hs’) :1 per generation. The change in the frequency of A to a sufficiently close approximation is Aq =s’q(1 -q) [l -q+h(2q- l ) ]
(WRIGHT 1929). In the case of selection for or against a complete reces- sive (h =0, s’ negative or positive respectively), Aq =s’q(l -q)2.
The case of no dominance (h = +) is the same as the case of genic selec- tion except that the selection against the gene is s’/2 instead of s.
The two factor case in which the phenotypes aabb, aaB
-,
A - bb and A - B - reproduce a t the rates (1 - s,b) : (1 - sa) : (1 - st,) : 1 respectively yields (for low values of the selection coefficients) :AqA = qA(1 - qA)2[Sa
+
( s a b - sa - sb)(l-
q ~ ) ’ ] .The frequency of A depends on the frequency and selection of B, becom-
ing independent only if Sab = S a + % , that is, if the two series of genes are
cumulative with respect to selection. It does not seem profitable to pursue this subject further for the purpose of the present paper, since in the gen- eral case, each selection coefficient is a complicated function of the entire system of gene frequencies and can only be dealt with qualitatively. Attention may, however, be called to HALDANE’S (1924-1927) studies of selection rates and of the consequent number of generations required for unopposed selection to bring about any required change in gene frequency under various assumptions with respect to mode of inheritance and system of mating.
Equilibrium under selection
There may be equilibrium between allelomorphs as a result wholly of selection, namely, selection against both homozygotes in favor of the het- erozygous type. Putting Aq=s’q(l-q) [1-q+h(2q-l)] = O g’ ives q = [l-h]/[l-2h] as the condition? This includes the case of selection against both homozygotes and also that in favor of them, but examination of the signs of Aq above and below the equilibrium point shows that only the former is in stable equilibrium in agreement with FISHER (1922). The linkage of a favorable dominant with an unfavorable recessive of another series is a case in which selection would be against both homozygotes as
JONES (1917) has pointed out, and stressed as a factor in the vigor of hetero-
zygosis. I n a population produced by the intermingling of types in which different deleterious recessives have become fixed, there will be a tem- porary selection in favor of the heterozygotes even without any linkage a t all. Unless the linkage is very strong, however, this effect does not persist long enough to have much effect on gene equilibrium. The extreme case of equilibrium of the sort discussed here is, of course, that of balanced lethals, found in nature in Oenothera.
I n the two factor case, discussed in the preceding section,
sb
Sa
+
sb - Saband Aq,=O if qA = 1
-
2 The condition can be expressed in a more symmetrical form by using a different form of
statement of the selection coefficients. Assume that the rates of reproduction of the three types aa,AaandAAareas (l-sJ:l:(l-sA). Thevalueof qatequZbriumcomesoutq=- with stable equilibrium only for positive values of the two selection coefficients.
EVOLUTION I N MENDELIAN POPULATIONS 103
There may be equilibrium here, if ss and s b are alike in sign, and Ssb is either opposite in sign or of the same sign and smaller, but i t is an unstable equilibrium. Of more general importance, perhaps, is the equilibrium reached by a deleterious mutant gene. For mutation opposed by genic selection Aq = -uq+sq(l - q) =0, q = 1 - u/s. For mutation opposed by zygotic selection (aa, Aa and AA reproducing a t rates (1 -s’) : (1 - hs’) : 1 it is easily shown that q = 1 - u/hs’ (WRIGHT 1929), unless h approaches 0. Thus with no dominance, q = 1 - 2u/s‘, and for selection against a dom- inant mutation, q = 1 - u/s’. The important case of selection against a
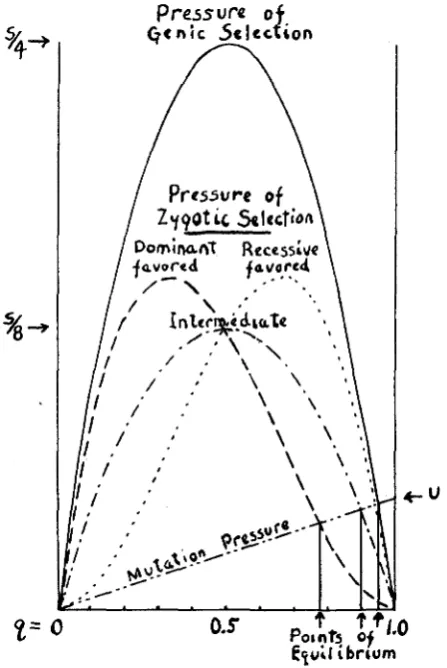
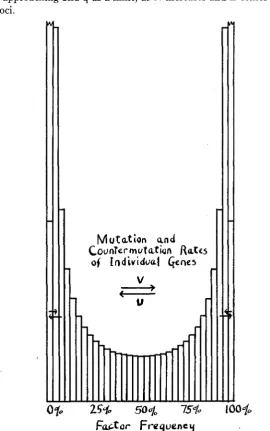
recessive is that in which h = 0. The formula becomes q = 1 - v‘u/s’. All of these cases are illustrated in figure 1 in which the ordinates show the selection pressure as related to factor frequency, under the different condi- tions of selection. The intersections with the straight line representing mutation pressure give the points of equilibrium. If deleterious dominant and recessive mutations occur with equal frequency and are subject to the same degree of selection, the frequency of the recessive mutant genes will be greater than that of the dominant ones in the ratio
.\/a
to u/s‘. The corresponding figure for factors lacking dominance is 2u/s’, where s’ is the selection against the homozygote. These considerations alone should lead to a marked correlation in nature between recessiveness and deleterious effect. This correlation is further increased by the greater frequency of re- cessive mutation which seems to be a general phenomenon. It is this corre- lation which gives the theoretical basis for the immediate degeneration which usually accompanies inbreeding, a process which increases the pro- portion of recessive phenotypes.The amount to which gene frequency in a subgroup may depart from the species average as a result of local selection held in check by popula- tion interchange with other regions may be calculated by solving the quad- ratic Aq = sq(1- q) - m (q - qm) = 0. If the local selection coefficient is much greater than the proportion of migration (s
>
m), q = 1 - -(1 -qr,,) or -mqm/s depending on the direction of selection, formulae analogous to those for the equilibrium between mutation and selection. If, on the other hand, selection is weak compared with migration (s<
m), the departure from q, is small and q =q, [1+-(1 -qm)]. This case is doubtless the more important in nature. Large subgroups living under different selec- tion pressures should show gene frequencies clustering about the average according to this expression. The effect of small size of the subgroups in bringing about random deviation in this and other cases is not here con--
m
S
S
m
sidered. The case in which s and m are of the same order of magnitude may be illustrated by the case of exact equality. Here q =
t/sm
or 1 - d1 -qmdepending on the direction of selection. Multiple allelomorphs
The foregoing discussion has dealt formally only with pairs of allelo- morphs, a wholly inadequate basis for consideration of the evolutionary pro-
%+
%-
Pressure o
Pressure of
FIGURE 1.-Rate of change of gene frequency under selection or mutation. Genic selection (A, a reproducing at rates 1: 1 -s); Zygotic selection: dominant (B-, bb a t rates 1 : 1 -s), recessive (cc, C- a t rates 1:l--),intermediate (DD, Dd, d d a t rates l:l-$s:l-s), Mutation such that
U = -0.05 s. Intersections of line of mutation pressure with those for selection pressure deter-
mine the equilibrium frequencies.
EVOLUTION I N MENDELIAN POPULATIONS 105
ing coat color are already known to be multiple. The number of multiple series is large in other organisms, for example, Drosophila (MORGAN, STUR-
TEVANT and BRIDGES 1925). It is not unlikely that further study will indi-
cate that all series are potentially multiple. I n this case, each gene has a history which is not a mere oscillation between approximate fixation of two conditions but a real evolutionary process in its internal structure. Presumably any particular gene of such an indefinitely extended series can arise a t a step from only a few of the others3 and in turn mutate to only a few. Since genes as a rule have multiple effects and change in one effect need not involve others, it is probable that in time a gene may come to pro- duce its major effects on wholly different characters than a t first. Contin- uing this line of thought, it indeed seems possible that all genes of all organisms may ultimately be traced to a common source, mitotic irregu- larities furnishing the basis for multiplication of genes.
The relative frequencies of all allelomorphs in a series tend, of course, to remain constant in the absence of disturbing forces. The zygotes reach the equilibrium of random combination of the genes in pairs by the second generation from any initial constitution of the population. The effects of the various kinds of evolutionary pressure on the frequency of each gene may be treated as before by contrasting each gene with the totality of its allelomorphs. I n the binomial expression [ (1 - q)a
+
qA1,
A may be under- stood as representing any gene, and a as including all others of its series. Such treatment, however, requires further qualification with regard to the constancy of the various coefficients. It may still be assumed that the rate (U) of mutational breakdown of the gene in question (A) is reasonablyconstant, but its rate (v) of mutational origin from allelomorphs must be expected to change. This may be expected to rise to a maximum, as genes closely allied to A in structure become frequent, and to fall off to zero as changes accumulate in the locus. Even a t its maximum, however, the rate of formation should in general be of the second order compared with the rate of change to something else, simply because it is one and its alternatives many. Moreover, there is an indication that the genes which become more or less established in a population are not a random sample of the types of mutations which occur. It has been the common experience that mutations are usually recessive. Recessiveness is most simply interpreted physiologi- cally as due to inactivation which may well be the commonest type of mutational change. But the evolutionary process presumably involves in-
a Those most closely related genetically, however, need not always be closest in effect. The complete inactivation of a gene in a particular respect may for example occur more freely than a partial inactivation.
crease in activity of genes a t least as frequently as inactivation with the consequence that the rate of formation (v) of genes of evolutionary sig- nificance becomes negligibly small in comparison with rate of breakdown (U) of such genes. It should be said that FISHER has advanced an alterna- tive hypothesis according to which genes originally without dominance be- come dominant through a process of selection of modifiers (FISHER 1928, 1929,
WRIGHT
1929,1929a).The selection coefficient, s, relating to a gene A cannot be expected to be constant if the alternative term a includes more than one gene. The coefficient should rise to a maximum positive value as A replaces less use- ful genes but should fall off and ultimately become negative as the group of allelomorphs comes to include still more useful genes. But as already discussed, even if A has only one allelomorph, the dependence of the selection coefficient on the frequencies and selection coefficients of non- allelomorphs keeps it from being constant. The existence of multiple allelomorphs merely adds another cause of variation.
Random variation of gene frequency
There remains one factor of the greatest importance in understanding the evolution of a Mendelian system. This is the size of the population. The constancy of gene frequencies in the absence of selection, mutation or migration cannot for example be expected to be absolute in populations of limited size. Merely by chance one or the other of the allelomorphs may be expected to increase its frequency in a given generation and in time the proportions may drift a long way from the original values. The decrease in heterozygosis following inbreeding is a well known statistical conse- quence of such chance variation. The extreme case is that of a line propa- gating by self fertilization which may be looked upon as a self contained population of one. I n this case, 50 percent of the factors with equal rep- resentation of two allelomorphs (that is, in which the individual is hetero- zygous) shift to exclusive representation of one of the allelomorphs in the following generation merely as a result of random sampling among the gametes. From the series of fractions given by JENNINGS (1916) for the
EVOLUTION I N MENDELIAN POPULATIONS 107
uals, assuming pairs of allelomorphs. HAGEDOORN (1921) has urged the importance of such random furation as a factor in evolution.
Another phase of this question was opened by FISHER (1922) who at- tempted to discover the distribution of gene frequencies ultimately reached in a population as a result of the above process. He studied a number of conditions relative to mutation and selection. He does not state the rate of decrease in heterozygosis (where any) which would follow from the solu-
tions which he reached but this can be deduced very directly from them. It comes out 1/4N for a population of N breeding individuals in the absence of selection or mutation. This is just half the rate indicated by the method referred to above.
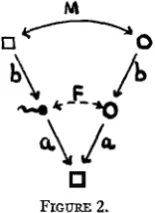
M U - 0
FIGURE 2.
Rate of decrease in heterozygosis
The following symbols and formulae were used in the previous paper in determining the consequences of systems of inbreeding. Primes were used to indicate the number of generations preceding the one in question. Only pairs of allelomorphs are considered here.
M
correlation between genotypes of matesb (=2/+(1+F')) path coefficient, zygote to gamete a (=d2(1:F))
F (= b2M) correlation between uniting egg and sperm, also, total pro- P (= 2q(l- q) (1
-
F)) proportion of heterozygosis.The general formula for the correlation between uniting gametes is easily deduced and has been used as a coefficient of inbreeding in dealing with complex livestock pedigrees (WRIGHT 1922, 1923, 1925, MCPHEE and WRIGHT 1925, 1926),
F = 2[(+)ns+m+l(l
+
FA)].path coefficient, gamete to fertilized egg
portional change in heterozygosis.
Here FA is the coefficient of inbreeding of any common ancestor that
makes the connecting link between a line of ancestry tracing back from the sire and one tracing back from the dam. The numbers of generations from sire and dam to such a common ancestor are designated n, and nd respec- tively. The contribution of a particular tie between the pedigrees of sire and dam is ( + ) , ~ + ~ d + l ( l + F A ) and the total coefficient is simply the sum
of all such contributions. This formula makes it possible to compare quan- titatively the statistical situation in actual populations with that in ideal populations.
I n dealing with regular systems of mating the method of analysis con- sists in expressing the correlation between mated individuals in terms of path coefficients and correlations pertaining to the preceding generation
(M =4(a,'b,'M') and from this obtaining expression for F in terms of the F's of the preceding generations.
Consider a population in which there are N,, breeding males and N f breeding females, and random mating. The proportion of matings between full brother and sister will be l / ( N m N f ) , that between half brother and sis- ter (Nnl
+
Nr- 2)/(N,,,Nf), and that between less closely related individuals (N, - 1) (Nf - l)/(NmNf). The correlation between mated individuals may be written as follows, giving due weight to these three possibilities:1
M = aI2b'* -(2
+
2M')+
N,,+
Nf - 2 (1+
3M')[NmNf NmNr
This leads to the following formula for proportional change in hetero- zygosis since the foundation period:
F = F'
+
("
Nf)(l - 2F'+
F"). 8NmNfThe proportion of heterozygosis may be written, relative to that of pre- ceding generations:
EVOLUTION I N MENDELIAN POPULATIONS 109
This gives (1/8N,
+
1/8Nf) (1 - 1/8N, - 1/8Nf) as a close approxima- tion even for the smallest populations while for reasonably large ones the form 1/8N,+
1/8Nr is sufficiently accurate.The simplest case is that of continued mating of brother with sister (N, = N f = 1). The rate of loss of heterozygosis comes out 4(3 - 45) or 19.1 percent per generation. The formula for proportion of heterozy- gosis takes the form P=+P’+tP’’ as given in the previous paper, with results in exact agreement with those derived by JENNINGS (1916) by working out in detail the consequences of every possible mating from gen- eration to generation.
Another simple case is that in which one male is mated with an indef- initely large number of half-sisters. This is approximately the system of breeding continuously within one herd, headed always by just one male. I n this case N, = 1, Nt 00, with rate of loss of heterozygosis of 11.0 per- cent per generation in agreement with previous results (WRIGHT 1921). With a relatively limited number of males but unlimited number of fe- males, the rate becomes approximately 1/8N,,,.
An especially important case is that in which the population is equally divided between males and females. Here N, = Nf = 4N and the rate of
loss is approximately 1/2N (or somewhat more closely 1/(2N+ 1)) where N is the total size of the breeding population.
It is not, perhaps, clear at first sight that a population of N monoecious organisms, in which self fertilization is prevented, should show a decrease in heterozygosis exactly equal to that in a population of the same size equally divided between males and females. The chance that uniting gametes come from full sisters is 2/[N(N- l)], the chance that they come from half sisters is 4(N-2)/[N(N-l)] while the chance that they come from less closely related individuals is (N - 2)(N - 3)/[N(N - l)] giving
af2bt2 N ( N - 1)
M = [2(2 +2M’) +4(N-2)(1+3Mt)
+
(N - 2)(N -3)4M’] 12N
p = p ’ - - p”)
exactly as in the preceding case.
The somewhat arbitrary case in which the gametes produced by N mo- noecious individuals unite wholly a t random is that which can be compared directly with FISHER’S results. The gametes have a chance 1/N of com- ing from the same individual and of (N - 1 ) / N of coming from different in- dividuals. The correlation between uniting gametes may thus be written
As might be expected, the result does not differ appreciably from that of the preceding case. The rate of loss of heterozygosis is exactly 1/2N in- stead of merely approximately this figure. The simplest special case is, of course, continued self fertilization in which N = 1 and the formula gives the obviously correct result of 50 percent loss of heterozygosis per genera- tion.
From the mode of analysis it might be thought that the loss in heterozy- gosis is wholly the consequence of the occasional matings between very close relatives. This, however, is not the case. If instead of random sam- pling of the gametes produced by the population it is assumed that all individuals reproduce equally and that inbreeding is consistently avoided as much as possible, the percentage of heterozygosis still falls off. The rate of loss is, however, only about half as rapid (approximately 1/4N) in a reasonably large population equally divided between males and females. The cases of N = 2 , 4 , 8 and 16 have been given previously (WRIGHT 1921). I n dealing with heterozygosis in the foregoing, i t has been assumed for simplicity that each locus was represented by only two allelomorphs in the population in question and that either complete fixation or complete loss of a particular gene means homozygosis of all individuals with re- spect to the locus. But in any case beyond that of self fertilization, more than two allelomorphs may be present and complete loss of the gene no longer implies homozygosis of the locus. The initial rate of loss of hetero- zygosis in a large population may thus be only 1/4N with gradual approach to 1/2N as the number of loci with only two remaining allelomorphs in- creases. The rate of decay of the distribution of gene frequencies is 1/2N regardless of number of allelomorphs.
The population number
EVOLUTION I N MENDELIAN POPULATIONS 111
ates greatly, the effective N is much closer to the minimum number than to the maximum number. If there is a great difference between the number of mature males and females, i t is closer to the smaller number than to the larger. I n fact, as just shown, a population of N, males and an indefinitely large number of females is approximately equivalent to a population of 4N, individuals equally divided between males and females.
The conditions of random sampling of gametes will seldom be closely ap- proached. The number of surviving off spring left by different parents may vary tremendously either through selection or merely accidental causes, a condition which tends to reduce the effective N far below the actual number of parents or even of grandparents. How small the effective N of a population may be is indicated by recent studies of SMITH and CALDER
(1927) on the Clydesdale breed of horses in Scotland, in which they find a steady increase in the degree of inbreeding (Coefficient F) equivalent to that in population headed by only about a dozen stallions. Even more striking is the rapid increase in the coefficient of inbreeding in the early history of the Shorthorn breed of cattle (MCPHEE and WRIGHT 1925).
THE DISTRIBUTION O F GENE FREQUENCIES AND ITS IMMEDIATE CONSEQUENCES
N o mutation, migration or selection
On making a cross between two homozygous strains a population is pro- duced in which the members of each pair of allelomorphs in which the strains differ are necessarily equally numerous. The proportional fre- quency of each allelomorph in unfixed series is q = 0.50. I n an indefinitely large population, there should be no change in this frequency in later generations (except by recurrent mutation or selection). I n any finite population, however, some genes will come to be more frequent than their allelomorphs merely by chance. This means a decrease in heterozygosis, since the proportion of heterozygosis under random mating is 2q(l -q), and this quantity is maximum when q = 0.50. As time goes on, divergences
in the frequencies of factors may be expected to increase more and more until a t last some are either completely fixed or completely lost from the population. The distribution curve of gene frequencies should, however, approach a definite form if the genes which have been wholly fixed or lost are left out of consideration. This can easily be seen by considering a case opposite in a sense to that considered above. Suppose that a large num- ber of different mutations occur in a previously pure line. The frequency ratio of mutant to type allelomorphs is initially (1/2N) : (2N- 1)/2N where N is the number of individuals. The great majority of such muta-
tions will be lost, by the chances of sampling, as FISHER (1922) points out. Those which persist are largely those for which there has been a
chance increase in frequency. The distribution curve of frequencies of persisting mutations will thus continually spread toward higher frequen- cies. There must be a position of equilibrium as far as form is concerned between this situation and that first considered, although a uniform de- cline in absolute numbers.
As noted above, decrease in heterozygosis takes place in the early genera- tions following a cross without any appreciable fixation or loss of genes. But after equilibrium has been reached in the form of the distribution curve, further loss in heterozygosis must be identical in rate with fixation I n simple cases, the equilibrium distribution of gene frequencies can easily be worked out directly. Under brother-sister mating, for example, the following relative frequencies of the 4 possible types of mating involv- ing unfixed factors are in equilibrium although the absolute frequencies of all are falling off 19.1 percent (=4(3-&)) each generation as new genes enter the fixed states, AA X AA or aa X aa.
plus loss.
Mating Relative Frequency
Percent
AAXAa 7- 3 6 = 29.2
Aa XAa - 2 2 + 1 0 6 = 36.1
AAXaa 9- 4 d 5 = 5.6
Aa Xaa 7- 3 6 = 29.2
100.1
Similarly in populations of 2 and 3 monoecious individuals with random union of gametes, the following relative frequencies are in equilibrium although the absolute frequencies are decreasing in each generation by exactly 25 percent and 16% percent respectively verifying the 1/2N of theory.
Gene Frequency
3 A : l a 2A:2a 1A:3a Gene Frequeney
SA: l a 4A:Za 3A:3a 2A:4a 1A:Sa
C h s Frequency
Percent
32 Case of 2 monoecious 36 individuals per gen- 32 eration
Class Preqvaey Percent
18.3 21 .O
21.4 individuals per gen- 21.0 eration
18.3
Case of 3 monoecious
EVOLUTION I N MENDELIAN POPULATIONS 113
I n order to determine generally the distribution of gene frequencies, consider the way in which genes (A) with frequency q are distributed after one generation of random mating. I n a population of N breeding individ- uals, each of the specified genes will have 2Nq representatives among the zygotes and their allelomorphs 2N (1 - q). A random sample of the same size will be distributed according to the expression [(l -q)a+qA]2N. The contribution of this sample to the frequency class with an allelomor- phic ratio of ql: (1 - ql) will be in proportion to the 2Nql 'th term of the above expression and to the number of genes included in the contribut- ing class (f). The sum of contributions from all such classes should give the 2Nql 'th term an absolute frequency smaller than its value in the pre- ceding generation (fl) by the amount 1/(2N+ 1) deduced above. Follow- ing is the equation to be solved for f as a function of q.
Replacing summation by integration and letting f = 4(q)/2N = 4(q)dq
we have4
The cases of 2 and 3 monoecious individuals as worked out by simple algebra suggest an approach to a uniform distribution. As a trial let 4(q) = C . It will be found that this makes the right and left members of the equation identical and is thus a solution.
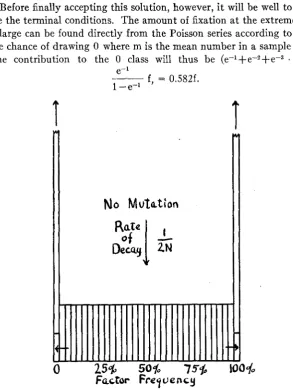
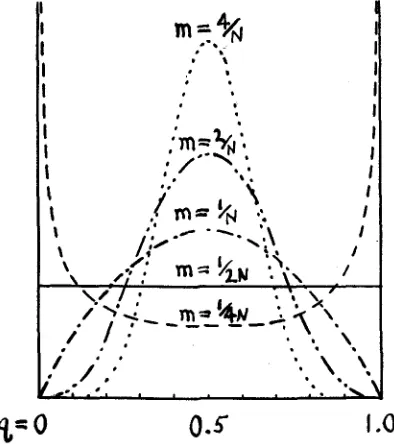
The case of loss a t rate 1/2N should not differ appreciably from t h a t a t rate 1/(2N+1). It would appear that after a cross, the gene frequencies will spread out from 50 percent toward fixation and loss until a practical- ly uniform distribution is reached. The frequencies of all classes will then slump a t a rate of about 1/2N as 1/4N of the genes become fixed and the same number lost per generation. Figure 3 is intended to illustrate this situation.
f must be equated to +(qj/2N here, rather than +(q)/(2N-l), if the convenient limits 0 and 1 are to be used for integration in place of the limits 1/2N and (2X-l)/2N of the summation
with its 2N- 1 terms.
Before finally accepting this solution, however, i t will be well to exam- ine the terminal conditions. The amount of fixation a t the extremes if N is large can be found directly from the Poisson series according to which the chance of drawing 0 where m is the mean number in a sample is e-m. The contribution to the 0 class will thus be (e-'+e-2fec3 1
.
. ) f =e-l
1 -e-+ f, = 0.582f.
T
T
N o
Mutation
25%
50%
755
Factor Frequency
FIGURE 3.-Distribution of gene frequencies in an isolated population in which fixation and
loss of genes each is proceeding a t the rate 1/4N in the absence of appreciable selection or muta-
tion. y=Le-T'2N.
This is a little larger than the +f deduced above and indicates a small amount of distortion near the ends due to the element of approxi- mation involved in substituting integration for summation. The nature and amount of this distortion are indicated by the exact distributions ob- tained in the extreme cases of only 2 and 3 monoecious individuals.
EVOLUTION I N MENDELIAN POPULATIONS 115 Unfixed loci in the T 'th generation LT = Loe - T m
An analogous formula holds for genes in multiple series, but in this case, as previously noted, the rate of fixation of loci is only half that given above. The amount of genetic variation with respect to cumulative characters is easily calculated assuming for simplicity pairs of allelomorphs. The con- tribution of each factor pair to variance, in the case of no dominance, is 2a2q(l -4) where a is the average difference in effect between plus and minus allelomorphs. The general formula for variance in this or any other distribution is thus u2=2a2Jo'q(l -q)+(q)dq. I n the present case in which +(q) = L this reduces to u2 = $La2. PEARSON'S
p2
comes out with a value 2.8 a slightly platykurtic distribution. Since the percentage of heterozy- gosis for a given factor frequency, q, is 2q(l- q), the formula for heterozy- gosis is the same as that for variance except that a2 is to be omitted.Similarly in the case of dominance, the contribution of a single factor pair to variance is 4a2(1 - q)2(2q -q2) where a is half the average difference in effect between dominant and recessive zygotes. The total variance with perfect dominance is thus in general
1
fs2 = 4 a q (1
-
q m l - q 2 ) d q ) d q .Tn the case of a uniform distribution this gives u2=8/15 La.2
FISHER (1918) has emphasized the importance of a characteristic of the population which he calls the dominance ratio. He analyzes the variance of characters into three portions, that due to genetic segregation ( T ~ ) that due to dominance, as something which causes deviations of the pheno- type from the closest possible linear relation with the genotype (e2), and that due to environment. Assuming environment constant, uz = ~ 2 + e 2 .
The simple formulae for the correlations between relatives, to be found if there is random mating and no dominance, must be modified, if dominance is present depending on the value of the dominance ratio defined as ~ 2 / u 2 . Following are examples which he gives:6
6The author wishes here to correct an error in his 1921 paper which was written without knowl- edge of FISHER'S results cited above. In this paper i t was assumed that the correlation with no dominance needed merely to be multiplied by the squared correlation between genotype and phen- otype, the same as FISHER'S +/u2= (1 -ez/$), to obtain that with dominance. This gives correct results (if there is no assortative mating) in the case of offspring with parents, all other ancestors and also in the case of collaterals where one of the individuals is related to the other through only one parent but i t is more or less in error in other cases, the fraternal correlation being that most affected. The reasoning followed was not exact because a correlation in the deviations due to dominance in the cases indicated was overlooked.
Parent and offspring Brothers
Uncle and nephew Double first cousins
FISHER has shown that the contribution of a single factor to E*, if there is complete dominance, may be written 6 2 = 4q2( 1
-
q)2a2 where q is the fre-quency for dominant allelomorphs. Whether a particular dominant gene has a plus or minus effect on the character under consideration is immater- ial. The contribution due to genetic segregation he gives as
p2
= 8 q ( l - q)3a2thus
I n the present case this reduces to
a
as given by FISHER who also ob- tains a uniform distribution of factor frequencies for the case of no mu- tation or selection, although a different rate of decay.Nonrecurrent mutation
If mutation is occurring, however low the rate, the decline in heterozy- gosis, following isolation of a relatively small group from a large popula- tion, cannot go on indefinitely. There will come a time when the chance elimination of genes will be exactly balanced by new genes arising by mu- tation. The equation to be solved is obviously as follows:
It may be found by trial that the expression +(q) = C1q-l+C2(l - q)-l is a solution. The terminal condition, reduction of the class of fixed genes
(q = 1) by an occasional mutation (contributing to the class q = (2N
-
1)/2N necessarily involves the appearance of new genes (contributing to the class q = 1/2N) and therefore means that only the symmetrical solution +(q) = Cq-'(l- q)-1 can be accepted as descriptive of the distribution of
EVOLUTION I N MENDELIAN POPULATIONS 117
1
2 [(0.577+log (2 N - l ) ]
c -
or approximately C = 1/(2 log 3.6N) (compare figure 5 ) .
Before attainment of equilibrium with respect to heterozygosis the distribution will pass through phases of approximately the form +(q) = Clq-'(l- q)-'+ C3 in which the term C1 gradually displaces C3 as the num- ber of temporarily fixed genes approaches equilibrium with mutation.
Each particular gene has a probability distribution for the future which spreads in time from the initial frequency in curves which are a t first ap- proximately normal in form but later (if the initial q was not too close to 1)
become flat, the chances of complete fixation or complete loss each in- creasing by 1/4N each generation. As the chances of complete fixation increase, the chance of mutation must be taken into account. The dis- tribution passes through phases of the type Cz(l -q)-'+C,, Cz gradually displacing Ca, relatively, but itself beginning to decline as the chance of complete loss increases. With initial q equal (or close) to 1, equilibrium with mutation, and hence the hyperbolic distribution, is reached directly. The ultimate result in any case is complete loss of the gene in question (still assuming no recurrence of the same mutation and hence mutation of
the gene but not to it). If there is reverse mutation, but a t very low rate, a term Clq-' must be added to the formula, and an equilibrium will be reached in the form Cq-l(l-q)-l. This last formula means that in the long run (assuming no disturbances from selection, migration, etc.) the gene will usually be found either completely fixed or completely absent from the population (with frequencies proportional to the mutation rates to and from the gene respectively) but that occasionally fixation or ab- sence will not be quite complete and that a t extremely rare intervals the gene will drift from one state to the other.
The turnover among genes in equilibrium in the distribution Cq-'(l -q)" can be determined from consideration of the variance of q, and indepen- dently by application of the Poisson law.
Let uq2 = 2(q - $)2f/Zf be the variance of q, excluding the terminal clas- ses, the summation including 2N- 1 terms. This variance is increased in the following generation by the spreading out of each frequency class as a result of random sampling. The variance from the spreading of a single class is q(1 -q)/2N and the average is thus
2N - 1
A u , ~ = C .
2NZf (2W2
The sum uq2+Auqz includes the newly fixed factors whose contribution Digressing for a moment to the case of no mutation but equilibrium of is $K where R is the rate of fixation, plus loss, but excludes mutation. form, we have a t once
uq2
+
Aa,? = K$+
(1 - K)aq2(K-&)
(
uq2-t)
= 0 giving an independent demonstration that the rate of decay is 1/2N in this case.of new mutations to variance is K(N - 1)?/(2N)?.
Returning to the case of equilibrium under mutation, the contribution
1
2 log 3.6N '
R = C =
The proportion exchanged a t each extreme is thus about half the corre- sponding subterminal class where N is large (fl = f2N--1= 2NC/(2N - 1) by this method. This compares fairly well with the proportion as determined by the Poisson law, which is 0.46 times the subterminal class instead of 0.50.
The equilibrium frequencies can be worked out algebraically in simple cases. The figures below give the results in the case of a population of 3
monoecious individuals for comparison with the theoretical values de- duced above. The rate of exchange a t each extreme is actually 10.8 percent in comparison with 11 .O percent as
"(
=T)
the subtermi- nal class, or 11.4 percent from the formula The case of ir- reversible mutation is also given.2N-1
1 2 1
4(.577+log 5)'
Gene frequeney
5A:la 4A:2a 3A:3a 2A:4a 1A:5a Totals Terminal exchange Loss
Reversible Mutation Ezact
equilibrium cq-' (1-q)- '
27.5 26.3
15.4 16.4
14.1 14.6
15.4 16.4
27.5 26.3
99.9 100.0
10.8 11.0
Irreversible Mutation
E m t C(1 -q)-l 47.7 43.8 20.6 21.9 14.1 14.6 10.2 10.9 7. 3 8 . 8 99.9 100.0 18.0 18.25
EVOLUTION IN MENDELIAN POPULATIONS 119
The number of unfixed loci (L) which a given mutation rate per indivi- dual ( p ) will support in a population is easily found, assuming only pairs of allelomorphs. The number of mutations is KL as well as N p . There- fore L = Np/K = 2Np log 3.6N. The variance of cumulatively determined characters worked out as in the preceding case comes out 2Npa2 in the case of no dominance and 10/3 Npa2 in the case of dominance, in both cases, directly proportional to the size of population6 and to the mutation rate. In view of the piling up of new mutations, one might perhaps, expect to find a leptokurtic distribution for characters. This, however, turns out not to be the case: PEARSON’S
p2
comes out exactly 3 in the case of no domi- nance on substitution in the general formulas,’
q(1 - 9) [1 - 6q(l - q)I+(q)dq[
Jr,’q(1 - q)+(q)dq]P 2 = 3 +
FISHER’S dominance ratio comes out 1/5 in this case.
The preceding results differ somewhat from those presented by FISHER (1922). The latter’s analysis was based on a transformation of the scale of factor frequencies designed to make the variance due to random sampling uniform a t all points. The variance a t a given value of q isq(l-q)/2N. FISHER assumes that if the ratio of small differences on the q scale to the corresponding differences on a new 0 scale be made proportional to the varying standard deviation of q, the standard deviation on the 0 scale will be uniform. Letting dq/dO = d q ( 1 - q) leads to the transformation 0 = cos-l(l- 2q) with uniform variance of factor frequencies of 1/2N. Let- ting y = F(6) be the distribution of factor frequencies in one generation,
he wrote that in the next as
and measuring time in generations (T) he reached the equation a y 1 d2y
a~
4~ de2-
= --.
After noting that the solution for the symmetrical stationary case is
These estimates of number of unfixed loci and of variance depend, of course, on the validity of the conditions on which the formula of the distribution curve is based. How far the mutation rate per locus can be considered negligibly small as size of population increases is discussed later.
y =L/a, he proceeded to derive the formulae for increasing and decreas- ing y. Considering the latter, dy/dT = - Ky where K is the rate of decay, giving 1/4N d2y/d82 = - Ky as the equation to be solved. I n the symmet-
rical case ~ this yields y = C cos [d/4NK(B-n/2)] where C = 2/=/[2 sin
($av'4NK)] in order to give a total frequency of unity and is to be mul- tiplied further by Loe-Kr to show change from the initial frequency of Lo.
The maximum value which K can take without giving negative frequen- cies within the range is obviously 1/4N and FISHER found reason for ac- cepting this as the value in the case of no mutation. The formula for the distribution in this case reduces to y = $ sin 8. FISHER transformed these equations to the scale Z =log [q/(l -q)] in which the case of no mutation becomes y = sech2 $2 and the case of loss balanced by mutation becomes y = 1/2a sech iZ. This transformation brings the curves into an approach to the form of the normal probability curve. For our present purpose i t is preferable to transform to the scale of actual factor frequencies. The case of steady decay becomes y = 1 with which my results are in agreement, al-
though in disagreement as to rate of decay. I n the case of loss balanced by mutation, FISHER'S formula transforms into y = 1/ [av'q(l- q ) ] instead of 1/[2(log 3.6N)q(l -q)] as developed in the present paper. FISHER obtained v'T2N3I2p for the number of unfixed factors, in contrast with 2Np log 3.6N; and $,/gfor the factor turnover in contrast with 1/ [2 log3.6Nl. It will be seen that FISHER'S solution leads to a smaller number of unfixed factors with more rapid turnover in very small populations (less than 81) but to a larger number of such factors with slower turnover in larger popu- lations. I n a breeding population of one million with one mutation per
1000 individuals, FISHER'S formula gives 1,250,000 unfixed factors with
a turnover of 0.08 percent while I get 30,000 unfixed factors with a turn- over of 3.3 percent.
The exact harmonizing of the results of the two methods of attack has been a somewhat puzzling matter, but Doctor FISHER, on examination of the manuscript of the present paper, has written to me the following which I quote a t his suggestion. (' . .
.
. I have now fully convinced myself that your solution is the right one. It may be of some interest that my original error lay in the differential equationa y 1 a2v - = - -
d T 4N 138~
EVOLUTION I N MENDELIAN POPULATIONS 121
the new term coming in from the fact that the mean value of lip in any gen- eration from a group of factors with gene frequency p is exactly zero,' and consequently the mean value of 68 is not exactly zero but involves a mi- nute term -1/4N cot
e.
With this correction, I find myself in entire agreement, with your value 2N, for the time of relaxation and with your corrected distribution for factors in the absence of selection."Reversible recurrent mutation
It only requires a very moderate mutation rate in a large population for the number of unfixed loci to become enormous. This raises the ques- tion as to the effect of a limitation in the number of mutable loci, and re- currence of mutations.
Consider now the case of genes with uniform rates of recurrence of mu- tation and reverse mutation. Let U be the rate per generation for break
down of the gene A and v that for origin from allelomorphs. A class of genes with frequency q (that of all allelomorphs, 1
-
q) will be distributed in the following generation under random sampling according to the expan- sion of the expression{
[(I - q) - v(1 - q)+
uqla+
[q+
v ( l - q) - ~ q ] A ] $ ~ f Equating the total contribution to a given class, to the frequency of this class in the parent generation, reduced by the proportion K, if there is a uniform rate of decay, gives as the equation to be solved:[l - q ( l - U - V) - ~]~N(l-q1)'(q)dq. It will be found by trial that the right and left members became identi- Let x = q (1 - u - v)
+
vcal in certain cases in which +(q) is of the form qs(l -q)t
x - v 1 - U - v
q = dx
1 - U - v dq =
XS - svxs-1
.
,.
(1 - x)t - tu(1 - xp-1(1 - U - v)t
qs = (1 - q)t =
(1 - U - v p
p is the q of the present paper. Since the above was written, FISHER has published this re- vision of his results in The genetical theory of natural selection, 1930.
The small amount of spread from a given class will justify retention of the untransformed limits of integration.
Noting that I'(c+s+l)
= I C
- cs approximately when c is an integer and s is small compared with c, and making use of the fol- lowing derived relation4N
+
~ ( s+
1)qi-l+
t ( t+
1)(1 - qi)-'Sl"(1 - q1)t
- -
4N
+
(s+
t+
l)(s+
t+
2)the equation may be written as followsf or small values of s and t (com- pared with N) and values of U and v of a still lower order of size.
(1 - K)qis(l -
1 4N
q1s(l - q1)t 4Nsv
- -
1 - (U
+
V)(S+
t+
1) 4N+
(S+
t+
l ) ( s+
t+
2)s ( s + l ) )q1s-I(l -q1Y
'(4N
+
(s+
t+
1) (s+
t+
2) - 4N+
(s+
t> (s+ t+
1)+(4N+ (s+ t
+
1) (s+ t +2) -4N+ (s+ t) (S+ t+
1)t ( t + l ) 4Ntu ) q 1 s ( 1 --ql)t-;]
The coefficients of qls-l(l -ql)t and of qls(l -ql)+-' must equal 0 either under complete equilibrium or equilibrium merely in form of distribution. Neglecting small quantities:
s = O or s = 4 N v - 1 t = O or t = 4 N u - 1 .
I n the case of complete equilibrium (K=O), it turns out that the CO- efficients of qls(l - ql)t in the left and right members are also satisfied to a
first approximation by s = 4Nv - 1, t = 4Nu - 1. They are also satisfied by letting s = 0, t = 0 provided that u + v = 1/2N. The relation between the fixed terminal and the unfixed subterminal classes, however, requires that
U = v = 1/4N in this case, which thus becomes merely a special case of the first solution. Similarly, the solutions s = 0, t = 4Nu - 1 and s = 4Nv - 1,
t = 0 require that v = 1/4N and U = 1/4N respectively and thus also reduce to special cases of the first solution. It appears then that the distribution
EVOLUTION I N MENDELIAN POPULATIONS 123
q4Nv-1(1
-
q)4Kn-1. r(4Nu+
4Nv)'(') = I'(4Nu)I'(4Nv)
, The terminal conditions are of interest in this and other cases to be con-
sidered. The factor turnover a t each extreme may be written KO = + f l = 2Nvfo
K2N = 5 f 2 N - 1 = 2NUf2~ where the subterminal classes have the frequencies '
I n the present case, the terminal classes have the frequencies f o = C/[4Nv (2N)4Nv] and f 2 N = C/[4Nn(2N)4Nu] where C is: the coefficient in the expres- sion for 4(q).
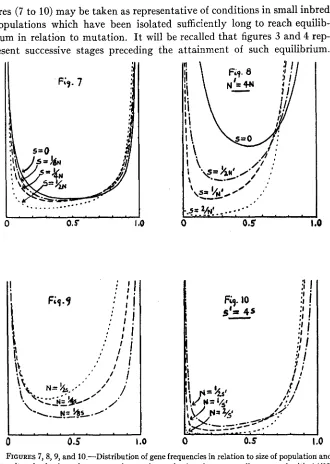
It will be seen that the form of the curve depends not only on the rates of mutation of the genes but also on the size of the breeding population. With small populations or rare recurrence of mutations, the distribution approaches the symmetrical form y = 1/(2 log 3.6N) q-l(l- q)-' already dis- cussed (figure 5). The ratio of the class of temporarily fixed genes (f2N) to
the class of complete absence (fo) must be approximately v:u in this case in order that the number of mutations a t each extreme of the symmet- rical distribution of unfixed factors may be equal.
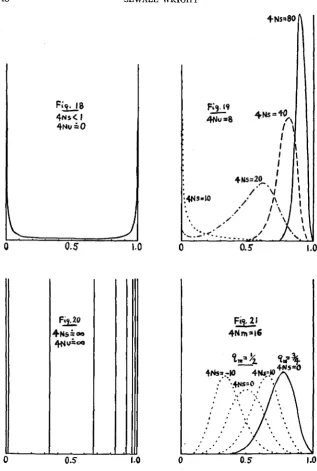
With increase in size of the population, the gene frequencies tend in general to be distributed in asymmetrical U - or even I - or J - shaped curves. For example, if the size of population reaches 1/4u and v is much smaller than U, the distribution will be the hyperbola 4(q) = Cq-' with a
piling up of factors with few or no plus representatives.
With sufficient increase in the size of population, the distribution a t length takes a form approaching that of the normal probability curve; centered about the point
S
= v/(u+v) which, indeed, is always the meanThe variance of gene frequencies, aq2 =Ji(q -c)%$(q)dq is -
q(1 -
9
4N(u+
v)+
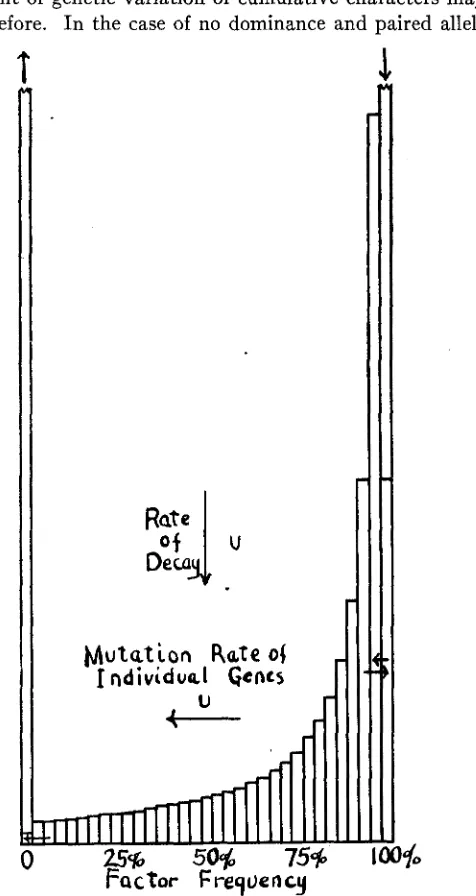
1The amount of genetic variation of cumulative characters may be cal- culated as before. I n the case of no dominance and paired allelomorphs
M u t u t i o n
Rate o jI
ndividuel Gents
&-
FIGURE 4.-Distribution of type genes in an isolated population in which equilibrium has been reached with destructive mutation but has not been approached with respect to formative mutation. y=4NuL~e-”T(l-q)~NU-l with 4Nu much smaller than 1 and the formula approxi-
Lo(l-q)-l mately _____
EVCILUTION I N MENDELIAN POPULATIONS 125
it is u2=2La2 4Nuq/(4Nu+4Nv+l) or 2La2[q(l -q) -uq2]. Where U is much greater than v, this canbe written approximately u2 = 2La24Nv/(4Nu
+1) approaching 2La2q as a limit, as N increases and L comes to include all loci.
Mutation
andCounter
mutation RaWiof IndividuaI Gene5
V
U
Futor
FraquencyFIGURE .5.-Distribution of gene frequencies (or probability array of gene) where equilibrium with mutation has been attained. Population so small that the terms 4Nu and 4Nv are both much smaller than 1. y = Cq4NY-l(l -q)4Nu-1, approximately
GENETICS 16: Mr 1931
As the formula for this case was derived on the assumption of small val- ues of U and v, it is desirable to obtain an independent test of its applica- bility to large values. This can be done as follows: the increase in variance of q due to random sampling is
Letting Aq = -uq+v(l -q) be, as before, the changein q due tomutation, q+Aq-tj= (q-q)(l-u-v). Thus the effect of mutationisasif alldevia- tions from the mean were reduced in the proportion (1 -U-v). The de- crease in the variance of q, due to mutation is therefore uq2 [l - (1 - U - v ) ~ ] . At equilibrium the increase in aq2 due to random sampling is exactly bal- anced by the decrease due to mutation yielding:
-
9 0 -9) =
~ N ( u +v)
-
2N(u + v ) ~+
1.The term - 2 N ( ~ + v ) ~ in the denominator is important only when (u+v) has a large absolute value. Omitting this, the formula is identical with that deduced by the first method and thus gives an independent demon- stration of its validity. As mutation approaches its maximum value ( u + v = l ) , the variance of q approaches q(1 -tj)/2N, that due to random sampling alone.
Migration
The distribution of gene frequencies in an incompletely isolated subgroup of a large population can be obtained immediately from the preceding re- sults. The change in gene frequency per generation under migration Aq= -m(q-q,)can bewritten -m(l-q,)q+mq,(l-q) which isinthe same form as the change of q under mutation, Aq = -uq+v(l -q). We may write a t once for the distribution under negligible mutation rates:
(4") q4"qm-l(1
-
q)lNm(l-qm)-I.'(') = I' [4Nmqm]I' [4Nm(l
-
qm) ]The mutation terms 4Nu and 4Nv can be inserted, if mutation rates are not negligible.
EVOLUTION I N MENDELIAN POPULATIONS 127
means an interchange of only one individual every other generation, re- gardless of the size of the subgroup. However, this estimate must be much qualified by the consideration that the effective N of the formula is in gen- eral much smaller than the actual size of the population or even than the breeding stock, and by the further consideration that q, of the formula re- fers to the gene frequency of actual migrants and that a further factor must be included if q, is to refer to the species as a whole. Taking both of these into account, it would appear that an interchange of the order of thousands of individuals per generation between neighboring subgroups of a widely distributed species might well be insufficient to prevent a con- siderable random drifting apart in their genetic compositions. Of course,
%=
0
0.5
I
.o
FIGURE 6.-Distribution of frequencies of a gene among subdivisions of a population in which q, = 1/2 (or probability array of gene within a subdivision) under various amounts of intermigra- tion. y = c q 4 " s m - i ( i - - ) k N m ( 1 ~ ) - l .
differences in the condition of selection among the subgroups may greatly increase this divergence. It appears, however, that the actual differences among natural geographical races and subspecies are t o a large extent of the nonadaptive sort expected from random drifting apart. An interest- ing example, apparently nonadaptive, is the racial distribution of the 3 allelomorphs which determine human blood groups (BERNSTEIN 1925). The variance of distribution of values of q among subgroups (in the ideal
case) is uq2 = q m ( 1 - qm)/(4Nm+ 1) by substitution in the formula for the preceding case.
The zygotic distribution [(1-q)a+qAI2 cannot be expected to hold in a population made up of isolated groups among which gene frequency var- ies. WAHLUND (1928) has shown that the proportions in each homozy- gous class are increased a t the expense of the heterozygotes by the amount of the variance of the gene frequencies among the subgroups's the propor- tions becoming [(l -q)2+u,2]aa+ [2q(l -q) -2uq2] Aa+ [q2+uq2] AA. By substituting the expression for uq2, given above, in WAHLUND'S formula one might determine empirically the effective value of 4" for the popu- lation, except that it would be difficult to rule out the possibility that some of the variance of gene frequencies might be due to differences in the selection coefficients among the subgroups instead of merely to ran- dom drifting apart.
Irreversible recurrent mutation
The solution s =0, t =4Nu - 1 for the equation reached in the case of
recurrent mutation satisfies the conditions for equilibrium of form under irreversible mutation (v = 0)' with decay a t rate K =U.
4(q) = ~ N U L ~ ~ - ~ T ( ~ - q)lNu--l.
The proportional frequency of the unfixed subterminal class which is not replenished by mutation is fl/(Loe-llT) =2u, twice the rate of decay and thus approximately satisfying the necessary terminal condition.
For values of U as small as 1/(2N log 3.6N) the coefficient in the expres-
4NuLoe-"T 1 - - 4Nu sion for #J (9) must be calculated to a closer approximation
which approaches L as U approaches zero. ( 2 3
log 3.6N
The distribution of gene frequencies under irreversible mutation is il- lustrated in figure 4.
EVOLUTION I N MENDELIAN POPULATIOSS 129
librium of the form described above. With decay a t the rate U , it may
be a very long time before effects of reverse mutation become appreciable and the final equilibrium y = Cq-'(l- q)-' approached. Assuming that type genes are dominant, the dominance ratio in this case is 1/3.
Selectiong
Using Aq = sq( 1 - q) as the measure of the effect of genic selection, the
class of genes with frequency (1 - q)a : qA is distributed after one genera- tion according to the expression:
{ ( I - q ) ( l
-
sq)a+
q [ l+
s(l - q ) ] A ) 2 N .The distribution of gene frequencies which is in equilibrium may be ob- tained from the following equation which represents the total contribu- tion to class ql after one generation, as equal to its previous frequency.
To a first approximation, the selection terms approach the value ezNs(q1--). The introduction of a factor ezNsq into the previously reached formula for 4(q) gives a solution of the equation (for very small values of s) since it cancels the new term e-2Nsq in the integral, and leaves e2Nsql as a factor in 4(ql). This was the basis for the formula published (WRIGHT 1929a) as +(q) = CeZNsqq4Nv--l(l -q)4Nu-1 intended to exhibit in combina- tion the effects of selection, mutation in both directions and size of popula- tion. Further consideration reveals that this solution is the correct one only for the case of irreversible mutation and then only when the selection coefficient is exceedingly small, less than 1/2N in fact. FISHER (1930) in his recently published revision of the results of his method of attack on this problem has given a formula for a special case of selection, equilibrium of flux from an inexhaustible supply of mutating genes. This is given as ac- curate as long as Ns2 is small. Assuming one mutation per generation, he writes :
2dp(l - e-4anq) pq(1 - e-dan) Y =
gThis and the following section have been rewritten since submission of the manuscript in order to take account of the correction of my formula, suggested by FISHER'S results in The genetical theory of natural selection, 1930 as noted herein.