INVESTIGATION
Estimating Variable Effective Population Sizes from
Multiple Genomes: A Sequentially Markov
Conditional Sampling Distribution Approach
Sara Sheehan,*,1Kelley Harris,†,1and Yun S. Song*,‡,2 *Computer Science Division,†Department of Mathematics, and‡Department of Statistics, University of California, Berkeley, California 94720
ABSTRACT Throughout history, the population size of modern humans has varied considerably due to changes in environment, culture, and technology. More accurate estimates of population size changes, and when they occurred, should provide a clearer picture of human colonization history and help remove confounding effects from natural selection inference. Demography influences the pattern of genetic variation in a population, and thus genomic data of multiple individuals sampled from one or more present-day populations contain valuable information about the past demographic history. Recently, Li and Durbin developed a coalescent-based hidden Markov model, called the pairwise sequentially Markovian coalescent (PSMC), for a pair of chromosomes (or one diploid individual) to estimate past population sizes. This is an efficient, useful approach, but its accuracy in the very recent past is hampered by the fact that, because of the small sample size, only few coalescence events occur in that period. Multiple genomes from the same population contain more information about the recent past, but are also more computationally challenging to study jointly in a coalescent framework. Here, we present a new coalescent-based method that can efficiently infer population size changes from multiple genomes, providing access to a new store of information about the recent past. Our work generalizes the recently developed sequentially Markov conditional sampling distribution framework, which provides an accurate approximation of the probability of observing a newly sampled haplotype given a set of previously sampled haplotypes. Simulation results demonstrate that we can accurately reconstruct the true population histories, with a significant improvement over the PSMC in the recent past. We apply our method, called diCal, to the genomes of multiple human individuals of European and African ancestry to obtain a detailed population size change history during recent times.
W
ITH the rise of new sequencing technologies, it has become easier to obtain genetic data from multiple individuals at many loci. Such data have been providing a new wealth of information from which to estimate popu-lation genetic parameters such as mutation rates, recombi-nation rates, effective population sizes, divergence times, and migration rates. More data should enable more accurate parameter estimation, but it is both theoretically and com-putationally challenging to model the evolution of many individuals.Much can be learned about ancient population history from present-day DNA data, since the genome of each in-dividual is an imperfect mosaic of the genomes of its ancestors. Accurately inferring the past demographic changes of humans has several important applications, including properly account-ing for population structure in association studies and reducaccount-ing confounding effects in inferences about natural selection. It may also help to resolve archaeological and historical questions. Humans are not the only organism for which demography raises important questions. For example, the demography of
Drosophila has very interesting dynamics, as investigated by several recent studies (Haddrill et al. 2005; Thornton and Andolfatto 2006; Wang and Hey 2010).
In humans, ancient effective population size estimates vary widely, as do the time estimates of demographic events such as the out-of-Africa migration. Gronau et al. (2011) used a coalescent-based approach with six diploid genomes
Copyright © 2013 by the Genetics Society of America doi: 10.1534/genetics.112.149096
Manuscript received December 26, 2012; accepted for publication April 7, 2013 Supporting information is available online athttp://www.genetics.org/lookup/suppl/ doi:10.1534/genetics.112.149096/-/DC1.
1These authors contributed equally to this work.
2Corresponding author: Department of EECS, University of California, 683 Soda Hall,
each from a different population and estimated that Eura-sians and Africans diverged 38–64 thousand years ago (KYA) and that the effective population size of humans in the ancient past was9000. Gravelet al.(2011) used low-coverage whole-genome data and high-low-coverage exome data tofit a one-bottleneck model followed by exponential growth in European and Asian populations. They estimated that the timing of the out-of-Africa migration was51 KYA and that the effective population size in the ancient past was 7300, which then increased to14,500 at150 KYA.
In their analysis, Gronau et al. considered 37,574 loci each of length 1 kb and, for computational tractability, as-sumed that the loci are all independent and that there is no recombination within each locus. The method employed by Gravelet al.(2011) is based onfitting allele frequency spectra, assuming that all sites are independent. Incidentally, Myers
et al. (2008) investigated the limits of inferring population size changes from the allele frequency spectrum alone and showed that two distinct population size histories may yield exactly the same expected allele frequency spectra. It remains an open question whether taking linkage information into account may remedy the problem of nonidentifiability.
The distribution of lengths of shared identity-by-descent (IBD) tracts between pairs of unrelated individuals is in-formative of recent demographic history. Recently, Palamara
et al.(2012) utilized the empirical distribution of IBD sharing in pairs of 500 Ashkenazi Jewish individuals to infer two rapid population expansions separated by a severe founder event over the past 200 generations. This approach requires
first inferring IBD tracts from data, but the accuracy of exist-ing IBD detection methods has not been fully characterized when the population under consideration has undergone a complex demographic history.
The pairwise sequentially Markovian coalescent (PSMC), recently developed by Li and Durbin (2011) to estimate an arbitrary piecewise constant population size history, does take linkage information into account and efficiently models recombination between sites, using the sequentially Markov coalescent (McVean and Cardin 2005; Marjoram and Wall 2006) for a pair of sequences. The PSMC is based on a hid-den Markov model (HMM) in which the hidhid-den state at a given position corresponds to the coalescence time of the two lineages at that position and the observed state corre-sponds to the observed genotype (homozygous/heterozygous) at the position. As one moves along the sequence, the co-alescence time may change as a result of recombination, and the spatial distribution of homozygous and heterozygous sites is informative of the distribution of coalescence times, which depends on the past population sizes. While this ele-gant approach produces reasonably accurate population size estimates overall, its accuracy in the very recent past is ham-pered by the fact that, because of the small sample size, few coalescence events occur in that period. As a consequence, the information in the pattern of genetic variation for a pair of sequences is insufficient to resolve very recent demo-graphic history.
The major obstacle to generalizing the PSMC to multiple sequences is the explosion in the state space with the number of sequences; the number of distinct coalescent tree topolo-gies grows superexponentially with the number of leaves, and we furthermore need to consider edge-weighted trees (i.e., include time information). In a related line of research, inter-esting progress has been made (Hobolthet al.2007; Dutheil
et al.2009; Mailundet al.2011) in performing“ancestral pop-ulation genomic”inference under a coalescent HMM, but its applicability is limited to only a modest number of sequences, again due to the explosion in the state space.
In this article, we describe an alternative method that is efficient in the number of sequences, while retaining the key generality of the PSMC in incorporating an arbitrary piece-wise constant population size history. More precisely, the computational complexity of our method depends quadratically on the number of sequences, and the computation involved can be easily parallelized. As more sequences are considered, we expect to see a larger number of coalescence events during the recent past and should be able to estimate recent population sizes at a higher resolution. With only two sequences, the distribution of coalescence events is shifted toward the ancient past, relative to the distribution of the time a new lineage joins a coalescent tree for multiple sequences. Thus, even if all sequences are considered pairwise, the resolution in the recent past may not be as clear as that achieved by jointly modeling multiple sequences.
The input to our method, which is also based on an HMM, is a collection of haplotype sequences. At present, our method assumes that mutation and recombination rates are given, and it employs the expectation-maximization (EM) algorithm to infer a piecewise constant history of population sizes, with an arbitrary number of change points.
Our work generalizes the recently developed sequentially Markov conditional sampling distribution (SMCSD) frame-work (Paul et al. 2011) to incorporate variable population size. This approach provides an accurate approximation of the probability of observing a newly sampled haplotype given a set of previously sampled haplotypes, and it allows one to approximate the joint probability of an arbitrary num-ber of haplotypes. Through a simulation study, we demon-strate that we can accurately reconstruct the true population histories, with a significant improvement over the PSMC in the recent past. Moreover, we apply our method to the genomes of multiple human individuals of European and African ancestry to obtain a detailed population size change history during recent times. Our software, called demographic inference using composite approximate likeli-hood (diCal), is publicly available at https://sourceforge. net/projects/dical.
Notation and a Review of the SMCSD Framework
Our work stems from the SMCSD framework (Paul et al.
sampled haplotypes. In what follows, we briefly review the key concepts underlying the SMCSD model.
We consider haplotypes each of lengthLfrom the same genomic region. Suppose we have already observedn hap-lotypes, On = {h1,. . .,hn} sampled at random from a
well-mixed population; note that some of the observed hap-lotypes may be identical. In this article, we use the terms
“sites”and“loci”interchangeably. Recombination may occur between any pair of consecutive loci, and we denote the set of potential recombination breakpoints by B = {(1, 2),. . ., (L21,L)}. Given a haplotypeh, we denote byh[ℓ] the allele
at locus ℓ and by h[ℓ: ℓ9] (for ℓ # ℓ9) the subsequence (h[ℓ],. . .,h[ℓ9]).
As described in Paul and Song (2010), given the geneal-ogyAOnfor the already observed sampleOn, it is possible to
sample a conditional genealogy C for the additional haplo-type according to the following description: An ancestral lineage in C undergoes mutation at locus ℓ at rate uℓ/2 according to the stochastic mutation transition matrix P(ℓ).
Further, as in the ordinary coalescent with recombination, an ancestral lineage inCundergoes recombination at break-pointb2Bat raterb/2, giving rise to two lineages. Each pair of lineages withinCcoalesces with rate 1, and lineages inC get absorbed into the known genealogy AOn at rate 1 for each pair of lineages. See Figure 1A for an illustration.
Unfortunately, we do not generally have access to the true genealogyAOn, and marginalizing over all possibilities is a challenging problem. However, Paul and Song (2010) showed that the diffusion-generator approximation de-scribed in De Iorio and Griffiths (2004a,b; Griffiths et al.
2008) implies the following approximation to AOn, which simplifies the problem considerably.
Approximation 1 (the trunk genealogy)
Approximate AOn by the so-called trunkgenealogy A*On in which lineages do not mutate, recombine, or coalesce with one another, but instead form a nonrandom“trunk” extend-ing infinitely into the past, as illustrated in Figure 1B. Al-thoughA*
On is not a proper genealogy, it is still possible to sample a well-defined conditional genealogyCfor the addi-tional haplotype given A*
On in much the same way as de-scribed above, except that rates need to be modified. Specifically, lineages withinCevolve backward in time sub-ject to the following events:
Mutation: Each lineage undergoes mutation at locusℓwith rateuℓaccording toP(ℓ).
Recombination: Each lineage undergoes recombination at breakpointb2Bwith raterb.
Coalescence: Each pair of lineages coalesces with rate 2.
Absorption: Each lineage is absorbed into a lineage of A*
On with rate 1.
The genealogical process described above completely char-acterizes a conditional sampling distribution (CSD), which Paul and Song (2010) denoted byp^PS. Observe that the rate
of absorption is the same as before, but the rates for
muta-tion, recombinamuta-tion, and coalescence are each a factor of 2 larger than those mentioned earlier. Intuitively, this rate ad-justment accounts for using the (inexact) trunk genealogy
A*
On, which remains static. Note that the adjustment follows as a mathematical consequence of the diffusion-generator approximation (De Iorio and Griffiths 2004a,b; Griffiths
et al. 2008), and it is supported by the fact that the CSD ^
pPShas been shown to be exact for a one-locus model with
parent-independent mutation (Paul and Song 2010). It can be deduced from the diffusion-generator approx-imation that p^PSðajOnÞ, the conditional probability of
sam-pling an additional haplotype a given a set of previously sampled haplotypesOn, satisfies a recursion. Unfortunately,
this recursion is computationally intractable to solve for even modest-sized data sets. To address this issue, Paul et al.
(2011) proposed further approximations, described below, to obtain a CSD that admits efficient implementation, while retaining the accuracy ofp^PS.
Figure 1 Illustration of a conditional genealogyCfor a three-locus model. The three loci of a haplotype are each represented by a solid circle, with the color indicating the allelic type at that locus. Mutation events, along with the locus and resulting haplotype, are indicated by small arrows. Recombi-nation events, and the resulting haplotype, are indicated by branching events. Absorption events are indicated by dotted horizontal lines. (A) The true genealogyAOnfor the already observed sampleOn. (B) Approximation
by the trunk genealogyA*
On. Lineages in the trunk do not mutate,
Approximation 2 (sequentially Markov CSD)
A given conditional genealogy Ccontains amarginal condi-tional genealogy (MCG) for each locus, where each MCG comprises a series of mutation events and the eventual absorption into a lineage of the trunk A*
On. See Figure 1C for an illustration. The key insight (Wiuf and Hein 1999) is that we can generate the conditional genealogy as a se-quenceof MCGs across the sequence, rather than backward in time. Although the sequential process is actually not Markov, it is well approximated (McVean and Cardin 2005; Marjoram and Wall 2006; Paul et al. 2011) by a Markov process, using a two-locus transition density. Ap-plying this approximation to p^PS yields the sequentially MarkovCSD,p^SMC.
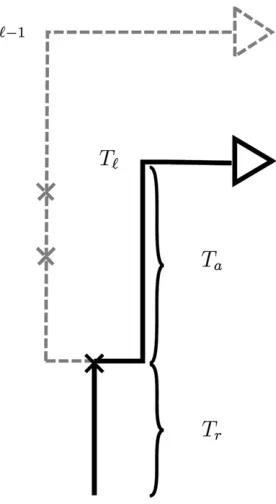
Conditional on the MCGCℓ21at locusℓ21, the MCGCℓat locusℓcan be sampled byfirst placing recombination events ontoCℓ21according to a Poisson process with rater(ℓ21,ℓ). If
no recombination occurs, Cℓis identical toCℓ21. If
recombi-nation does occur,Cℓis identical toCℓ21up to the timeTrof
the most recent recombination event. At this point, the lin-eage at locusℓ, independently of the lineage at locusℓ21, proceeds backward in time until being absorbed into a line-age of the trunk. This transition mechanism for the Markov process is illustrated in Figure 2. McVean and Cardin (2005) use this approximation as well, while the transition process in Marjoram and Wall (2006)doesallow the lineage to co-alesce back into itself.
GivenCℓ, mutations are superimposed onto it according to a Poisson process with rateuℓ. The MCG is absorbed into a trunk lineage corresponding to some haplotypeh, which specifies an“ancestral”alleleh[ℓ]. This allele is then
prop-agated to the present according to the superimposed mutations and the transition matrixP(ℓ), thereby
generat-ing an allele at locusℓ of the additional haplotypea. We refer to the associated distribution of alleles as the emis-sion distribution.
The generative process described above for the SMCSD ^
pSMC can be formulated as an HMM, in which the hidden
state at locusℓcorresponds to the MCGCℓ, excluding muta-tion events: We denote the hidden state at locus ℓ in the HMM bySℓ= (Tℓ,Hℓ), whereTℓ2[0,N) is the absorption time andHℓ2 Onis the absorption haplotype. The emission
at locus ℓ corresponds to the allele a[ℓ]. See Paul et al.
(2011) for explicit expressions for the initial, transition, and emission densities in the case of a constant population size.
Incorporating Variable Population Size
Here, we extend the SMCSD framework described in the previous section to incorporate variable population size. A history of relative effective population size is described by the function
lðtÞ ¼NðtÞ Nref
; (1)
wheret2[0,N), witht= 0 corresponding to the present time, Nref is some reference effective population size, and N(t) is the effective population size at timetin the past. The population-scaled recombination and mutation rates are
de-fined with respect toNref. Specifically, forb= (ℓ21,ℓ), we
definerb= 4Nrefrb, whererbdenotes the recombination rate
per generation per individual between lociℓ21 andℓ, and
uℓ= 4Nrefmℓ, wheremℓdenotes the mutation rate per gener-ation per individual at locusℓ.
Initial density
In the case of a constant population size, the absorption timeTℓ for locusℓfollows an exponential distribution, but with a vari-able population size the absorption time is described by a non-homogeneous Markov chain. See Griffiths and Tavaré (1994) for a more thorough discussion of the coalescent with variable population size. As in the constant population size case, how-ever, the prior distribution of absorption haplotype Hℓis still uniform over the observed haplotypesOnin the trunk
geneal-ogy. In summary, the marginal density of the hidden statesℓ= (t,h) is given by
zðlÞðt;hÞ ¼ nh
lðtÞexp
2n
Z t
0
1
lðtÞdt
; (2)
Figure 2 Illustration of the sequentially Markov approximation in which the absorption timeTℓat locusℓis sampled conditionally on the
absorp-tion timeTℓ21=tℓ21at the previous locus. In the marginal conditional
genealogyCℓ21for locusℓ21, recombination breakpoints are realized as
a Poisson process with rate r(ℓ21,ℓ). If no recombination occurs, Cℓ is
identical to Cℓ21. If recombination does occur, as in the example here, Cℓis identical toCℓ21up to the timeTrof the most recent recombination
event. At this point, the lineage at locusℓ, independently of the lineage at locusℓ21, proceeds backward in time until being absorbed into a lineage of the trunk. The absorption time at locusℓisTℓ=Tr+Ta, whereTais the
where nhdenotes the number of haplotypes inOnthat are
identical to haplotypeh.
Transition density
To obtain the transition density, we need to take into account recombination, which causes changes in the hidden state of our HMM. If no recombination occurs between loci ℓ21 andℓ(prior toTℓ21), thensℓ=sℓ21. If a recombination
event occurs between lociℓ21 andℓ, the absorption time for locus ℓ will be Tℓ = Tr + Ta, where Tr is the time of
recombination (which must be less than Tℓ21 and Tℓ) and Ta is the remaining additional time to absorption, as
illus-trated in Figure 2. To compute the transition density, we need to convolve the hidden variables Tr and Ta. Letting b= (ℓ21,ℓ) for ease of notation, the transition density from
sℓ21= (t,h) tosℓ= (t9,h9) is given by
fðlÞðsℓjsℓ21Þ ¼e2rbtds
ℓ21;sℓþ
R
minðt;t9Þ0 rbe2rb
tr
"
zðlÞðt9;h9Þ
RN
tr z ðlÞðtÞdt
#
dtr;
(3)
where z(l)(t9, h9) is defined in (2) and zðlÞðtÞ:¼
P
h2OnzðlÞðt;hÞ. Note that
RN
0 zðlÞðtÞdt¼1.
Emission probability
The probability of emitting alleleaat locusℓ(i.e.,a[ℓ] =a) given hidden statesℓ= (t,h) is
jðlÞðajsℓÞ ¼e2uℓtXN m¼0
1
m!ðuℓtÞ
mhPðℓÞmi
h½ℓ;a: (4) This is the same emission probability as in Paulet al.(2011), but when we discretize the state space in the following sec-tion we have to take into account the effects of variable population size.
Sequentially Markov conditional sampling probability
Using the initial, transition, and emission densities described above, we can write down an integral recursion for the forward probability fSMCðlÞ ða½1:ℓ;sℓÞ of observing the first
ℓ alleles a[1],. . .,a[ℓ] and the state at locus ℓ being sℓ. For 2#ℓ#L,
fSMCðlÞ ða½1:ℓ;sℓÞ
¼jðlÞða½ℓjsℓÞ RfðlÞðsℓjsℓ21ÞfSMCðlÞ ða½1:ℓ21;sℓ21Þdsℓ21;
(5)
with base case
fSMCðlÞ ða½1;s1Þ ¼jðlÞða½1js1Þ zðlÞðs1Þ:
Finally, the conditional probability of sampling an additional haplotypeahaving previously observedOn= {h1,. . .,hn} is
given by
^
pðSMClÞ ðajOnÞ ¼ Z
fSMCðlÞ ða½1:L;sLÞdsL: (6)
As with the constant population size HMM, a backward algorithm can also be devised to compute p^ðSMClÞ ðajOnÞ,
al-though we do not present it here.
Discretizing the State Space
To efficiently evaluate the recursion (5) and the marginal-ization (6), we discretize the time component of the state space. We partition time (in units of 2Nrefgenerations) into d intervals, demarcated by
t0¼0,t1,⋯,td¼N;
and assume thatl(t) defined in (1) has a constant valueli
in each intervalDi:= [ti21,ti), fori= 1,. . .,d,
lðtÞ ¼X d
i¼1
1ðti21#t,tiÞli; (7)
where 1() is the indicator function. Using this piecewise constantl(t), we can write the HMM probabilities in a more workable form, as detailed below.
Initial probability
For t 2 Di, (7) implies that the initial density (2) can be
written as
zðlÞðt;hÞ ¼nh
li
e2nðt2ti21Þ=liY i21
j¼1
e2nðtj2tj21Þ=lj: (8)
To obtain the initial probability in the time-discretized model, we integrate over the time intervalDito obtain
^
zðlÞðDi;hÞ ¼
Z
Di
zðlÞðt;hÞdt¼nh n w
ðiÞ; (9)
where
wðiÞ¼
h
12e2nðti2ti21Þ=lii Y i21
m¼1
e2nðtm2tm21Þ=lm;
which corresponds to the probability that a lineage in the conditional genealogy gets absorbed into the trunk geneal-ogy within the intervalDi.
Transition probability
For the transition density from statesℓ21= (t,h) to statesℓ= (t9,h9), we letidenote the time interval index such thatt2 Di= [ti21,ti) and letjdenote the index such thatt92Dj=
[tj21,tj). After some simplification, the transition density (3)
fðlÞðsℓjsℓ21Þ
¼e2rbtds
ℓ21;sℓþ
nh
lj
e2nðt92tj21Þ=lj Y
j21
m¼1
e2nðtm2tm21Þ=lm
" #
Rði;t;j;t9Þ;
(10)
whereR(i,t;j,t9) is defined in theAppendix.
To compute the transition probability in the time-discretized model, we use Bayes’rule and integrate the transition density function to obtain
^
fðlÞDj;h9jDi;h
¼ 1
^zðlÞ ðDi;hÞ
Z
Dj
Z
Di
fðlÞðt9;h9jt;hÞzðlÞðt;hÞdtdt9
¼:yðiÞdi;jdh;h9þzði;jÞnh9 n;
(11)
where^zðlÞðDi;hÞis defined in (9), and explicit formulas for
y(i) and z(i,j) are provided in the Appendix. The first term
arises from the case of no recombination, while the second term accounts for the case when recombination does occur. Note thaty(i)andz(i,j)depend only on the time interval and
not on the absorbing haplotype.
Emission probability
Although thus far the emission density has not been affected by the population size being variable, discretizing time intro-duces dependence on the functionl(t). Letadenote the emit-ted allele of the newly sampled haplotypeaat locus ℓ. Using Bayes’rule again and then integrating over the absorption time interval gives
^
jðlÞðajDi;hÞ
¼ 1
^
zðlÞðDi;hÞ
Z
Di
jðlÞðajt;hÞzðlÞðt;hÞ dt
¼ PN
m¼0
vðiÞ ðmÞ PðℓÞm h½ℓ;a;
(12)
where a formula forv(i)(m) is provided in theAppendix.
Discretizing time and grouping parameters
To discover periods of population expansion or contraction with the SMCSD, it is necessary to specify a time discretiza-tion that has high resoludiscretiza-tion during such time periods. This is challenging in cases where we have littlea priori knowl-edge of the demographic history. Ideally the (unknown) co-alescence events would be distributed uniformly across the time intervals of our discretization; if very few coalescence events occur in an interval, the corresponding population size will often be overestimated, leading to runaway behav-ior. In our implementation, we employ a heuristic method, detailed in theAppendix, for choosing the discretization time pointst1,. . .,td21based on the spacing of SNPs in the data,
with the aim for coalescence events to be distributed evenly
across the d time intervals. Alternatively, users have the option of specifying their own discretization time points to achieve a desired resolution.
As noted by Li and Durbin (2011), allowing separate population size parameters during time intervals that con-tain too few expected coalescence events can lead to inac-curate estimates. Following their lead, we mitigate this problem by constraining a few consecutive time intervals to have the same population size.
Modifying the Trunk Genealogy
The trunk genealogy approximation in Paul and Song (2010) was derived by making an approximation in the diffusion process dual to the coalescent for a constant population size. It yields an accurate approximate CSD in the case of a popu-lation at equilibrium, and for parent-independent mutation models, the CSD becomes exact in the limit as the recombi-nation rate approachesN. However, in the variable popula-tion size setting, we must modify the trunk genealogy approximation for the following reason: In the formulation described earlier, the trunk absorbs a lineage in the condi-tional genealogyCat the ratendt/l(t) at timet. Our HMM uses this inverse dependence and the inferred distribution of absorption times to estimate the population size scaling functionl(t). In reality, at timetthe number of ancestral lineages isn(t)#nand a lineage inCgets absorbed at rate
n(t)dt/l(t). Hence, assuming that the trunk genealogy con-tains n lineages in every time interval causes absorption events to occur too quickly, leaving the ancient population sizes overestimated. We later provide empirical results that support this intuition (see Figure 8).
To remedy the problem described above, in our work we use the expected number of lineages in the trunk to modify the rate of absorption, while still forbidding mutation, re-combination, and coalescence in the trunk genealogy. Let
An(t) denote the number of lineages at time t ancestral to
a sample of sizenat time 0. Under the coalescent, the prob-ability distribution of An(t) is known in closed form (Tavaré
1984), but using it directly to compute the expected number of lineages leads to numerically unstable results, due to alter-nating signs. However, one can obtain the following expres-sion for the expectation (Tavaré 1984, equation 5.11), which is numerically stable:
nðtÞ:¼E½AnðtÞ
¼X
n
i¼1
exp 2 i 2 Z t 0 1
lðtÞdt
nðn21Þ⋯ðn2iþ1Þ
nðnþ1Þ⋯ðnþi21Þ ·ð2i21Þ:
(13)
For simplicity, we assume that throughout time interval
Di = [ti21, ti), there are nðti21Þ lineages, creating what
To modify the HMM formulas, we simply replace each
nin (9), (11), and (12) with the appropriatenðÞfrom (13), except in the rationh/nmultiplyingw(i)in (9) and the ratio
nh9=nmultiplyingz(i,j)in (11) (these ratios are kept intact to preserve the relative contributions of different haplotypes). Note that the trunk genealogy never actually loses any of the
n lineages, and absorption into any of the n lineages is allowed at all times; we are modifying the absorption rate only as a function of time. In the case of two sequences (one trunk lineage and one additionally sampled lineage),
nðtÞ ¼1 for allt, so the wedding-cake approximation does not change the model. Making the number of lineages more accurate by using this approximation improves our ability to estimate absorption times and therefore popu-lation sizes.
Population Size Inference with Expectation Maximization
To utilize all our data in an exchangeable way, we use a“leave-one-out”approach where we leave each haplotype out in turn and perform the SMCSD computation. More pre-cisely, we define the leave-one-out composite likelihood (LCL) as
LLCLðl;h1;. . .;hnÞ ¼
Yn
i¼1 ^
pðSMClÞ ðhijh1;. . .;hi21;hiþ1;. . .;hnÞ:
(14)
Because we compute the conditional sampling probability through dynamic programming and the probability depends on the effective population sizes in complex ways, we cannot
find the maximum-likelihood estimates analytically. Although direct optimization could be used, it is computationally expensive. Thus we employ an EM algorithm to estimate the piecewise constant function l(t). Our current
implementa-tion assumes that the populaimplementa-tion-scaled recombinaimplementa-tion rates
rband mutation ratesuℓ, as well as the mutation transition matrices P(ℓ), are given and fixed. For computational
sim-plicity we currently assume thatuℓandP(ℓ)are the same for each site ℓand rbis the same for each pair of consecutive
sites. The time discretization is fixed throughout the EM algorithm. The output of the algorithm is an estimated pop-ulation size scaling factorlifor each intervalDi= [ti21,ti).
To convert these scaling factors into diploid effective popu-lation sizes, one would need to multiply by Nref. Similarly,
the discretization times can be converted to years by multi-plying them by 2Nrefg, where g is an average number of
years per generation.
The standard Baum–Welch algorithm gives an EM pro-cedure for learning the parameters of an HMM in which the transition probabilities and emission probabilities are trea-ted as unknown independent parameters. However, our HMM is more constrained than a general one, with (dn)2+ d|S|2 (where S is the alphabet of alleles) unknown Figure 3 Illustration of the wedding-cake genealogy approximation, in
which the varying thickness of a lineage inA*
Onschematically represents
the amount of contribution to the absorption rate. As shown, the wedding-cake genealogy never actually loses any of thenlineages, and absorption into any of thenlineages is allowed at all times; we are modifying the absorption rate only as a function of time.
probabilities f^ðlÞðDj;h9jDi;hÞ and ^j
ðlÞ
ða½ℓjDi;hÞ that are
functions of thedparametersl1,. . .,ld. During the E-step,
we compute the matrix [Aij] of the expected number ofDito
Dj transitions. We also compute the matrix [Ei(b)] of the
expected number of times allelebis emitted from time in-tervali. Then, during the M-step we maximize the likelihood function
lð1kþ1Þ;. . .;l
ðkþ1Þ
d
¼argmax
lðkÞ Q
i;j
h
^
fðl ðkÞÞ
DjDi
iAðijkÞQ
i;b
h
^jðlðkÞ
ÞðbjDiÞ
iEðikÞðbÞ
;
(15)
where f^ðlÞðDjjDiÞ and^j
ðlÞ
ðbjDiÞ refer to the transition and
emission probabilities where we have marginalized over the absorption haplotype.
We initialize the algorithm withli= 1 for alli= 1,. . .,d. To compute [Aij] and [Ei(b)], we use the forward and
back-ward probabilities of our HMM. The exact details of making this step computationally efficient are provided in the Appen-dix. After the E-step, we use the Nelder–Mead optimization routine (Nelder and Mead 1965) to update the parameters in the M-step. Because of local maxima in the likelihood surface, we run this optimization routine several times (10) with different starting conditions and then retain the estimates with the largest likelihood. In the analysis discussed in this article, we ran the EM procedure for 20 iterations to obtain convergence. As pointed out by Li and Durbin (2011), run-ning the EM procedure for many iterations often leads to overfitting.
Results
We compared the performance of our method, diCal, with that of PSMC (Li and Durbin 2011) on both simulated and real data. We compared diCal, using an n-haplotype leave-one-out scheme (Equation 14), with PSMC, using the same
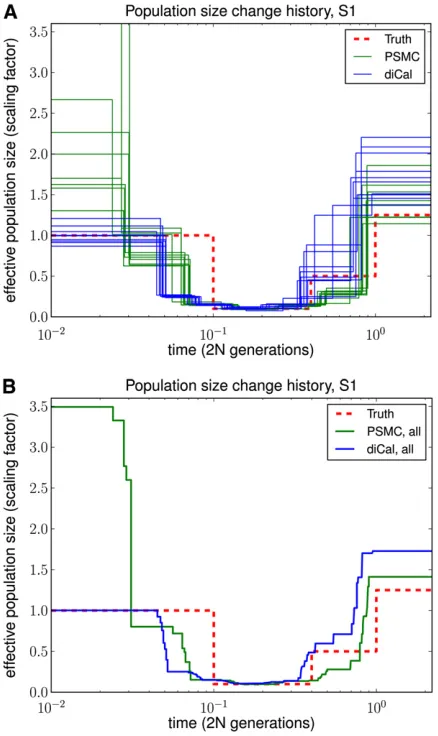
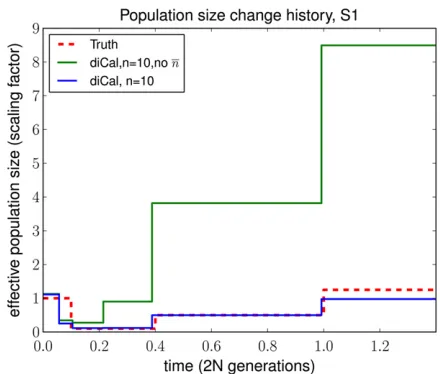
Figure 5 Results of PSMC and diCal on data sets simulated under history S1 with sample size n= 10 and four alleles (A, C, G, and T). PSMC significantly overestimates the most recent population size, whereas we obtain good estimates up until the very ancient past. (A) Results for 10 different data sets. (B) Average over the 10 data sets.
nhaplotypes paired up sequentially (i.e., haplotype 1 paired with haplotype 2, haplotype 3 with haplotype 4, etc.).
Unless stated otherwise, we used 16 discretization intervals and inferred seven free population size parameters in both PSMC and diCal. In the notation introduced by Li and Durbin (2011), the pattern we used is“3 + 2 + 2 + 2 + 2 + 2 + 3,”which means that thefirst parameter spans the
first three discretization intervals, the second parameter spans the next two intervals, and so on. We found that grouping a few consecutive intervals to share the same pa-rameter significantly improved the accuracy of estimates. For example, due to an insufficient number of coalescence events, thefirst and last intervals are particularly susceptible to runaway behavior if they are assigned their own free parameters, but grouping them with their neighboring inter-vals prevented such pathological behavior. See Supporting Information,File S1for further details of running PSMC and our method.
The accuracy of population size inference on simulated data
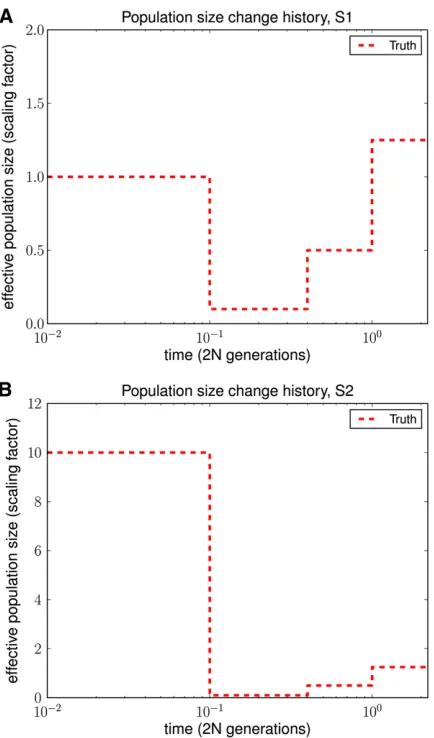
We used ms (Hudson 2002) to simulate full ancestral re-combination graphs (ARGs) under two different population histories and then superimposed a quadra-allelic,finite-sites mutation process on the ARGs to generate sequence data over {A,C,G,T}. As illustrated in Figure 4, both histories contained bottlenecks in the moderately recent past. History S2 in Figure 4B in addition contained a recent rapid popu-lation expansion relative to the ancient popupopu-lation size. For each history, we simulated 10 independent ARGs forL= 106
sites and 10 haplotypes, with the population-scaled recom-bination rate set to 0.01 per site in ms. To add mutations, we set the population-scaled mutation rate to 0.014 per site and used the quadra-allelic mutation matrix described inFile S1. As shown in Figures 5 and 6, our method performed much better in the recent past than did PSMC. PSMC often had the type of runaway behavior shown in Figure 6, where it overestimated the most recent population size by over three orders of magnitude. We note that our method began to lose accuracy for more ancient times, most likely because ancient absorption events in a 1-Mb region are few and sparsely distributed in time in the leave-one-out SMCSD computation. Both methods tend to smooth out sudden changes in population size, which is why the inferred recov-ery time from a bottleneck is more recent than it should be. To quantify the improvement in accuracy of our method
over PSMC, we used an error metric described in Li and Durbin (2011), which is a normalized integral of the abso-lute difference between the true ms history and the inferred history over time. The results, summarized in Table 1, show that our method had a substantially lower overall error than PSMC.
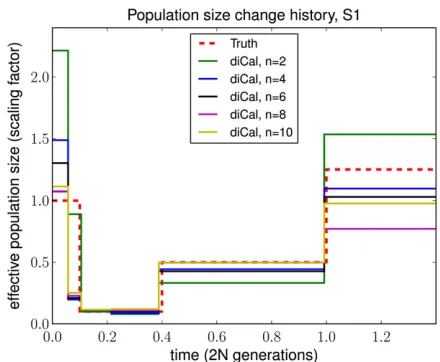
For inference using diCal, we examined the impact of considering more haplotypes on the accuracy of population size estimation. In this study, we focused on history S1 and grouped adjacent parameters tofit roughly with population size change points for illustration purposes. Figure 7 shows qualitatively that increasing the sample sizenmakes our es-timate of the recent population size more accurate. Interme-diate sizes changed little with increasingn, and ancient sizes were somewhat variable depending on the distribution of coalescence events. Note that for n= 2, our method is very similar to PSMC; we compute the transition probabilities slightly differently, but the wedding-cake approximation does not change the model in this case. We used the same error metric mentioned above to quantify the advantage of increas-ing the sample size. As shown in Table 2, the overall error decreased as the sample size increased, with improvement tapering to8–10 haplotypes for this particular history.
Impact of the wedding-cake genealogy approximation
We examined the advantage of using the wedding-cake genealogy approximation in the SMCSD computation, com-pared to assuming an unmodified trunk genealogy. Figure 8 illustrates that the unmodified trunk genealogy leads to overestimation of population sizes in the distant past, as discussed in Modifying the Trunk Genealogy. The wedding-cake genealogy approximation, which adjusts the absorption
Table 1 Goodness-of-fit for PSMC and diCal, averaged over 10 simulated data sets, each with a sample ofn= 10 haplotypes
Simulated history PSMC error diCal error
S1 0.40328 0.10283
S2 0.71498 0.29992
The underlying population size histories are shown in Figure 4. The error metric used is a normalized integral of the absolute difference between the true history and the inferred history over time. These results demonstrate that diCal is substantially more accurate than the PSMC method.
rate by accounting for the expected number of ancestral lineages of the already observed sample, leads to a signifi -cant improvement in the accuracy of population size infer-ence in the ancient past.
Accuracy of estimated coalescence times
To assess the accuracy of estimated coalescence times, we produced the posterior decoding and the posterior mean of the times that a left-out haplotype got absorbed into a wedding-cake genealogy. The data were simulated under the full coalescent with recombination, using ms assuming a constant population size. The true coalescence time at each site was taken as the time the left-out lineage joined the rest of the coalescent tree at that site. As shown in Figure 9, we found that our estimated absorption times closely tracked the true coalescence times.
Results on real data
We applied our method to data from 10 of the 179 human genomes that were sequenced at low coverage and phased as part of the 1000 Genomes pilot project. Five of the individuals were Yorubans from Ibadan, Nigeria (YRI) and
five were Utah residents of central European descent (CEU) (1000 Genomes Project Consortium 2010). To minimize potential confounding effects from natural selection, we chose a 3-Mb region on chromosome 1 with no genes and then used the middle 2 Mb for analysis. We used the human reference (version 36) to create a full multiple-sequence alignment of 10 haplotypes (five diploid individuals) for each of the CEU and YRI populations. Although wefiltered out unphased individuals and sites, thefinal sequences are based on low-coverage short read data, so phasing and imputation errors could affect the accuracy of our coalescence time inference. We assumed a per-generation mutation rate ofm= 1.25·1028per site, which is consistent with recent
studies ofde novo mutation in human trios (Awadallaet al.
2010; Roachet al.2010; Konget al.2012), and a mutation transition matrix estimated from the human and the chimp reference genomes (shown in File S1). For simplicity, we assumed that the per-generation recombination rate r be-tween consecutive bases is constant and equal tom. The gen-eration time was assumed to be 25 years. For a reference population size, we usedNref= 10,000.
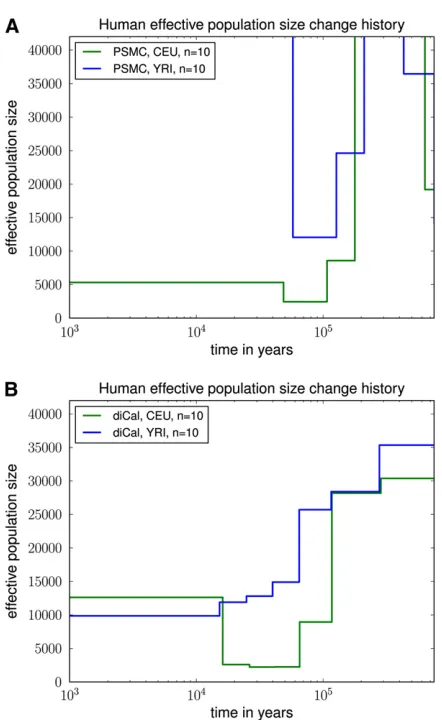
The results of PSMC and our method are shown in Fig-ure 10. PSMC displayed runaway behavior and produced
rather unrealistic results; see Figure 10A, for which we truncated they-axis at 40,000 for ease of comparison with Figure 10B. The data set may be too small for PSMC to work accurately. We note that PSMC was able to produce more reasonable results on simulated data sets, probably because they were generated with much higher mutation and recombination rates, thus representing a larger geno-mic region for humans.
As shown in Figure 10B, our method inferred that CEU and YRI had very similar histories in the distant past up until
117 KYA; discrepancies up to this point are most likely due to few observed ancient coalescence events with the leave-one-out approach. We inferred that the European popula-tion underwent a severe (out-of-Africa) bottleneck starting
117 KYA, with the effective population size dropping by a factor of 12 from 28,000 to 2250. Furthermore, at the level of resolution provided by our time discretization, our results suggest that the European population has recov-ered from the bottleneck to an average effective size of
12,500 for the past 16,000 years.
In contrast to previous findings (e.g., Li and Durbin 2011), our method did not infer a significant drop in the YRI population size during the early out-of-Africa bottleneck phase in Europeans. Instead, the African effective popula-tion size seems to have decreased more gradually over time (possibly due to changes in structure) to an average effective size of10,000 for the past 16,000 years. We note that our results for real data are fairly robust to the choice of
Table 2 Goodness-of-fit for diCal on simulated bottlenecked history S1 for different sample sizes
Sample sizen diCal error
2 0.2914
4 0.1901
6 0.1446
8 0.0802
10 0.0899
We used the same error metric as in Table 1. As the sample sizenincreases, the error decreases, with global improvement tapering at8–10 haplotypes.
discretization, given that a sufficient number of coalescence events occur within each set of grouped intervals.
Run time
The run time of our method isO(Ld(d+n)n), wherenis the number of sequences, Lis the number of bases in each se-quence, anddis the number of time discretization intervals; the run time for each CSD computation isO(Ld(d+n)), and each sequence is left out in turn (although this step is paral-lelizable). The run time for PSMC isO(Ld2P), wherePis the
number of pairs of sequences analyzed. In practice, PSMC can run much faster when consecutive sites are grouped into bins of size 100; a bin is considered heterozygous if it con-tains at least one SNP and homozygous otherwise. Creating a reasonable binning scheme for multiple sequences is less clear. We are currently exploring this avenue, which could significantly improve our runtime and potentially enable whole-genome analysis.
Discussion and Future Work
In this article, we have generalized the recently developed sequentially Markov conditional sampling distribution framework (Paul et al. 2011) to accommodate a variable population size. One important new idea central to the suc-cess and accuracy of our method is the wedding-cake gene-alogy approximation, which modifies the rate of absorption into the trunk by accounting for the varying number of lin-eages over time. Under simulated data, we have shown that our method produces substantially more accurate estimates of the recent effective population size than does PSMC (Li and Durbin 2011).
Applying our method to a 2-Mb intergenic region of chromosome 1 from five Europeans and five Africans, sequenced as part of the 1000 Genomes Project, and using a per-generation mutation rate ofm= 1.25·1028per site,
we have inferred a severe (out-of-Africa) bottleneck in Euro-peans that began 117 KYA, with a drop in the effective population size by a factor of 12. In contrast, we have ob-served a much more mild population size decrease in the African population. We remark that our estimate of the tim-ing of the bottleneck may not be very accurate, since we used only 16 discretization intervals and seven free popula-tion size parameters. Furthermore, all of our inferred times and population sizes would be smaller by a factor of 2 if we had usedm= 2.5·1028. See Scally and Durbin (2012) for
a more thorough discussion of how new mutation rate esti-mates are changing the way we view ancient population history. An earlier initial human dispersal out of Africa would fit with archaeological evidence of human artifacts dated at 74 KYA in India and 64 KYA in China (Scally and Durbin 2012).
During the recent past, our results demonstrate that the effective population size of Europeans has grown in the past 16,000 years, slightly surpassing the effective population size of Africans, which does not show a growth at this resolution. Recent studies (Gutenkunst et al. 2009; Gravel
et al. 2011) suggest that the European population size re-cently grew much faster than the African population size, although the sample size we considered is not large enough to confirm this.
The main strength of our method is in the recent past. Large-scale sequencing studies (Coventryet al.2010; Keinan and Clark 2012; Nelson et al. 2012) of a subset of genes suggest that humans underwent recent explosive population growth. Our method should be well equipped to infer such recent demographic histories, but we would need to con-sider a very large sample to accurately infer the rate of expansion and the time of onset. Because of issues of com-putational speed and memory footprint, our current imple-mentation of the SMCSD computation can handle up to20 haplotypes and a few megabases, but we are in the process
of exploring ways to increase the scalability. One way in which we should be able to reduce our run time is by in-corporating recently developed algorithms for blockwise HMM computation (Paul and Song 2012), which have been shown to result in a speedup of several orders of magnitude for large data sets.
All the results in this article make use of a leave-one-out approach (Equation 14) instead of the well-used product of approximate conditionals (PAC) method proposed by Li and Stephens (2003). Briefly, the PAC approach utilizes the ap-proximate likelihoodp^ðhsð1ÞÞp^ðhsð2Þjhsð1ÞÞ⋯p^ðhsðnÞjhsð1Þ;. . .; hsðn21ÞÞ, where p^ is an approximate conditional sampling distribution and s is some permutation of {1,. . .,n}. A well-known drawback of this approach is that different
per-mutations may produce vastly different likelihoods. Li and Stephens suggested averaging the PAC likelihood over sev-eral random permutations to alleviate this problem and this strategy seems to work reasonably well in practice. In our work, we have avoided the problem by adopting the leave-one-out approach, which yields accurate estimates of popu-lation sizes for the recent past, but not as good results for the ancient past. Employing the PAC approach may produce accurate estimates for all times, but a challenge that needs to be addressed in the SMCSD framework is that the wed-ding-cake genealogy, which is based on thepriorexpectation of the number of lineages, may not be accurate when there are few lineages, since coalescence times are more variable when they involve fewer lineages. We are working on im-proving the accuracy of the SMCSD computation by using theposteriorabsorption time distributions in a recursive fash-ion so that locus-specific absorption rates tailored to data can be used. This approach, together with the PAC model, should yield more accurate estimates of population sizes.
One factor that we have not investigated is the impact of variable recombination (and/or mutation) rates, although it is conceptually straightforward for our method to accom-modate them. We have chosen not to incorporate recombi-nation rate variation into our present implementation as it would make the method even more computationally expen-sive, since the transition probabilities would then be potentially different at each site. In addition, most fine-scale recombina-tion maps (Crawfordet al.2004; McVeanet al.2004; Fearn-head and Smith 2005; Chanet al.2012) are inferred under the assumption of a constant population size, which is exactly the assumption we arenotmaking. We also note that Li and Dur-bin (2011) found that recomDur-bination hotspots did not affect their results significantly and that the important parameter is the average recombination rate.
A good choice of time discretization is critical to the performance of both diCal and PSMC. It is better to subdivide time more finely during periods with small population size than during periods with large population size when few coalescences occur. However, since the demography is what we are trying to infer, selecting an initial discretization is very difficult. Creating adaptive discretization schemes for co-alescent HMMs is an important area of future research.
We have shown that posterior decodings of diCal enable accurate inference of coalescence times. Using this informa-tion, it should be possible to develop an efficient method of sampling marginal coalescent trees from the posterior distri-bution. We expect such local tree inference to have interesting applications, including genome-wide association studies and tests of selective neutrality.
The SMCSD framework has been recently extended (Steinrücken et al.2013) to incorporate structured pop-ulations with migration. We are currently working on combining this extension with the work presented here to implement an integrated inference tool (to be incorpo-rated into diCal) for general demographic models. Such a method could provide a detailed picture of the demographic
Figure 10 Variable effective population size inferred from real human data for European (CEU) and African (YRI) populations. For each popula-tion, we analyzed a 2-Mb region on chromosome 1 from five diploid individuals (10 haplotypes), assuming a per-generation mutation rate of m = 1.25·1028 per site. (A) The results of PSMC, which had some
runaway behavior and unrealistic results. The data set is probably too small for PSMC to work accurately. (B) The results of diCal. We inferred that the European population size underwent a severe bottleneck117 KYA and recovered in the past 16,000 years to an effective size of
history that created the diversity we see today in humans and other species.
Acknowledgments
We thank the members of our group for helpful discussions, in particular Anand Bhaskar, Jack Kamm, Joshua Paul, and Matthias Steinrücken. This research is supported in part by National Science Foundation Graduate Research Fellowships (to K.H. and S.S.), by a University of California (Berkeley) Regent’s fellowship (to K.H.), and by National Intitutes of Health grant R01-GM094402 and a Packard Fellowship for Science and Engineering (to Y.S.S.).
Literature Cited
1000 Genomes Project Consortium, 2010 A map of human ge-nome variation from population-scale sequencing. Nature 467: 1061–1073.
Awadalla, P., J. Gauthier, R. Myers, F. Casals, F. Hamdanet al., 2010 Direct measure of the de novo mutation rate in au-tism and schizophrenia cohorts. Am. J. Hum. Genet. 87: 316–324.
Chan, A. H., P. A. Jenkins, and Y. S. Song, 2012 Genome-wide
fine-scale recombination rate variation in Drosophila
mela-nogaster. PLoS Genet. 8(12): e1003090.
Coventry, A., L. M. Bull-Otterson, X. Liu, A. G. Clark, T. J. Maxwell
et al., 2010 Deep resequencing reveals excess rare recent
var-iants consistent with explosive population growth. Nat. Com-mun. 1: 131.
Crawford, D. C., T. Bhangale, N. Li, G. Hellenthal, M. J. Rieder
et al., 2004 Evidence for substantialfine-scale variation in
re-combination rates across the human genome. Nat. Genet. 36: 700–706.
De Iorio, M., and R. C. Griffiths, 2004a Importance sampling on coalescent histories. I. Adv. Appl. Probab. 36(2): 417–433. De Iorio, M., and R. C. Griffiths, 2004b Importance sampling on
coalescent histories. II: Subdivided population models. Adv. Appl. Probab. 36(2): 434–454.
Dutheil, J. Y., G. Ganapathy, A. Hobolth, T. Mailund, M. K. Uoyenoyama
et al., 2009 Ancestral population genomics: the coalescent hidden
Markov model approach. Genetics 183: 259–274.
Fearnhead, P., and N. G. C. Smith, 2005 A novel method with improved power to detect recombination hotspots from poly-morphism data reveals multiple hotspots in human genes. Am. J. Hum. Genet. 77: 781–794.
Gravel, S., B. M. Henn, R. N. Gutenkunst, A. R. Indap, G. T. Marth
et al., 2011 Demographic history and rare allele sharing
among human populations. Proc. Natl. Acad. Sci. USA 108: 11983–11986.
Griffiths, R., and S. Tavaré, 1994 Sampling theory for neutral alleles in a varying environment. Philos. Trans. R. Soc. Lond. B Biol. Sci. 344: 403–410.
Griffiths, R. C., P. A. Jenkins, and Y. S. Song, 2008 Importance sampling and the two-locus model with subdivided population structure. Adv. Appl. Probab. 40(2): 473–500.
Gronau, I., M. J. Hubisz, B. Gulko, C. G. Danko, and A. Siepel, 2011 Bayesian inference of ancient human demography from individual genome sequences. Nat. Genet. 43: 1031– 1034.
Gutenkunst, R. N., R. D. Hernandez, S. H. Williamson, and C. D. Bustamante, 2009 Inferring the joint demographic history of
multiple populations from multidimensional SNP frequency data. PLoS Genet. 5(10): e1000695.
Haddrill, P. R., K. R. Thornton, B. Charlesworth, and P. Andolfatto, 2005 Multi-locus patterns of nucleotide variability and the de-mographic and selection history ofDrosophila melanogaster pop-ulations. Genome Res. 15: 790–799.
Hobolth, A., O. F. Christensen, T. Mailund, and M. H. Schierup, 2007 Genomic relationships and speciation times of human, chimpanzee, and gorilla inferred from a coalescent hidden Markov model. PLoS Genet. 3(2): e7.
Hudson, R. R., 2002 Generating samples under a Wright-Fisher neutral model. Bioinformatics 18: 337–338.
Keinan, A., and A. G. Clark, 2012 Recent explosive human pop-ulation growth has resulted in an excess of rare genetic variants. Science 336(6082): 740–743.
Kong, A., M. L. Frigge, G. Masson, S. Besenbacher, P. Sulemet al., 2012 Rate of de novo mutations and the importance of father’s age to disease risk. Nature 488(7412): 471–475.
Li, H., and R. Durbin, 2011 Inference of human population history from individual whole-genome sequences. Nature 10: 1–5. Li, N., and M. Stephens, 2003 Modelling linkage disequilibrium,
and identifying recombination hotspots using SNP data. Genet-ics 165: 2213–2233.
Mailund, T., J. Y. Dutheil, A. Hobolth, G. Lunter, and M. H. Schierup, 2011 Estimating divergence time and ancestral ef-fective population size of Bornean and Sumatran orangutan sub-species using a coalescent hidden Markov model. PLoS Genet. 7: e1001319.
Marjoram, P., and J. D. Wall, 2006 Fast“coalescent”simulation. BMC Genet. 7: 16.
McVean, G. A., and N. J. Cardin, 2005 Approximating the coales-cent with recombination. Philos. Trans. R. Soc. Lond. B Biol. Sci. 360: 1387–1393.
McVean, G. A. T., S. R. Myers, S. Hunt, P. Deloukas, D. R. Bentley
et al., 2004 Thefine-scale structure of recombination rate
var-iation in the human genome. Science 304: 581–584.
Myers, S., C. Fefferman, and N. Patterson, 2008 Can one learn history from the allelic spectrum? Theor. Popul. Biol. 73: 342– 348.
Nelder, J. A., and R. Mead, 1965 A simplex method for function minimization. Comput. J. 7(4): 308–313.
Nelson, M. R., D. Wegmann, M. G. Ehm, D. Kessner, P. S. Jeanet al., 2012 An abundance of rare functional variants in 202 drug target genes sequenced in 14,002 people. Science 337(6090): 100–104. Palamara, P. F., T. Lencz, A. Darvasi, and I. Pe’er, 2012 Length distributions of identity by descent reveal fine-scale demo-graphic history. Am. J. Hum. Genet. 91(5): 809–822.
Paul, J. S., and Y. S. Song, 2010 A principled approach to deriving approximate conditional sampling distributions in population genetics models with recombination. Genetics 186: 321–338. Paul, J. S., and Y. S. Song, 2012 Blockwise HMM computation for
large-scale population genomic inference. Bioinformatics 28: 2008–2015.
Paul, J. S., M. Steinrücken, and Y. S. Song, 2011 An accurate sequentially Markov conditional sampling distribution for the coalescent with recombination. Genetics 187: 1115–1128. Roach, J. C., G. Glusman, A. F. A. Smit, C. D. Huff, R. Hubleyet al.,
2010 Analysis of genetic inheritance in a family quartet by whole-genome sequencing. Science 328: 636–639.
Scally, A., and R. Durbin, 2012 Revising the human mutation rate: implications for understanding human evolution. Nat. Rev. Genet. 10: 745–753.
Steinrücken, M., J. S. Paul, and Y. S. Song, 2013 A sequentially Markov conditional sampling distribution for structured populations with mi-gration and recombination. Theor. Popul. Biol. (in press).
Tajima, F., 1983 Evolutionary relationship of DNA sequences in
Tavaré, S., 1984 Lines of descent and genealogical processes, and their application in population genetics models. Theor. Popul. Biol. 26: 119–164.
Thornton, K., and P. Andolfatto, 2006 Approximate Bayesian in-ference reveals evidence for a recent, severe bottleneck in a Netherlands population ofDrosophila melanogaster. Genetics 172: 1607–1619.
Wang, Y., and J. Hey, 2010 Estimating divergence parameters with small samples from a large number of loci. Genetics 184: 363–379.
Wiuf, C., and J. Hein, 1999 Recombination as a point process along sequences. Theor. Popul. Biol. 55: 248–259.
Communicating editor: J. Wakeley
Appendix
HMM Formulas
The expressionR(i,t;j,t9) in (10) is defined as
R
i;t;j;t9
¼
RðiÞðtÞ þPki21¼0RðkÞ
; if i,j;
RðjÞðt9Þ þPj21
k¼0RðkÞ
; if i.j;
RðiÞðt∧t9Þ þPik2¼10RðkÞ
; if i¼j;
8 > > > < > > > :
where∧denotes the minimum operator and, foru2[tk21,tk),
RðkÞðuÞ:¼ rblk n2rblk
e2rbuþnðu2tk21Þ=lk2e2rbtk21 Y k21
m¼1
enðtm2tm21Þ=lm;
RðkÞ:¼ rblk n2rblk
e2rbtkþnðtk2tk21Þ=lk2e2rbtk21 Y k21
m¼1
enðtm2tm21Þ=lm:
After the state space has been discretized, we compute the transition probabilities using y(i) (the probability that no
re-combination occurs) andz(i,j)(the probability that recombination does occur),
yðiÞ¼ 1 ^
zðlÞðDi;hÞ
Z ti
ti21
zðlÞðt;hÞe2rbtdt
¼ 1
wðiÞ n nþrbli
Y
i21
k¼1
e2nðtk2tk21Þ=lk
e2rbti212e2rbti2nðti2ti21Þ=li
and
zði;jÞ¼ n wðiÞnh
ℓ21
Z tj
tj21
Z ti
ti21
Z tℓ21∧tℓ
0 rb
e2rbtr z ðlÞðt
ℓ;hℓÞ
RN
tr z
ðlÞðtÞdtz
ðlÞðt
ℓ21;hℓ21Þdtrdtℓ21dtℓ
:¼Zði;jÞþwðjÞ P i∧j21
k¼1
RðkÞ;
where Z(i,j) corresponds to the case when the recombination event occurs during the time intervalD
i∧j (i.e., the latest it
could) andR(k)corresponds to a recombination event in the time intervalD
k.R(k)is defined as before, andZ(i,j)is
Zði;jÞ¼ n wðiÞnh
ℓ21
Z tj
tj21
Z ti
ti21
Z tℓ21∧tℓ
tði∧jÞ21
rbe2rbtr z ðlÞðt
ℓ;hℓÞ
RN
tr z
ðlÞðtÞdtzðlÞðtℓ21;hℓ21Þdtrdtℓ21dtℓ:
Zði;jÞ¼ wðjÞ
wðiÞfðiÞ; if i,j
fðjÞ; if i.j
1
wðiÞ
rbli nþrbli
e2rbti2122e2nðti2ti21Þ=li2rbti212 rbli
n2lir
e2rbti2122nðti2ti21Þ=li
þ ð 2n2
n2lirÞðnþlirÞe
2rbti2nðti2ti21Þ=liÞ Y i21
m¼1
e2nðtm2tm21Þ=lm; if i¼j;
8 > > > > > > > > > > > > < > > > > > > > > > > > > :
where we define
fðiÞ:¼e2rbti21þ lirb
n2lirb
e2nðti2ti21Þ=li2rbti212 n
n2lirb e2rbti:
To compute the emission probabilities we definev(i)(k) below,
vðiÞðkÞ:¼ nðuℓÞ k
liwðiÞk!
enti21=liY i21
j¼1
e2nðtj2tj21Þ=ljX k
j¼0
c2i ðjþ1Þ k! ðk2jÞ!
h
e2citi21tk2j
i212e2citit
k2j i
i
;
where
ci:¼uℓþ n
li:
Computation of the Expected Transition Counts During the E-Step
Naively, if we compute the expected number of transitions from state sℓ21 = (Di, hℓ21) to state sℓ = (Dj, hℓ) and then marginalize over the haplotypes, we obtain anO(n2) algorithm. To improve the run time, we can decompose the probability
that a transition is used between locusℓ21 andℓinto a part that depends on the absorption haplotype and a part that depends on the absorption time interval, and thus we can reduce the run time to O(n). First we compute the posterior probabilityA(ℓ)(s
ℓ21,sℓ) that a particular transition is used between locusℓ21 andℓ, in terms of the discretized forward and backward probabilitiesFℓ() andBℓ(). Let the newly sampled haplotype have alleleaat locusℓ, soa[ℓ] =a. Then
AðℓÞðsℓ21;sℓÞ ¼p^ð1aÞFℓ21ðsℓ21Þ f^ðlÞðsℓjsℓ21Þ ^jðlÞðajsℓÞ BℓðsℓÞ:
Now we marginalize over the haplotypes, plugging in the transition density formula
P
hℓ21
P
hℓ
AðℓÞðsℓ21;sℓÞ ¼ ^1
pðaÞ X
hℓ21
X
hℓ
Fℓ21ðsℓ21Þ f^ðlÞðsℓjsℓ21Þ ^jðlÞðajsℓÞ BℓðsℓÞ
AðℓÞDi;Dj
¼ 1
^
pðaÞ X
hℓ21
X
hℓ
Fℓ21ðsℓ21Þ ^jðlÞðajsℓÞ BℓðsℓÞ
yðiÞdsℓ21;sℓþzð
i;jÞnhℓ
n
¼ ^1 pðaÞ
" di;jyðiÞ
X
h
Fℓ21ðDi;hÞ^jð
lÞ
ðajDi;hÞBℓðDi;hÞ
!
þ zði;jÞ P hℓ21
Fℓ21ðsℓ21Þ !
P
hℓ
nhℓ
n^j
ðlÞ
ða jsℓÞBℓðsℓÞ
!#
;
which is linear innsince we are only ever summing over one haplotype. To get the expected transition counts, we then sum over all the breakpoints, soAij¼
PL
Discretizing Time
With an ideal time discretization, coalescence events would be uniformly distributed across intervals, but inferring the distribution of coalescence times is equivalent to the problem of population size estimation. Our heuristic discretization procedure seeks to avoid poor discretization by using the observed spacing of SNPs in the data. Let T be the empirical distribution of absorption times for all the contiguous segments inferred by a posterior decoding of our data set. Then, for a discretization with d intervals, our goal is to compute t1,. . .,td21such that we see the same number (i.e., |T|/d) of
absorption times in each interval.
We first tackle the problem of breaking up our data into segments with the same pairwise coalescence time and then compute the expectation of this time. The locations of ancestral recombination breakpoints divide up a sequence pair into segments that each have a single coalescence time, but we do not know these breakpoints. However, it will often be the case that all the base pairs between two adjacent SNPs will coalesce at the same time or be split between just two different times on either side of a recombination breakpoint. Moreover, in many cases, the positional distribution of SNPs and that of recombination breakpoints will be correlated—in particular, both SNPs and recombination breakpoints will be spaced farthest apart in regions of recent coalescence time. With this rationale, we take the observed distances between SNPs as a proxy for the length distribution of nonrecombining segments. To be more specific, letLbe the list of all lengths between adjacent SNPs for all pairs of haplotypes, and let thedempirical quantiles ofLbe bounded byL1,. . .,Ld21.
Now we need the expectated coalescence time of anl-base segment with no mutation or recombination. Conditional onm
mutation events and r recombination events, the coalescence time for two lineages under a constant population size is distributed asG(1 +m+r, 1 +lu+lr) (see Tajima 1983 for a derivation with mutation only), so the expected coalescence time form=r= 0 is
1 1þlðuþrÞ:
In our implementation, we drop the 1 in the denominator since this represents our prior underconstantpopulation sizes of two lineages coalescing at rate 1. We want to minimize the use of our prior, so we put more weight on the term related to the empirical length distribution. Putting this all together, we plug the quantiles ofLinto this formula to obtainti:
ti¼ 1
Ld2iðrþuÞ:
GENETICS
Supporting Information
http://www.genetics.org/lookup/suppl/doi:10.1534/genetics.112.149096/-/DC1
Estimating Variable Effective Population Sizes from
Multiple Genomes: A Sequentially Markov
Conditional Sampling Distribution Approach
Sara Sheehan, Kelley Harris, and Yun S. Song2 SI S. Sheehan, K. Harris, Y. S. Song
File S1
Supporting Information
1
Simulation details
The following
ms
commands were used to simulate data under three population size change histories:
S1:
ms 10 1 -T -r 10000 1000000 -eN 0.05 0.1 -eN 0.2 0.5 -eN 0.5 1.25
S2:
ms 10 1 -T -r 10000 1000000 -eN 0 10 -eN 0.05 0.1 -eN 0.2 0.5 -eN 0.5 1.25
Note that
ms
times are in units of 4
N
0generations, so we multiplied the raw times above by 2 to compare
to PSMC and our method diCal. Mutation rates were not specified above, since the only
ms
output used
was tree at each base (
-T
flag). Mutations were then added to the trees using a finite sites model, the
mutation matrix in Table 1, and a mutation rate
θ
= 0
.
01
×
1
.
443. The factor of 1
.
443 accounts for the
fact that this mutation matrix allows mutations that do not actually change the base (i.e., an A
→
A
transition); see Chan et al. (2012) for further explanation. This mutation matrix was also used for the
real data analysis.
The following style of command was used to run PSMC. We used 20 iterations as described in the
PSMC paper (Li and Durbin, 2011), and the same pattern of parameters we used for diCal:
psmc -p 3+2+2+2+2+2+3 -t 7 -N 20 -r 1 -o output.psmc input.psmcfa
To run our method on simulated data, the following style of command was used:
java -Xmx25G -d64 diCal_EM -i input.fasta -p params.txt -n 9 -t 5 -a "3 2 2 2 2 2 3"
The parameter file includes the number of loci in each sequence, the number of alleles (4 in our case),
an estimate of the mutation rate, mutation matrix, and recombination rate, and the discretization. The
-n
flag specifies the number of haplotypes to use in the trunk, so there are
n
+ 1 total. The
-t
flag
specifies the number of threads to use; memory requirements scale linearly with this parameter. If
-t 1
was specified in the case, then
-Xmx5G
could be used for the memory requirement. The
-a
flag specifies
the pattern of parameters, in an analogous fashion to PSMC.
To run our method on real data, the following style of command was used:
java -Xmx20G -d64 diCal_EM -i input.fasta -p params.txt -n 9 -t 2 -r 1.25 -a "4 2 2 2 2 2 2"
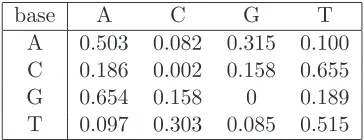
Table 1: Mutation matrix for realistic human data. The rows represent the original base, and the columns
represent the mutated base.
base
A
C
G
T
A
0.503
0.082
0.315
0.100
C
0.186
0.002
0.158
0.655
G
0.654
0.158
0
0.189
S. Sheehan, K. Harris, Y. S. Song 3 SI