Optimization of Machining Parameters in
CNC turning on Surface finish and MRR for
EN19 steel using Taguchi Method
Ravi Kumar1, Dr. G Bala Kumar2
Research Scholar, Department of Mechanical Engineering, Sir M Visvesvaraya Institute of Technology, Bangalore, India1
Associate Professor, Department of Mechanical Engineering, Sir M Visvesvaraya Institute of Technology, Bangalore, India2
ABSTRACT: The introduction of newly developed coated cutting tools has made hard turning more widespread. The present work deals with the investigation of the performance of TNMG carbide tool and optimization of cutting parameter when turning with EN19 steel. In this work, an attempt has been made to analyze the influence of cutting speed, feed, depth of cut on surface roughness and material removal rate by using Taguchi method and Minitab software is used to analyze the predicted values of surface roughness and material removal rate. Turning was done under wet cutting condition by using various cutting speed, feed, depth of cut. The experimental plan was based on Taguchi L9 orthogonal array. The parametric analysis indicates that cutting speed has most significance on surface roughness. The ANOVA is a statistical tool is used to determine the significance of independent parameter on responses it showed cutting speed has more significance on surface roughness and material removal rate followed by feed and depth of cut. Regression analysis shows that experimental and predicted values are near.
KEYWORDS: Taguchi Method, EN-19 steel, Surface roughness, Material removal rate, ANOVA.
I. INTRODUCTION
In turning operation cutting parameters such as cutting speed, depth of cut and feed rate have great impact on the surface finish and material removal rate. In order to maximize the gains from turning operation, an accurate model of process must be constructed. In this work analysis has been made to minimize the surface roughness and increase the material removal rate. Hence this work concentrates on the effects of feed rate, cutting speed and depth of cut on the surface roughness and material removal rate by using TNMG carbide cutting tool on EN19 die steel. An attempt is made to investigate the material removal rate and the surface roughness of the EN19 steel by Optimum design of L9
orthogonal array. Surface finish is the method of measuring the quality of a product and is an important parameter in machining process. It is one of the prime requirements of customers for machined parts. Productivity is also necessary to fulfill the customers demand. For this purpose quality of a product and productivity should be high. In addition to the surface finish quality, the material removal rate (MRR) is also an important characteristic in turning operation and high MRR is always desirable. So the study of surface roughness and material removal rate and the interaction between them is now becoming an integral part of machining operations.
II. LITERATURE REVIEW
Suleiman Abdulkareem et al. [1] has studied the influence of the three most important machining parameters of depth
machining of the work piece. Box Behnken experimental design method as well as analysis of variance (ANOVA) is used to analyze the influence of machining parameters on surface roughness height Ra. The individual parameters effect as well as effect of interactions between the machining parameters on the surface roughness height Ra is analyzed using various graphical representations.
Krishankantet al. [2] have studied on an optimization of turning process by the effects of machining parameters applying Taguchi
methods to improve the quality of manufactured goods, and engineering development of designs for studying variation. EN24 steel is used as the work piece material for carrying out the experimentation to optimize the Material Removal Rate. The bars used are of diameter 44mm and length 60mm. There are three machining parameters i.e. Spindle speed, Feed rate, Depth of cut. Different experiments are done by varying one parameter and keeping other two fixed so maximum value of each parameter was obtained. Operating range is found by experimenting with top spindle speed and taking the lower levels of other parameters.
Ali Riza Motorcu[3] has studied the surface roughness in the turning of AISI 8660 hardened alloy steels by ceramic based cutting
tools was investigated in terms of main cutting parameters such as cutting speed, feed rate, depth of cut in addition to tool’s nose radius, using a statistical approach. Machining tests were carried out with PVD coated ceramic cutting tools under different conditions. An orthogonal design, signal-to-noise ratio and analysis of variance were employed to find out the effective cutting parameters and nose radius on the surface roughness.
III. MATERIALS AND METHODS
1.1 Work piece material
EN19 steel is the most popular and versatile, hot work tool steel. It is a heat treatable low alloy steel containing Nickel, Chromium and Molybdenum. It is high strength low alloy steel with good toughness, high temperature strength, resistance to abrasion. It is known for its toughness and capability of developing high strength in the heat treated condition while retaining good fatigue strength and moderate wear resistance. It may be used for tool temperature up to about 1000F. Typical applications are for structural use such as Extrusion tools, Die casting Dies, Forging/Heading Dies, mandrels, plastic molds, Ejector pins, hot shear blades. It is also popular for extrusion press tooling because of its ability to withstand drastic cooling from high operating temperatures.
Chemical Composition: The table 3.1 shows the chemical composition of work-material EN19 steel.
Table 3.1 Chemical composition of work-material EN19 steel Element Fe C Si Mn P S Cr Mo Ni Al
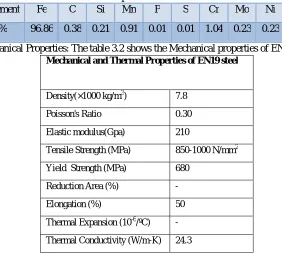
% 96.86 0.38 0.21 0.91 0.01 0.01 1.04 0.23 0.23 4.21 Mechanical Properties: The table 3.2 shows the Mechanical properties of EN19 steel.
Mechanical and Thermal Properties of EN19 steel
Density(×1000 kg/m3) 7.8
Poisson's Ratio 0.30
Elastic modulus(Gpa) 210
Tensile Strength (MPa) 850-1000 N/mm2
Yield Strength (MPa) 680
Reduction Area (%) -
Elongation (%) 50
Thermal Expansion (10-6/ºC) -
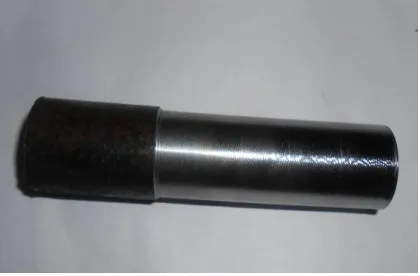
Fig 3.1: Experimental set up Fig 3.2: Work piece after turning
1.2 Experimental method
The table 3.3 shows experimental procedure.
Table 3.3 Experimental Procedure
2. Design of Experiments using Taguchi Method
Taguchi techniques were developed by G. Taguchi; these techniques have been utilized widely in engineering analysis to optimize the performance characteristics with the combination of design parameters. Taguchi technique is also a powerful tool for the design of high quality systems. To achieve quality improvement, Taguchi pioneered the use of robust parameter design. Robust parameter design is an engineering method for product and process design that focuses on minimizing variation and/or sensitivity to noise.
Design of Experiments (DOE) is based on the objective of desensitizing a product's performance characteristic(s) to variation in critical product and process design parameters. Through DOE, a series of tests are performed where pre-planned changes are made to the controllable variables so that the reason for changes in the response can be observed and identified. When DOE is performed using Taguchi method, the latter generally relates the variability in the responses of a particular trial condition with the effect of the uncontrollable variables or noise. Taguchi method obtains the optimal condition by observing the reduction in variation of the results within a particular trial condition. Hence, to take into account the variation of results, Taguchi method uses the S/N ratio to identify the quality characteristics applied for engineering design problems. In the S/N ratio, signal is interpreted as mean while noise is interpreted as standard deviation. Thus, Taguchi method tries to reach optimality by maximizing the S/N ratio so that the effect of
Sl. No Description 1 Machine tool CNC Lathe. 2 Material and
Size
EN19 steel : Ø25 x 150 mm Number of steel bars: 9. 3 Insert TNMG carbide tool 4 Too holder and
geometry
MTJNL 2525 M16
Back rake angle: -5o , Clearance angle:5o Include angle: 60o
Nose radius: 0.8 mm 5 Process
parameters
noise is minimized. The S/N ratio characteristics can again be divided into three categories based on objective of the experiment viz.: lower-the-better (LB), higher-the better (HB) and nominal-the best (NB). For the present case of minimization of wear, LB characteristic needs to be used. Moreover, Taguchi method employs a special design of orthogonal arrays (OA) to learn the whole parameters space with only a small number of experiments. Based on OA, the number of experiments which may increase the time and cost can be reduced. In the present study, an L9 OA is used
to study the effect of cutting parameters on cutting force, surface roughness and tool wear. Furthermore, to know which of the testing parameters have a significant influence over the cutting force, surface roughness and wear performance of different tools; analysis of variance (ANOVA) is also performed. Finally, to verification and validation of the optimal condition obtained through OA design.
2.1 Analysis of Variance (ANOVA)
A statistical Analysis of Variance (ANOVA) is performed to see which process parameters are significantly affecting the responses (cutting force, surface roughness and Tool wear (VB)). The goal of this experimental work was to investigate the effects of cutting parameters on cutting force, surface roughness and tool wear to establish a correlation between them. Experiments were planned according to Taguchi’s L9 orthogonal array, which has 9 rows corresponding
to the number of test. The factors and the interactions are assigned to the columns. The first column was assigned to the cutting speed (Vc), second feed rate (F) and third one Depth of cut (Ap) and the remaining were assigned to the interactions. It means a total 9 experimental number must be conducted using the combination of levels for each independent factor speed (Vc), feed (F) and depth of cut (Ap). This orthogonal array is chosen due to its capability to check the interactions among factors. ANOVA is used to find which cutting parameters are most significant on cutting force, surface roughness and tools wear. The experimental results are then transformed into a Signal to Noise (S/N) ratio. A total of 9 experiments based on Taguchi’s L9 orthogonal array were carried out with different combinations of
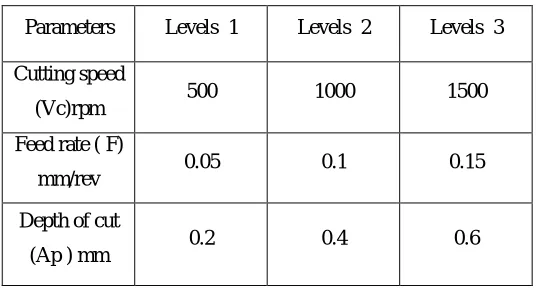
the levels of the input parameters. Among them, the settings of cutting speed include 500, 1000 and 1500 m/min those of feed rate include 0.05, 0.1, 0.15 mm/ rev and the depth of cut is set at 0.2, 0.4 and 0.6 mm.
The results were studied using the S/N ratio and ANOVA analysis. Based on the results of the S/N ratio and ANOVA analysis, optimal cutting parameters for surface roughness and MMR were obtained and verified. The percentage of contribution (PC) Calculated as.
% of Contribution (PC) = ((SS) speed – DOF * (SS Mean error)) / (SS) total)*100
3. Test Parameter
The experiments were conducted to study the effect of cutting force, surface roughness and tool wear on EN19 die steel. The test were conducted with the cutting speed ranging of 500 m/min to 1500 m/min, feed rate ranging from 0.05 mm/rev to 0.15 mm/rev and depth of cut ranging from 0.2 mm to 0.6 mm. The process parameters of their levels are as shown in table 5.1 for all the experiments.
Table 5.1 Assignment the levels to the factors Parameters Levels 1 Levels 2 Levels 3 Cutting speed
(Vc)rpm 500 1000 1500 Feed rate ( F)
mm/rev 0.05 0.1 0.15 Depth of cut
4. Experimental plan test
Table: 6.1 L9 Orthogonal Arrays for Factorial Experiments
V. RESULTS AND DISCUSSIONS
In this chapter, the experimentation were carried on a EN19 steel by using TNMG coated carbide insert with different parameters, results of surface roughness and material removal rate are determined by the experimental work as depicted below. Taguchi L9 othogonal array is used to find the analysis of variance and major influencing parameters on surface roughness and
material removal rate.
4.1 Influence of cutting parameters on surface roughness
Machining process with coolant and without coolant, it has become more popular as a finishing process. Thus it is especially crucial to select the machining parameters to obtain the desired surface finish of machined components. In the present investigation, the influence of process parameters like speed, feed and depth of cut on surface roughness of EN19 steel is studied.
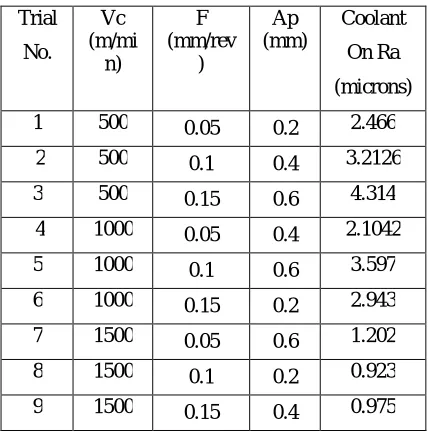
Table 7.1 Surface roughness for coolant ON
Trial.
No.
Cutting Speed
(Vc) m/min
Feed Rate
(F)mm/rev
Depth of Cut
(Ap) mm
1 500 0.05 0.2
2 500 0.1 0.4
3 500 0.15 0.6
4 1000 0.05 0.4
5 1000 0.1 0.6
6 1000 0.15 0.2
7 1500 0.05 0.6
8 1500 0.1 0.2
9 1500 0.15 0.4
Trial No.
Vc (m/mi
n)
F (mm/rev
)
Ap (mm)
Coolant On Ra (microns) 1 500 0.05 0.2 2.466 2 500 0.1 0.4 3.2126
3 500 0.15 0.6 4.314 4 1000 0.05 0.4 2.1042
Fig 7.1 Cutting speed versus surface roughness (Depth of cut 0.6mm)
1 500 1 000
500 3.5
3.0
2.5
2.0
1 .5
1 .0
speed (m/min)
M
e
a
n
Main Effects Plot for Ra
Data Means
The Fig 5.1 shows the surface roughness significantly decreases with increasing the cutting speed. As the cutting speed increases from 500 to 1000 rpm, the surface roughness decreases from higher surface roughness to lower surface roughness. At higher cutting speeds, a good surface finish is obtained. At higher cutting speed less heat is dissipated to the work material as it was swept away in the chips and reduces the adherence of chips to the cutting edge due to this reason good surface finish is achieved.
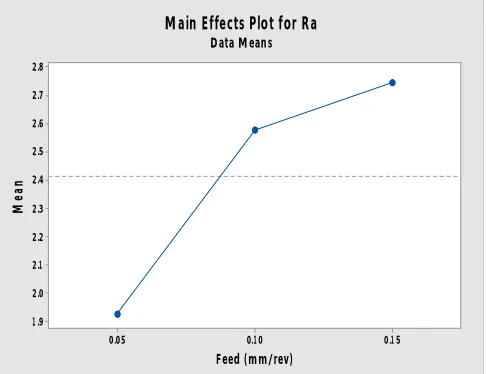
Fig 7.3 shows the surface roughness versus feed rate. The surface roughness increases with increase in feed rate. Initially the feed rate 0.05mm/rev exhibits lower surface roughness. The feed rate increases from 0.1 mm/rev to 0.15 mm/rev. The surface roughness gradually increases because more volume of material removed from the work piece. Minimal surface roughness achieved 1 to 2.5 microns at lower cutting feed rate of 0.05mm/rev, higher cutting speed of 1500 rpm and depth of cut of 0.6mm.
0.1 5 0.1 0
0.05 2.8
2.7
2.6
2.5
2.4
2.3
2.2
2.1
2.0
1 .9
Feed (mm/rev)
M
e
a
n
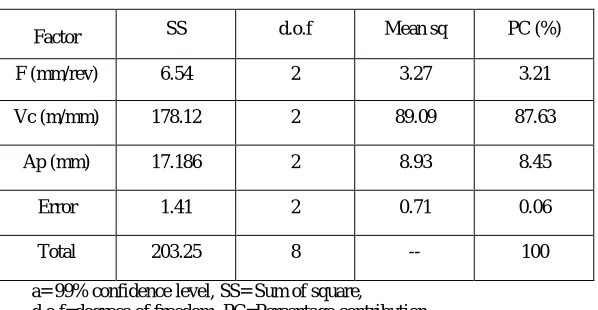
Table 7.2 ANOVA results of surface roughness for TNMG carbide tool
Factor SS d.o.f Mean sq PC (%)
F (mm/rev) 6.54 2 3.27 3.21
Vc (m/mm) 178.12 2 89.09 87.63
Ap (mm) 17.186 2 8.93 8.45
Error 1.41 2 0.71 0.06
Total 203.25 8 -- 100
a= 99% confidence level, SS= Sum of square,
d.o.f=degrees of freedom, PC=Percentage contribution
An ANOVA table is commonly used to summarize the tests performed. It was statistically studied the relative effect of each cutting parameters on the surface roughness (Ra) by using ANOVA. Table 5.3 shows the results of the ANOVA (analysis of variance) with the surface roughness for TNMG carbide tool when coolant on.
Here the contribution of speed rate for TNMG carbide tool on surface roughness is 87.63%, it is more significant and cutting feed factor is 8.45% have statistical and physical significance on the surface roughness obtained for EN19 steel. The feed rate is more significant factor than the other factors. The error associated is 3.21% respectively. From the result, the role of depth of cut is minimum in obtaining good surface finish. It is indicated that in order to achieve good surface finish, always use high cutting speed and low feed rate.
7.2 Influence of cutting Parameters on Material Removal Rate
Table 7.3 shows the MRR for same tool with different cutting parameters when coolant on Fig 7.4 MRR versus cutting speed for TNMG carbide tool
Trial . No.
Vc (rpm)
F (mm/rev
)
Ap (mm)
MRR (mm3/min)
1 500 1000
500 1 0000
9000
8000
7000
6000
Speed (m/min)
M
e
a
n
Main Effects Plot for MRR Data Means
The Fig 7.2 shows, material removal rate versus cutting speed for TNMG carbide tool. Initially the material removal rate lower at cutting speed of 500rpm. The cutting speed increases from 500rpm to 1000rpm, the material removal rate is slightly increases, again the cutting speed increases to 1500 the material removal rate is more. At higher cutting speed and higher feed rate, the material removal rate is high.
The Fig 7.5 shows, Material remove rate versus feed rate for TNMG carbide tool. Initially the material removal rate is less at feed rate of 0.05mm/rev. The feed rate increases from 0.05mm/rev to 0.1mm/rev, material removal rate increases linearly. As the feed is increased, the tool penetrates action also faster and more material is removed even though less contact time.
0.1 5 0.1 0
0.05 8500
8000
7500
7000
6500
6000
Feed (mm/rev)
M
e
a
n
Table 7.4ANOVA results of MRR for TNMG carbide tool
Table 7.4 shows the results of the ANOVA (analysis of variance) with the MRR for TNMG carbide tool. One can observe from ANOVA table that the contribution of cutting speed for TNMG carbide tool is 72.24%, it is more significant and feed factor is 20.70% have statistical and physical significance on the MRR obtained for AISI 4140 steel. The feed rate and cutting speed are more significant factors. The error associated is 4.81% respectively
.a = 99% confidence level, SS = Sum of square
d.o.f = degrees of freedom, PC = Percentage contribution
7.3 Regression Analysis
Regression analysis method is used for the estimation of surface roughness. The objective of regression analysis is to develop a model that explains as much as possible, the variability in a dependent variable, using several independent variables. Operating parameters like speed, depth of cut, feed rate and time are considered as the independent parameters for constructing the regression model. The variation of measured and estimated Surface roughness with feed rate and speed has been presented in the form graphs for comparison.
Making use of the experimental data, a mathematical model has been developed, using regression analysis. In this analysis surface roughness is considered as the dependent variable and speed, feed, depth of cut and time are considered as the independent variable. The first order polynomial model has been developed. The first-order polynomial is given in the equation
Y=ao+a1X1+a2X2+a3X3
After regression analysis the above equation is obtained as, Y=2.9658-0.0023 (500) +8.199333 (0.05) +2.3175 (0.2 =2.6892
Factor SS d.o.f Mean sq PC (%)
F (mm/rev) 17.59 2 8.79 20.70 Vc (m/mm) 61.39 2 30.69 72.24 Ap (mm) 1.91 2 0.95 2.25
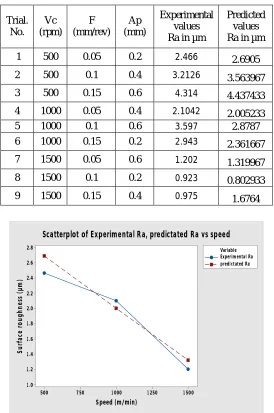
Table 7.4 Surface roughness values after regression 1 500 1 250 1 000 750 500 2.8 2.6 2.4 2.2 2.0 1 .8 1 .6 1 .4 1 .2 1 .0 Speed (m/min) S u rf a c e r o u g h n e ss ( µ m ) Experimental Ra predictated Ra Variable Scatterplot of Experimental Ra, predictated Ra vs speed
Fig 7.5 Surface roughness versus speed after regression
Fig 7.5 shows the surface roughness v/s speed there are three parameter considered such as cutting speed, feed and depth of cut. The speed is varied from 500rpm to 1500rpm at constant depth of cut 0.6mm. Measuring the average surface roughness values (Ra) and compared with predicted average surface roughness values (Ra). Predicted values are calculated by regression analysis in Minitab software. We observed that by increasing cutting speed, average surface roughness value is decreased.
VIII. CONCLUSION
In the present work, CNC turning was carried out on grade EN19 steel, with the help of TNMG coated carbide cutting tool. This enabled in the development of statistical models of surface roughness and material removal rate
Trial. No. Vc (rpm) F (mm/rev) Ap (mm) Experimental values Ra in µm
Predicted values Ra in µm 1 500 0.05 0.2 2.466 2.6905
2 500 0.1 0.4 3.2126 3.563967
3 500 0.15 0.6 4.314 4.437433
4 1000 0.05 0.4 2.1042 2.005233
5 1000 0.1 0.6 3.597 2.8787 6 1000 0.15 0.2 2.943 2.361667
7 1500 0.05 0.6 1.202 1.319967
8 1500 0.1 0.2 0.923 0.802933
components. These models were obtained by Taguchi techniques. From the analysis of results using conceptual S/N ratio approach and ANOVA, the following conclusions can be drawn.
The speed has more influence on, surface roughness, and material removal rate compared to the feed and depth of cut.
Better surface finish is obtained at an optimum cutting speed of 1500rpm, feed rate 0.1mm/rev and depth of cut 0.4mm.
Surface roughness reduces as the speed increases and feed decreases.
Higher material removal rate is obtained at an optimum cutting speed of 1500rpm, feed rate 0.15mm/rev and depth of cut 0.4mm.
Material removal rate increases with increase in cutting speed and feed rate.
From regression analysis we conclude that experimental values and predicted values are almost near.
REFERENCES
1. Suleiman Abdulkareem, Usman JibrinRuma and Apasi Adaokoma. “Optimizing Machining Parameters during Turning Process”. International Journal of Integrated Engineering, Vol. 3 No. 1 (2011) p. 23-27.
2. Krishankant, Jatin Taneja, Mohit Bector& Rajesh Kumar. ” Application of Taguchi Method for Optimizing Turning Process by the effects of Machining Parameters”. International Journal of Engineering and Advanced Technology (IJEAT) ISSN: 2249 – 8958, Volume-2, Issue-1, October 2012.
3. Ali RizaMotorcu. “The Optimization of Machining Parameters Using the Taguchi Method for Surface Roughness of AISI 8660 Hardened Alloy Steel”. Journal of Mechanical Engineering 56(2010)6, 391-401.
4. Kalpakjian and Schmid, Manufacturing Processes for Engineering Materials, 4th Edition, Prientice Hall, 2003, pp 464, 527.
5. Poulachon, G., Bandyopadhyay, B.P., Jawahir, I.S., Pheulpin, S. and Seguin, E. (2004).”Wear behavior of CBN tools while turning various hardened steels”. Elsevier Wear. 256: 302-310.