REPORT NO. 205
LAND USE, NUTRIENT YIELD, AND EUTROPHICATION IN THE CHOWAN RIVER BASIN
Nancy J. Craig Edward J. Kuenzler
Department of Environmental Sciences and Engineering School of Public Health
University of North Carolina at Chapel Hill August 1983
Wal
er Resources Research
lnslilule
Copies available from: Water Resources Research Institute of The University of North Carolina 124 Riddick Building
North Carolina State University Raleigh, North Carolina 27650
LAND
USE, NUTRIENT YIELD, AND EUTROPHICATIONIN THE CHOWAN RIVER BASIN
Nancy
J.
Craig Research AssistantEdward
J.
KuenzlerProfessor of Environmental Biology
Department of Environmental Sciences and Engineering University of North Carolina at Chapel Hill
Chapel Hill, North Carolina 27514
This research was supported in part by funds provided by the U.S.
Department of the Interior, Washington, D.C. through The University of North Carolina Water Resources Research Institute as authorized by the Water Research and Development Act of 1978.
Project No. B-127-NC(A) Agreement No. 14-34-001-027 4
ACKNOWLEDGMENTS
Karen Stone and Chris Madden greatly assisted in the computer work necessary to complete the report. We wish to thank Drs. Wendell Gilliam, Frank Humenik, John Day, Eugene Turner, Hans Paerl, Charles Weiss, Curtis Richardson, and Ms. Beverly Young for their helpful
discussions of the problem and their criticism of the manuscript. The contributions and technical criticisms of those mentioned above are gratefully acknowledged, but responsibility for the conclusions and recommendations rests with the authors.
DISCLAIMERS STATEMENT
Contents of this publication do not necessarily reflect the views and policies of the U.S. Department of the Interior, nor does mention of trade names or commercial products constitute their endorsement or recommendation for use by the U.S. Government.
ABSTRACT
Land u s e changes w i t h i n t h e Chowan R i v e r w a t e r s h e d o v e r t h e p a s t t h r e e d e c a d e s were d e t e r m i n e d t o a s s e s s p o t e n t i a l impact of t h e above changes on r e c e n t w a t e r q u a l i t y d e g r a d a t i o n and e u t r o p h i c a t i o n of t h e Chowan R i v e r . Although farm a c r e a g e h a s d e c r e a s e d , t h e amount of h a r v e s t e d c r o p l a n d h a s remained c o n s t a n t . Y i e l d s from a l l major c r o p s have i n c r e a s e d due t o g r e a t e r m e c h a n i z a t i o n and i n c r e a s e s i n f e r t i l i z e r usage (1957-1976). North C a r o l i n a ' s u s a g e of n i t r o g e n f e r t i l i z e r p e r a c r e of farmland i n t h e Chowan R i v e r w a t e r s h e d h a s been s i g n i f i c a n t l y h i g h e r t h a n V i r g i n i a ' s . There h a s been a n a p p a r e n t l a r g e i n c r e a s e i n a r t i f i c i a l d r a i n a g e on faxms from 1940 t o 1978, a p p r o a c h i n g 1 2 % a y e a r . Approximately 67% of t h e f a r m l a n d i n North C a r o l i n a i s now d r a i n e d v e r s u s 6% i n V i r g i n i a . A 30% d e c r e a s e i n oak-gum-cypress f o r e s t e d w e t l a n d h a s o c c u r r e d i n t h e North C a r o l i n a Chowan b a s i n w i t h i n a
t e n - y e a r p e r i o d (1964-1974).
C o n s t r u c t i o n of mass b a l a n c e models f o r a g r i c u l t u r a l l a n d , u p l a n d f o r e s t , and w e t l a n d f o r e s t p e r m i t t e d e s t i m a t i o n of n u t r i e n t y i e l d from d i f f e r e n t l a n d u s e s . Of t h e a n n u a l n i t r o g e n i n p u t s t o t h e Chowan R i v e r (6.94 x 10⁶ kg N / y r ) , t h e models s u g g e s t e d t h a t a g r i c u l t u r e c o n t r i - b u t e s 6 2 % , f o r e s t and w e t l a n d s 21X, and p o i n t s o u r c e s 1 7 % . A g r i c u l t u r e c o n t r i b u t e s 72%, f o r e s t s and w e t l a n d s 22% and p o i n t s o u r c e s 6% of t h e a n n u a l p o t e n t i a l phosphorus i n p u t s (3.06 x 10⁶ kg P / y r ) . Swamp
f o r e s t s were e s t i m a t e d t o remove 83% o f t h e t o t a l N and 51% of t h e t o t a l P i n s t r e a m s p a s s i n g through t h e s e w e t l a n d s .
TABLE OF CONTENTS
p a g e LISTOFFIGURES
. . .
i x. . .
SUMMARY. CONCLUSIONS. AND RECOMMENDATIONS x i i i INTRODUCTION. . .
1. . .
.
A S o u r c e s o f I n f o r m a t i o n
5
. . .
.
1 A g r i c u l t u r a l t r e n d s 5
. . .
2
.
D r a i n a g e d a t a 63
.
F o r e s t l a n d. . .
6. . .
4
.
Mass b a l a n c e models 8. . .
5
.
C r o p l a n d 86
.
Animals: d a i r y cows. b e e f c a t t l e . hogs.. . .
a n d c h i c k e n s
9
. . .
7
.
Swamp-forest s y s t e m9
. . .
8
.
Upland f o r e s t 11. . .
RESULTS 1 3
. . .
.
A A g r i c u l t u r a l Changes. 1950-1978 1 3
. . .
B
.
Changes i n Forest 1 7. . .
C
.
Mass B a l a n c e Models 2 1. . .
1
.
Major c r o p s 2 1. . .
.
2 L i f e s t o c k models 23
. . .
3
.
Swamp f o r e s t model 3 5. . .
.
4 Upland f o r e s t model 36
DISCUSSION
. . .
4 1. . .
A
.
A g r i c u l t u r a l T r e n d s 4 1. . .
.
B F o r e s t Changes 4 3
. . .
C
.
Mass B a l a n c e Models 4 4. . .
1
.
A g r i c u l t u r e mass b a l a n c e model 44page
2 . Livestock mass balance model
. . .
52 3 . Swamp f o r e s t mass balance model. . .
54 4 . Upland f o r e s t mass balance model. . .
57D.
Comparison of Non-Point Source Pollution from MassBalance Models
. . .
57LITERATURE CITED
. . .
59
LIST OF FIGURES
F i g u r e 1. 2. 3. 4. 5 . 6. 7. 8 . 9. 1 0 .
11.
1 2 .
1 3 .
14.
15.
The Chowan R i v e r d r a i n a g e b a s i n i n n o r t h e a s t e r n North
. . .
C a r o l i n a and s o u t h e a s t e r n V i r g i n i aChange i n number o f farms and p e r c e n t a g e of a r e a i n
. . .
farms i n t h e Chowan R i v e r B a s i n , 1950-1978
Changes i n a r e a s of major a g r i c u l t u r a l l a n d u s e s i n
. . .
t h e Chowan B a s i n
Changes i n a r e a s d e v o t e d t o major c r o p s i n t h e chowan
. . .
B a s i n , 1950-1978
Changes i n y i e l d s of major c r o p s i n t h e Chowan B a s i n ,
. . .
1950-1978
Changes i n number of farm a n i m a l s i n t h e Chowan B a s i n ,
. . .
1950-1978H i s t o r i c a l t r e n d of amounts of n i t r o g e n (N) and phospho-
. . . .
r u s ( P ) from f e r t i l i z e r used i n t h e Chowan B a s i nC u r r e n t f e r t i l i z e r u s a g e i n Chowan Basin based on
. . .
f e r t i l i z e r s a l e s
Land a r t i f i c i a l l y d r a i n e d f o r a g r i c u l t u r e , 1940-1978
. .
Mass b a l a n c e models f o r c o r n f o r g r a i n and s i l a g e i n
. . .
North C a r o l i n a Chowan B a s i n
Mass b a l a n c e models f o r soybeans and p e a n u t s i n North
. . .
C a r o l i n a ChowanBasin
Mass b a l a n c e models f o r t o b a c c o and c o t t o n i n North
. . .
C a r o l i n a Chowan B a s i n
Mass b a l a n c e model f o r wheat i n North C a r o l i n a Chowan B a s i n
. . .
Mass b a l a n c e models f o r c o r n f o r g r a i n and s i l a g e i nV i r g i n i a C h o w a n Basin
. . .
Mass b a l a n c e models f o r soybeans and p e a n u t s i n V i r g i n i a C h ~ w a n B a s i n . . . ~
. . .
page
2 1 3 1 5 15 16 1 6 1 8 1 8 1 9 25 26 27 2 8 2 9F i g u r e
page
16. Mass b a l a n c e models f o r tobacco and b a r l e y i n V i r g i n i aChowan Basin
. . . , . . .
311 7 . Mass balance model f o r wheat i n V i r g i n i a Chowan Basin
.
3218. Mass b a l a n c e model f o r major c r o p s i n t h e t o t a l Chowan
Basin
. . .
3319. Mass balance models f o r hogs, c h i c k e n s , d a i r y cows, and
beef c a t t l e i n V i r g i n i a Chowan Basin
. . .
3420. Mass balance models f o r hogs, c h i c k e n s , d a i r y cows, and
beef c a t t l e i n North C a r o l i n a Chowan Basin
. . .
3721. Mass balance model f o r swamp f o r e s t ecosystem i n t h e
t o t a l Chowan Basin
. . .
38 2 2 . Mass balance model f o r upland f o r e s t i n t h e t o t a l ChowanBasin
. . .
392 3 . D i s t r i b u t i o n of n i t r o g e n and phosphorus i n p u t s t o t h e
LIST OF
TABLES
T a b l e
page
1. E s t i m a t e d magnitude of non-point s o u r c e c o n t r i b u t i o n t o
s u r f a c e w a t e r s i n conterminous U.S.
. . .
3 2. P e r c e n t a g e of c o u n t y w i t h i n t h e Chowan R i v e r Basin. . .
7 3. Annual N and P b a l a n c e s f o r l i v e s t o c k s y s t e m s. .
,
. .
1 0 4. Average farm s i z e ( h e c t a r e s ) and p e r c e n t of t o t a lc r o p l a n d t h a t was h a r v e s t e d i n t h e Chowan b a s i n ,
. . .
y e a r s 1950-1978 1 4
5. P e r c e n t of t o t a l number of farms i n which o p e r a t o r i s f u l l - o w n e r , part-owner, o r t e n a n t i n Chowan b a s i n ,
. . .
1950-1978 20
6. Land a r t i f i c i a l l y d r a i n e d by c o u n t y i n Chowan B a s i n a s
. . .
p e r c e n t of t o t a l l a n d and l a n d i n f a r m s , 1978 20 7. S o i l C o n s e r v a t i o n Watershed P r o j e c t s i n North C a r o l i n a
. . .
Chowan Basin completed t o d a t e 21 8. Change i n a r e a (103ha) of commercial f o r e s t l a n d t y p e
. . .
i n t h e Chowan B a s i n , 1964-1974 22
9 . P e r c e n t a g e of t o t a l commercial f o r e s t by f o r e s t t y p e s
. . .
i n Chowan B a s i n , 1974 23
1 0 . Area ( h e c t a r e s ) and p e r c e n t a g e o f t o t a l a r e a of
commercial f o r e s t l a n d by ownership c l a s s i n Chowan b a s i n ,
. . .
y e a r s 1964, 1974 24
11. N u t r i e n t y i e l d from c r o p l a n d b e f o r e swamp p r o c e s s i n g i n t h e Chowan B a s i n , 1972-1980, b a s e d on mass b a l a n c e
. . .
m o d e l s . . 35
1 2 . Amounts of n i t r o g e n and phosphorus a p p l i e d a n n u a l l y i n
. . . .
f e r t i l i z e r . . . 36 1 3 . Ranking of major c r o p s of p o t e n t i a l y i e l d s of n i t r o g e n. . .
Table
-
page
14. A comparison of nutrient y i e l d 8 from a g r i c u l t u r a l systems and f o r e s t e d watersheds
. . .
4915.
Estimation of annual phosphorus l o s s from cropland duet o e r o s i o n . .
. . .
5116,
Total p o t e n t i a l and annual n i t r o g e n and phosphorusSUMMARY, CONCLUSIONS,
AND
RECOMMENDATIONSThe Chowan R i v e r h a s been e x p e r i e n c i n g blue-green a l g a l blooms s i n c e t h e e a r l y 1 9 7 0 ' s . Land use changes and i n t e n s i t y of l a n d u s e i n t h e Chowan w a t e r s h e d o v e r t h e p a s t t h r e e d e c a d e s were examined t o d e t e r m i n e i f t h e s e s i g n i f i c a n t l y c o n t r i b u t e t o t h e n u i s a n c e blooms.
The Chowan R i v e r b a s i n (12,650 kmz), l o c a t e d i n n o r t h e a s t e r n North C a r o l i n a and s o u t h e a s t e r n V i r g i n i a , i s p r e d o m i n a n t l y f o r e s t e d
( 7 6 % ) . F o r e s t t y p e s i n c l u d e l o b l o l l y and s h o r t l e a f p i n e , oak-pine, oak-hickory, oak-gum-cypress, and elm-ash-cottonwood, Most of t h e remaining 22% i s i n a g r i c u l t u r a l l a n d u s e ( e x c l u d i n g farm woodland); a small f r a c t i o n i s u r b a n i z e d . S e v e n t y - t h r e e p e r c e n t of t h e a g r i c u l t u r a l l a n d i s l o c a t e d w i t h i n t h e V i r g i n i a p o r t i o n of t h e Chowan w a t e r s h e d and 27% i n North C a r o l i n a .
S i n c e 1950 t h e number of f a r m s , a s w e l l a s farm a c r e a g e , w i t h i n t h e watershed h a s d e c r e a s e d . T h i s i s p r i m a r i l y due t o t h e d e c r e a s e i n farm woodland; p a s t u r e l a n d and h a r v e s t e d c r o p l a n d have remained
e s s e n t i a l l y t h e same i n a r e a . The p a t t e r n of change i s one o f fewer b u t l a r g e r f a r m s , t h a t have s u b s t a n t i a l l y i n c r e a s e d y i e l d s of t h e major c r o p s ( c o r n f o r g r a i n and s i l a g e , s o y b e a n s , p e a n u t s , t o b a c c o , w h e a t , c o t t o n , and b a r l e y ) . T h i s i n c r e a s e i n c r o p y i e l d i s due i n p a r t t o g r e a t e r farm m e c h a n i z a t i o n and i n c r e a s e s i n f e r t i l i z e r u s a g e from 1957-1976. North C a r o l i n a c o u n t i e s w i t h i n t h e Chowan B a s i n i n r e c e n t y e a r s h a v e u s e d r o u g h l y t h e same amount o f n i t r o g e n and phosphorus ( m e t r i c t o n s / y r ) a s V i r g i n i a ' s p o r t i o n of t h e w a t e r s h e d , a l t h o u g h V i r g i n i a c o n t r i b u t e d 66% o f t h e h a r v e s t e d c r o p l a n d . The number of l i v e s t o c k on farms h a s remained c o n s t a n t e x c e p t f o r c h i c k e n s
( l a y e r s d e c r e a s e d ; b r o i l e r s g r e a t l y i n c r e a s e d ) . The p e r c e n t a g e of f a r m e r s who both own and r e n t p a r t o f t h e i r farms h a s i n c r e a s e d s i g n i f i c a n t l y a t t h e expense of f u l l - o w n e r s and t e n a n t s .
There h a s been a n i n c r e a s e i n a r t i f i c i a l d r a i n a g e on farms from
1940-78 which a p p r o a c h e s a 12% i n c r e a s e p e r y e a r . T h e r e e x i s t s a s i g n i f i c a n t amount of a r t i f i c i a l d r a i n a g e of a g r i c u l t u r a l l a n d i n t h e North C a r o l i n a p o r t i o n of t h e Chowan b a s i n . Approximately 67% o f t h e farm l a n d i n t h e North C a r o l i n a Chowan w a t e r s h e d i s d r a i n e d v e r s u s 6%
o f t h e f a r m l a n d i n t h e V i r g i n i a Chowan w a t e r s h e d . T h i s i s d u e , i n p a r t , t o t h e g r e a t e r amount of low-lying f a r m l a n d w i t h i n t h e C o a s t a l P l a i n i n North C a r o l i n a which c a n n o t b e r o u t i n e l y t i l l e d w i t h o u t
d r a i n a g e . The S o i l C o n s e r v a t i o n S e r v i c e h a s c h a n n e l i z e d a p p r o x i m a t e l y
22% of t h e s t r e a m m i l e s w i t h i n t h e North C a r o l i n a Chowan w a t e r s h e d , w h i l e i t h a s n o completed p r o j e c t s i n V i r g i n i a . T h i s i n c r e a s e i n d r a i n a g e of a g r i c u l t u r a l l a n d , p r i m a r i l y i n North C a r o l i n a , c o u l d c o n t r i b u t e s i g n i f i c a n t l y t o g r e a t e r n u t r i e n t i n p u t s i n t o t h e Chowan w a t e r s h e d . More w a t e r i s a b l e t o l e a v e t h e f i e l d s a t a f a s t e r r a t e , c a r r y i n g r e s i d u a l f e r t i l i z e r n u t r i e n t s . Much of t h i s d r a i n a g e , due t o c h a n n e l i z a t i o n , may bypass t h e swamp f o r e s t n u t r i e n t - r e m o v a l p r o c e s s , t h e r e b y i n c r e a s i n g t h e n u t r i e n t l o a d i n t h e r i v e r .
F o r e s t l a n d a c r e a g e h a s i n c r e a s e d w i t h i n t h e Chowan watershed d u r i n g t h e y e a r s 1964-1974. A l l t y p e s o f f o r e s t , e x c e p t oak-pine, have i n c r e a s e d i n a r e a i n t h e t o t a l Chowan b a s i n , p r i m a r i l y i n V i r g i n i a . A s i g n i f i c a n t d e c r e a s e i n t h e oak-gum-cypress f o r e s t e d wetland h a s o c c u r r e d w i t h i n t h e North C a r o l i n a Chowan b a s i n , amounting t o a 30X d e c r e a s e w i t h i n t h e t e n y e a r period. Again, due t o t h e n a t u r e of t h e swamp f o r e s t ' s a b i l i t y t o a c t a s a n u t r i e n t s i n k (83% o f t o t a l N i n p u t s removed; 51X t o t a l P i n p u t s removed), t h i s d e c l i n e i n swamp a c r e a g e and f u n c t i o n i n g may c o n t r i b u t e t o t h e i n c r e a s e i n n u t r i e n t s a v a i l a b l e t o t h e Chowan R i v e r .
C a l c u l a t i o n s from mass b a l a n c e models f o r a g r i c u l t u r a l l a n d , upland f o r e s t , and wetland f o r e s t p r o v i d e e s t i m a t e s of t h e n u t r i e n t y i e l d from d i f f e r e n t l a n d u s e s (non-point s o u r c e s ) , According t o
t h e s e n u t r i e n t b u d g e t s , a g r i c u l t u r a l l a n d y i e l d s 62% of t h e a n n u a l n i t r o g e n i n p u t s (6.94
x
l o 6
k g l y r ) i n t o t h e r i v e r , w h i l e f o r e s t and w e t l a n d s c o n t r i b u t e 21%. By comparison, S t a n l e y and Bobbie (1977) c a l c u l a t e d a n n u a l n i t r o g e n i n p u t s t o be 7.0 xlo6
k g l y r based ona c t u a l c o n c e n t r a t i o n s i n t h e r i v e r and r i v e r f l o w . The remainder (17%)
i s due t o p o i n t s o u r c e s a l o n g t h e r i v e r . The a n n u a l phosphorus i n p u t s t o t h e r i v e r (3.06 x
lo6
k g l y r ) c o n s i s t of a g r i c u l t u r a l s o u r c e s , 72%; f o r e s t s and w e t l a n d s , 22X; and p o i n t s o u r c e s , 6%. These c a l c u l a t i o n s i n d i c a t e t h a t a g r i c u l t u r a l cropland i s t h e s o u r c e of most of t h e n i t r o g e n and phosphorus a v a i l a b l e t o t h e r i v e r . T h i s e s t i m a t e f o r phosphorus i s probably h i g h . A l a r g e p o r t i o n o f t h e phosphorus i s probably t i g h t l y bound, e s p e c i a l l y i n i n o r g a n i c s o i l s , and w i l l l e a v e predominately by e r o s i o n . That phosphorus which i s e r o d e d i s s u b j e c t t o s e d i m e n t a t i o n i n a g r i c u l t u r a l d i t c h e s , i n stream d e p o s i t s , on swamp f o r e s t f l o o r s , and on t h e bottom of t h e Chowan R i v e r , and t h e r e f o r e much of i t w i l l n o t r e a c h t h e r i v e r . A r e f i n e d e s t i m a t e o f phosphorus y i e l d i s 1.52 xlo6
k g l y r .Recommendations
Based on t h i s i n v e s t i g a t i o n and a review of o t h e r s t u d i e s , t h e f o l l o w i n g recommendations a r e made:
Because a g r i c u l t u r e i s t h e dominant non-point s o u r c e of n i t r o g e n and phosphorus, Best Management P r a c t i c e s d e s i g n e d t o r e d u c e n u t r i e n t and sediment l o s s e s from a g r i c u l t u r a l l a n d s h o u l d be adopted. These should i n c l u d e r e g u l a r s o i l t e s t i n g , t i m i n g and a p p l i c a t i o n r a t e s o f f e r t i l i z e r t o match s p e c i f i c c r o p needs; n o - t i l l o r c o n s e r v a t i o n t i l l a g e ; c o n t o u r and t e r r a c i n g p r a c t i c e s ; u t i l i z a t i o n of a n i m a l waste a s a r e s o u r c e ; and u s e of sediment b a s i n s and g r a s s e d waterways f o r sediment c o n t r o l (Loehr 1977; N.C. Dept. N a t u r a l Resources and Community Development, D i v i s i o n o f Environmental Manage- ment 1982a, 1982b.)
F u r t h e r wetland d r a i n a g e and c h a n n e l i z a t i o n s h o u l d c e a s e i n t h e North C a r o l i n a Chowan watershed. It h a s been demonstrated i n numerous s t u d i e s t h a t swamp-bottomland f o r e s t ecosystems remove n u t r i e n t s and s i l t from s t r e a m s , Channelized s t r e a m s which have l o s t c o n t a c t w i t h t h e swamp f o r e s t c a r r y g r e a t e r amounts of n u t r i e n t s t h a n n a t u r a l s t r e a m s which a c t i v e l y
i n t e r a c t w i t h t h e f o r e s t e d wetland. I n c r e a s e d c h a n n e l i z a t i o n and d r a i n a g e bypass t h i s n a t u r a l system and s h u n t a g r i c u l - t u r a l w a s t e d i r e c t l y i n t o t h e Chowan R i v e r . A g r i c u l t u r a l d i t c h e s s h o u l d end a t t h e edge of t h e swamp f o r e s t and r u n o f f s h o u l d be d i v e r t e d t o move by s h e e t f l o w t h r o u g h t h e swamp i n s t e a d of d i s c h a r g i n g d i r e c t l y i n t o t h e s t r e a m . Water t a b l e s s h o u l d b e k e p t h i g h i n w i n t e r months i n low l y i n g f i e l d s t o i n c r e a s e d e n i t r i f i c a t i o n and d e c r e a s e n i t r a t e l o s s e s t o t h e r i v e r .
Due t o t h e importance of swamp f o r e s t s a s n u t r i e n t b u f f e r s f o r a g r i c u l t u r a l w a s t e , s p e c i a l p r o t e c t i o n s h o u l d b e g i v e n t o t h e s e a r e a s . It i s recommended t h a t no f u r t h e r r e d u c t i o n i n swamp f o r e s t o c c u r w i t h i n t h e North C a r o l i n a w a t e r s h e d . L a r g e t r a c t s i n c r i t i c a l l o c a t i o n s s h o u l d be purchased by t h e S t a t e o r by c o n s e r v a t i o n o r g a n i z a t i o n s , w i l d l i f e c l u b s , o r o t h e r o r g a n i z a t i o n s , and m a i n t a i n e d a s p r o d u c t i v e n a t u r a l w e t l a n d s . I n a d d i t i o n , t a x r e d u c t i o n s o r o t h e r i n c e n t i v e s which encour- a g e landowners t o keep bottomlands f u n c t i o n i n g a s n a t u r a l w e t l a n d s y s t e m s s h o u l d be g i v e n t o f a r m e r s and t i m b e r companies.
The t r e n d f o r m a i n t a i n i n g upland f o r e s t s w i t h i n t h e e n t i r e w a t e r s h e d s h o u l d be c o n t i n u e d s i n c e t h e s e f o r e s t s a r e a
s o u r c e of h i g h q u a l i t y w a t e r .
INTRODUCTION
The Chowan River watershed (12,650 km2), located in southeastern Virginia and northeastern North Carolina (Fig.
I),
is predominantly forested (76% of the area) but with an economically important agricul- tural region (22%). The watershed is sparsely populated (200,000 people) with most municipalities below 10,000 people. The Piedmont and Coastal Plain are the two major physiographic regions in the basin. Coastal Plain soils are generally either poorly drained or moderately well-drained sands, with some poorly drained peat soils along the lower river. Piedmont soils are nearly all loamy, well-drained soils (Humenik- -
et al. 1980). For a detailed description of the Chowan River watershed see U.S. Department of Agriculture(USDA
1981).Since the early 1970's the Chowan River has been experiencing extensive summertime blue-green algal blooms, symptomatic of eutrophi-
cation, because of excessive nutrients (Rohlich 1969; Stanley and Hobbie 1977; Sauer and Kuenzler 1981; Balducci 1982; Kuenzler
- -
et al. 1982; Paerl 1982; Stone 1982). Eutrophication often results inundesirable changes in water quality and in natural biological commu- nities, the advent of nuisance algal blooms and anoxic bottom-water conditions, and decreased commercial and recreational fish catches. Although much of the terminology and methodology developed for describing and studying eutrophication has come from the investigation of lakes, the same principles can be applied to the Chowan River. The prolonged effects of increased nutrient loading result in similar changes in rivers: changes in community structure, such as the devel- opment of large populations of blue-green phytoplankton and the
dominance of less desirable pollution-tolerant fish species.
Nutrients which cause eutrophication come from point sources such as municipal sewage and industrial wastes, non-point sources such as urban runoff and drainage from agricultural land, and natural sources such as runoff from forests, precipitation, and sediment recycling. This study will focus primarily on non-point source pollution.
According to Adamkus (1976), non-point sources of pollution (NPS) are :
1) discharges which enter surface waters in a diffuse manner and at intermittent intervals that are related mostly to the occurrence of precipitation events;
2 ) pollution sources which arise over an extensive area of land and most of which is in transit overland before it reaches surface water (although some may enter as groundwater);
3 ) sources which cannot be monitored at their point of origin (such as a drainage pipe), and the exact source of which is difficult to trace, and
Within the United States, non-point sources contribute roughly
80% of the total nitrogen load and more than 50% of the total phospho-
rus load to receiving waters (Novotny and Chesters 1981).
The impact
of NPS on water quality depends on the distance of the source from the
nearest stream or river, and the overland flow process which occurs en
route. The most severe impact from NPS usually occurs during or
following a major storm event, when the highest loadings (and concen-
trations) of pollutants are measured (Novotny and Chesters 1981).
Within the Chowan River basin, the non-point sources are agricul-
tural runoff and erosion, and natural sources such as precipitation
and runoff from forests and wetlands. Agricultural runoff is a major
non-point source contributor throughout the United States (Table 1).
Fertilizer nutrients, sediment, and animal waste are generally the
most significant sources of nutrients in agricultural NPS pollution
(Loehr 1977).
The amount of nutrients in the runoff and the quantity
of that runoff depend on the type of farming, fertilizer practices,
and drainage practices of the area (Keeney and Walsh 1972).
In recent
decades throughout the U.S., agricultural production has become more
efficient due to greater mechanization and increased use of agricul-
tural chemicals, both pesticides and fertilizers. Natural sources are
generally considered background sources with which the natural river
system developed. Forest runoff is a source of this type. Runoff from
wetlands and the nutrient content of precipitation are natural sources
which can also have
acultural nutrient component (Loehr 1977).
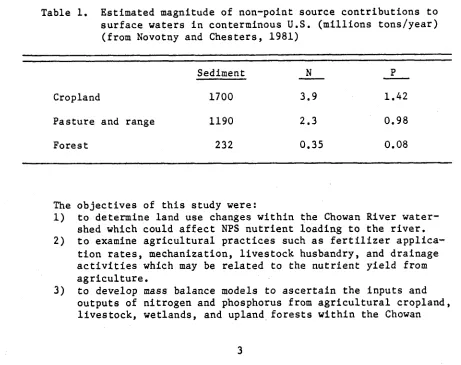
Table 1. Estimated magnitude of non-point source contributions to
surface waters in conterminous U.S. (millions tons/year)
(from Novotny and Chesters, 1981)
Sediment
-
N
-
P
Cropland
1700
3.9
1.42
Pasture and range
1190
2.3
0.98
Forest
232
0.35
0.08The objectives of this study were:
1) to determine land use changes within the Chowan River water-
shed which could affect NPS nutrient loading to the river.
2) to examine agricultural practices such as fertilizer applica-
tion rates, mechanization, livestock husbandry, and drainage
activities which may be related to the nutrient yield from
agriculture.
Basin. By t h i s procedure, t h e r e l a t i v e c o n t r i b u t i o n , magnitude, and s i g n i f i c a n c e o f each NPS can be determined.
4 ) t o s u g g e s t management recommendations t h a t might a m e l i o r a t e poor water q u a l i t y i n t h e Chowan River.
T h i s r e p o r t t o Water Resources Research I n s t i t u t e i s s l i g h t l y m o d i f i e d from a t e c h n i c a l r e p o r t by Nancy J. C r a i g i n p a r t i a l
f u l f i l l m e n t of t h e r e q u i r e m e n t s f o r t h e Master o f S c i e n c e i n P u b l i c H e a l t h , Department of Environmental S c i e n c e s and E n g i n e e r i n g ,
METHODS
S o u r c e s of I n f o r m a t i o n
A g r i c u l t u r a l t r e n d s
The primary s o u r c e of i n f o r m a t i o n f o r a g r i c u l t u r a l t r e n d s i n t h e Chowan Basin f o r t h e y e a r s 1950 t h r o u g h 1 9 7 8 was t h e U.S. Census of A g r i c u l t u r e , (U.S. Bureau of Census (U.S.B.C.) 1952, 1 9 6 1 , 1967, 1972, 1977, 1981). I n 1950 t h e d e f i n i t i o n of f a r m was a p l a c e o f t h r e e o r more a c r e s ( 1 a c r e = .405 h e c t a r e s ) o n which t h e v a l u e of a g r i c u l t u r a l p r o d u c t s s a l e s , e x c l u s i v e of home g a r d e n s , amounted t o $150 o r more. Farms were counted i n t h e c e n s u s i f t h e y were l e s s t h a n t h r e e a c r e s b u t had s a l e s of a g r i c u l t u r a l p r o d u c t s of $150 o r more (U.S.B.C. 1 9 5 2 ) . By 1959 t h e d e f i n i t i o n o f farm had changed t o i n c l u d e p l a c e s of l e s s t h a n 1 0 a c r e s i f s a l e s amounted t o a t l e a s t $250. P l a c e s of 1 0 o r more a c r e s were c o n s i d e r e d farms i f s a l e s amounted t o a t l e a s t $50 o r would normally be e x p e c t e d t o produce a g r i c u l t u r a l p r o d u c t s i n s u f f i - c i e n t q u a n t i t y t o meet t h a t r e q u i r e m e n t (U.S.B.C. 1 9 6 1 ) . I n 1974, t h e d e f i n i t i o n of farm had once a g a i n changed. A farm was t h e n c o n s i d e r e d a n y e s t a b l i s h m e n t which d u r i n g t h e c e n s u s y e a r had o r n o r m a l l y would have had s a l e s of a g r i c u l t u r a l p r o d u c t s of $1,000 o r more. The c r i t e r i o n f o r t h e minimum number of a c r e s i n t h e farm was d e l e t e d . The 1969, 1974, and 1978 c e n s u s e s were c o n d u c t e d by m a i l whereas e a r l i e r c e n s u s e s had been c o l l e c t e d by c e n s u s p e r s o n n e l . Due t o t h e change i n method of d a t a c o l l e c t i o n and f a r m d e f i n i t i o n , c e n s u s d a t a a r e n o t e x a c t l y comparable. However, t h e y a r e t h e most thorough and complete d a t a s o u r c e f o r b o t h North C a r o l i n a and V i r g i n i a c o u n t i e s w i t h i n t h e Chowan Basin.
Recent f e r t i l i z e r t r e n d s were based o n s t a t e a g r i c u l t u r a l s t a t i s - t i c s (N.C. Department of A g r i c u l t u r e 1973-1981; V i r g i n i a Department of A g r i c u l t u r e and Commerce, D i v i s i o n o f P r o d u c t and I n d u s t r y R e g u l a t i o n 1956-1981). North C a r o l i n a h i s t o r i c a l f e r t i l i z e r t r e n d s were c o l l e c t e d from t h e U.S. Census of A g r i c u l t u r e due t o l a c k of r e p o r t i n g by t h e s t a t e a g e n c i e s i n t h e 1 9 6 0 ' s and 1 9 5 0 ' s . The f e r t i l i z e r d a t a i n North C a r o l i n a i s based on t o n s r e c e i v e d i n t h e c o u n t i e s from m a n u f a c t u r e r s f o r r e t a i l e r s and consumers. To c a l c u l a t e t h e amount of n i t r o g e n i n t h e f e r t i l i z e r s o l d , t h e p e r c e n t a g e of n i t r o g e n i n e a c h t y p e of
f e r t i l i z e r m a t e r i a l ( s u c h a s anhydrous ammonia, ammonia n i t r a t e , ammonia s u l f a t e , e t c . ) was d e t e r m i n e d and summed, The same p r o c e d u r e was f o l l o w e d f o r phosphorus i n f e r t i l i z e r m a t e r i a l s . The p e r c e n t a g e
of n i t r o g e n and phosphorus i n mixed f e r t i l i z e r tonnage was a l s o
c a l c u l a t e d . The sums of t o t a l N and t o t a l P ( a s e l e m e n t a l N and P) i n f e r t i l i z e r m a t e r i a l s and mixed f e r t i l i z e r e q u a l s t h e t o t a l amount of N
and P s o l d (and assumed a p p l i e d ) f o r t h e c o u n t i e s i n North C a r o l i n a . V i r g i n i a ' s s t a t i s t i c s a r e a l s o based on s a l e s and d i s t r i b u t i o n of f e r t i l i z e r . The s o u r c e of d a t a used f o r V i r g i n i a i s t h e p u b l i c a t i o n , F e r t i l i z e r Used and R e s u l t s of I n s p e c t i o n , and d a t a a r e p r e s e n t e d a s consumption by c o u n t i e s i n t o t a l m i x t u r e , t o t a l m a t e r i a l s , and t o t a l n u t r i e n t s of n i t r o g e n and phosphorus.
and weighing maps of t h e t o t a l county and t h a t p o r t i o n o f t h e c o u n t y w i t h i n t h e Chowan Basin. ( S e e T a b l e 2). T h i s p r o c e d u r e assumed t h a t
farmland was e v e n l y d i s t r i b u t e d w i t h i n e a c h county.
Drainage d a t a
Data o n a r t i f i c i a l d r a i n a g e of a g r i c u l t u r a l l a n d s was o b t a i n e d from t h e U.S. Census of A g r i c u l t u r e S p e c i a l Reports: D r a i n a g e of A g r i c u l t u r a l Lands (U.S.B.C. 1942-1981). Land d r a i n e d r e f e r s t o a n
a r e a of a g r i c u l t u r a l l a n d b e n e f i t e d t o some e x t e n t by w a t e r removal t o improve t h e s o i l environment f o r p l a n t growth and i n c l u d e s s u r f a c e and s u b s u r f a c e d r a i n a g e ( d i t c h e s , s u b s u r f a c e d r a i n s , d i k e s , pumping p l a n t s , and l a n d g r a d i n g ) . Drainage t h a t i s p a r t of i r r i g a t i o n s y s t e m s i s e x c l u d e d (U.S.B.C 1981). I n some c o u n t i e s d r a i n e d l a n d may exceed l a n d i n farms due t o d r a i n a g e of woodlands o r o t h e r l a n d s which a r e n o t p a r t of a n a g r i c u l t u r a l o p e r a t i o n . I n most c o u n t i e s , however, d r a i n e d l a n d can b e r e l a t e d d i r e c t l y t o f i g u r e s f o r l a n d i n f a r m s (U.S.B.C. 1981).
I n t h e 1940 c e n s u s o f d r a i n a g e r e p o r t , a l l l e g a l l y o r g a n i z e d d r a i n a g e e n t e r p r i s e s r e g a r d l e s s of s i z e were covered. A d r a i n a g e e n t e r p r i s e was d e f i n e d a s t h e a r e a : ( 1 ) o r g a n i z e d i n one d r a i n a g e d i s t r i c t , ( 2 ) a s s e s s e d f o r t h e same p u b l i c d r a i n , o r ( 3 ) i n c o r p o r a t e o r p r i v a t e ownership d r a i n e d by works o p e r a t e d a s one u n d e r t a k i n g . The d a t a on d r a i n a g e by f a r m owners, i n d i v i d u a l l y o r c o o p e r a t i v e l y , w i t h o u t l e g a l o r g a n i z a t i o n were n o t c o l l e c t e d f o r 1940 f o r e n t e r p r i s e s of l e s s t h a n 500 a c r e s . The c e n s u s r e p o r t s t a t e s t h a t t h e e x c l u s i o n of t h e s e s m a l l e n t e r p r i s e s had a m a t e r i a l e f f e c t on t h e number of e n t e r p r i s e s c o v e r e d b u t had o n l y a minor e f f e c t on t h e amount of a r e a d r a i n e d (U.S.B.C. 1 9 4 2 ) , which was i m p o r t a n t f o r our purposes.
The 1959 and 1969 d r a i n a g e p r o j e c t s a l s o i n c l u d e o n l y t h o s e d r a i n a g e p r o j e c t s b e n e f i t i n g 500 o r more a c r e s (U.S.B.C. 1961, 1973). The 1978 a c r e a g e e s t i m a t e f o r a g r i c u l t u r a l l a n d a r t i f i c a l l y d r a i n e d s u b s t a n t i a l l y e x c e e d s e a r l i e r e s t i m a t e s . The r e p o r t s t a t e s t h a t t h i s r e s u l t s from c o l l e c t i o n of d a t a from s t a t e and c o u n t y S o i l C o n s e r v a t i o n S e r v i c e s o f f i c e s r a t h e r t h a n having i n d i v i d u a l f a n n e r s r e p o r t i t , a s was done p r e v i o u s l y . It f u r t h e r s t a t e s t h a t t h i s g r e a t l y improved t h e a c c u r a c y of t h e d a t a and p r e v i o u s y e a r s were u n d e r r e p o r t e d (U.S.B.C. 1 9 8 1 ) .
F o r e s t l a n d
Table 2. P e r c e n t a g e of county w i t h i n t h e Chowan R i v e r Basin.
NORTH CAROLINA PERCENT
B e r t i e 2 8
Chowan 50*
G a t e s 7 1
Her t f o r d 1 0 0
Northampton 6 9
V I R G I N I A
Brunswick Dinwiddie G r e e n s v i l l e
I s l e of Wight Lunenburg Mecklenberg Not toway P r i n c e George Southamp t o n Suf f o l k S u r r y Suss ex
PERCENT
9 2
92
1 0 0
5 0 1 0 0
1 7
5 3
5 1 100 30 60 100
1974).
The sampling procedures and methods of the U.S. Forest Service
(USFS) are designed to provide the most reliable atatistics at the
county and state levels (Cost 1975).
For the Chowan watershed, etatie-
tical analysis indicates a sampling error of
+0.5%for estimates of
total commercial forest area. The possibilitF
for error increases as
the total is subdivided by forest type.
Mass balance models
Mass balance models for nitrogen and phosphorus were calculated
for agricultural cropland, animal systems, swamp forest, and upland
forest. In recent years, agricultural mass balance models have become
common in the literature (Frink 1969; Gilliam and Terry 1973; Fried et
-
al. 1976; Frissel 1978; Schueler and Kemp 1979; Correll 1981).
The
-
mass balance method attempts to identify all inputs, storages, and
outputs of a particular nutrient within a defined system at steady
state, assuming the storage pool (soil system, forest system) is not
changing (Frissel 1978).
This assumption may not be true for phos-
phorus as will be addressed later in the Discussion section.
In the agricultural system there will naturally be year-to-year
fluctuations but these tend to be cancelled if long-term values are
used as this report did. To calculate the nutrient budget for agri-
culture, farming operations were broken down into two components,
cropland and animal systems. Quantities are expressed in kg (1 kg
=2.2 lb) of elemental nitrogen or phosphorus (not N20 or P205)
per year for the whole watershed or per unit area (hectare).
Finally,
note that the term "yield" has two common meanings, (1) the amount of
crop harvested from farmland, and (2) the amount of nutrient carried
away by runoff from the land.
Cropland
The mass balance for cropland has as its primary inputs fertil-
ization of the field, precipitation, and sometimes nitrogen-fixation
by legumes. The principal outputs are denitrification, harvested plant
biomass, leaching, surface runoff and erosion of soil. To arrive at
these numbers the following assumptions and calculations were made:
1)
The amount of fertilizer applied annually to a specific crop
was the average amount recommended by the state's agricultural exten-
sion agency.
2)
The average amount of nitrogen and phosphorus from precipi-
tation falls equally on the entire watershed. (Precipitation values
were calculated from Gambell and Fisher 1966; Kuenzler et al. 1977).
--
l i e d
4 ) D e n i t r i f i c a t i o n r a t e s were assumed t o be 15% of t h e app f e r t i l i z e r n i t r o g e n ( F r i s s e l 1978).
5 ) The amount h a r v e s t e d was d e t e r m i n e d by m u l t i p l y i n g t h e
n u t r i e n t c o n t e n t by t h e a v e r a g e a n n u a l y i e l d s (e.g., b u s h e l s l a c r e y r ) of t h e major c r o p s (Romaine 1965). Average y i e l d s were c a l c u l a t e d f o r y e a r s 1972-1980 f o r a l l major c r o p s i n V i r g i n i a and North C a r o l i n a
(N.C. Crop l a n d L i v e s t o c k R e p o r t i n g S e r v i c e 1972-1981, V i r g i n i a Department of A g r i c u l t u r e , D i v i s i o n of Chemistry and Foods, 1973-81.) According t o F r i s s e l ( 1 9 7 8 ) , t h i s i s a r e l i a b l e method t o c a l c u l a t e n u t r i e n t removals by c r o p s .
6 ) A p o r t i o n of t h e a g r i c u l t u r a l n u t r i e n t y i e l d ( e . g . , kg N/ha y r ) from major c r o p s i s removed by swamp f o r e s t s . To d e t e r m i n e t h i s amount w e assumed t h a t t h e h y d r o l o g i c i n p u t s p e r h e c t a r e i n t o t h e swamp system of t h e Chowan B a s i n a r e t h e same a s f o r C r e e p i n g Swamp, North C a r o l i n a , f o r which t h e r e i s e x t e n s i v e d a t a . We made t h i s a s s u m p t i o n because b o t h w a t e r s h e d s have t h e same p r o p o r t i o n s o f a g r i - c u l t u r e and upland f o r e s t s . I t was d e t e r m i n e d from t h e mass b a l a n c e models t h a t 86% of t h e h y d r o l o g i c i n p u t s i n t o t h e swamp s t r e a m s b a s i n were a g r i c u l t u r a l i n o r i g i n and 14X was due t o r u n o f f from f o r e s t s and w e t l a n d s . E i g h t y - s i x p e r c e n t of t h e n i t r o g e n and phosphorus i n p u t s i n t o t h e swamps were t h e r e f o r e s u b t r a c t e d from t o t a l n i t r o g e n and phosphorus y i e l d s from a g r i c u l t u r a l c r o p s , t o c a l c u l a t e t h e r e d u c t i o n i n n u t r i e n t y i e l d s from c r o p l a n d due t o removal by t h e swamp. Swamp p r o c e s s i n g removes 83% of t h e t o t a l N and 51% of t h e t o t a l P from w a t e r p a s s i n g t h r o u g h t h e swamp. ( S e e D i s c u s s i o n : Swamp Mass Balance Model.)
7 ) The amount a v a i l a b l e t o t h e r i v e r i n s u r f a c e r u n o f f and l e a c h i n g from s o i l s i s t h e d i f f e r e n c e between o u t p u t s and i n p u t s .
Each mass b a l a n c e model was c a l c u l a t e d i n k g l h a a y r f o r e a c h
major c r o p w i t h i n t h e b a s i n , s e p a r a t i n g North C a r o l i n a and V i r g i n i a f o r comparative purposes. T o t a l i n p u t s , o u t p u t s , and e x c e s s e s ( l o 6 k g l y r ) were c a l c u l a t e d by m u l t i p l y i n g v a l u e s i n k g l h a y r by t h e a v e r a g e a c r e a g e of t h a t c r o p (1972-1980).
Animals: d a i r y cows, beef c a t t l e , h o g s , and c h i c k e n s
Mass b a l a n c e s f o r n i t r o g e n and phosphorus i n t a k e s , p r o d u c t s , and e x c r e t a were determined f o r d a i r y cows, b e e f c a t t l e , h o g s , and c h i c k e n s w i t h i n t h e Chowan b a s i n . These were c a l c u l a t e d by u s i n g v a l u e s i n T a b l e 3 and a n e i g h t y e a r a v e r a g e f o r t h e number of a n i m a l s i n e a c h g r o u p i n g . B r o i l e r c h i c k e n numbers f o r V i r g i n i a a r e o n l y f o r t h e y e a r 1978 (U.S.B.C. 1981). F i v e p e r c e n t of t h e n i t r o g e n and phosphorus e x c r e t e d by a n i m a l s was assumed a v a i l a b l e t o s t r e a m s (Robbins e t a l e
--
1972; F r i s s e l 1978).swam^-forest system
Table
3.Annual N and P balances for livestock systems
(adapted from Frissel 1978)
N (kglhead)
P (kg/head)
Class of Livestock Intake Product Excreted Intake Product Excreted
Cattle
Dairy cows
166
4
6
120
28
8
20
Beef
48
12
36
7
3
4
Chickens
Broilers
0.82
0.43
0.39
0.21
0.09
0.12
Layers
1.10
0.28
0.83
0.27
0.03
0.24
Hogs
8.7
2.6
6.1
1.80
0.28
1.53
precipitation, other hydrologic inputs such as streams and rivers, and
nitrogen fixation. The outputs were harvesting of timber, denitri-
fication, and outflow of swamp water carrying nutrients from the
sediment-water storage. Phosphorus sedimentation onto the swamp
forest floor and nitrogen and phosphorus accumulation in wood incre-
ment were also calculated. To derive the values for these inputs,
outputs, and cycles the following assumptions were made:
1) Precipitation values were the same as for major crops.
2) Hydrologic inputs, other than precipitation, were based on
the nitrogen and phosphorus inputs into Creeping Swamp, North Carolina,
(Neuse River drainage), and extrapolated for the entire Chowan River
watershed. This extrapolation is reasonable because the proportion of
agricultural land to forest in the Creeping Swamp watershed closely
match those proportions in the Chowan watershed. These inputs include
drainage from agriculture, upland forest and swamp forest (~arbro
-
et
al. 1981).
-
3) The amount of nitrogen fixation occurring due to alder and
bacterial metabolism is unknown. According to Kadlec and Kadlec
(1978) the contribution of nitrogen fixation to the nitrogen budget of
a
freshwater wetland has never been studied.
4 )
The amount of nitrogen loss was based on values by Brinson
(1981) of 75% removal of NH4 and 94% removal of NO3 by the swamp
system. Assuming NH4 is 17% of TN and NO3 is 43% of TN (Kuenzler
et al. 1977), the amount of total nitrogen loss was calculated.
--
f o r e s t t r e e s p e c i e s (M. Messina, Department of F o r e s t r y , North C a r o l i n a S t a t e U n i v e r s i t y , p e r s o n a l communication).
6) The amount h a r v e s t e d i n d r y w e i g h t was c a l c u l a t e d by m u l t i - p l y i n g t h e a n n u a l amount removed i n growing s t o c k (USFS 1974) by t h e a v e r a g e s p e c i f i c g r a v i t y of swamp f o r e s t s p e c i e s (.58 gm/cm3) a f t e r c o n v e r t i n g from f t 3 t o cm3. N i t r o g e n and phosphorus h a r v e s t e d was determined by m u l t i p l y i n g t h e d r y w e i g h t by t h e a v e r a g e p e r c e n t of n i t r o g e n and phosphorus i n t h e stem of swamp f o r e s t s p e c i e s (.24% N,
.03% P of d r y w e i g h t ) (M. Messina, p e r s o n a l communication).
Upland f o r e s t
A mass b a l a n c e model was a l s o c a l c u l a t e d f o r upland f o r e s t . The
USFS 1974, 1976a, and 1976b a c r e a g e f o r a l l t y p e s of upland f o r e s t were summed f o r t o t a l a c r e a g e . The o n l y i n p u t i n t o t h e system was assumed t o be p r e c i p i t a t i o n . Although some w e a t h e r i n g may o c c u r , t h i s v a l u e was undetermined. Outputs were t i m b e r h a r v e s t i n g and r u n o f f . The f o l l o w i n g assumptions were made f o r t h e upland f o r e s t model:
1) P r e c i p i t a t i o n i n p u t v a l u e s were t h e same a s major c r o p s .
2 ) N u t r i e n t o u t p u t s were c a l c u l a t e d from l i t e r a t u r e v a l u e s o f a n
a n n u a l y i e l d of 1.12 kg N/ha and .56 kg P/ha (Loehr 1974; N.C.
RESULTS
A g r i c u l t u r a l Changes, 1950-1978
Over t h e p a s t t h r e e decades s i g n i f i c a n t changes have o c c u r r e d i n a g r i c u l t u r a l l a n d u s e and p r a c t i c e i n t h e Chowan River Basin. The number of farms i n t h e b a s i n h a s d e c r e a s e d from 20,562 i n 1950 t o 5,403 i n 1978 ( F i g . 2 ) r e s u l t i n g i n a d e c r e a s e i n t o t a l farm a c r e a g e . The
FARMS
CHOWAN
RIVER BASIN
t ~ 3 2o 0 PERCENTAGE
2
a
8
LL
80
0 15 v,
m
E
CI
60
z
LL5
cn
3
1
0
40
z
0 I-
I
ZI-
20
8
[r
W
5
o
a
0
F i g u r e 2. Change i n number of farms and p e r c e n t a g e of a r e a i n farms i n t h e Chowan Basin,1950-1978.
p e r c e n t a g e o f t o t a l l a n d a r e a i n t h e w a t e r s h e d devoted t o f a r m i n g h a s d e c r e a s e d from 63% t o 41% ( F i g . 2). The a v e r a g e f a r m s i z e h a s more t h a n doubled, however, i n t h i s same t i m e p e r i o d ( T a b l e 4 ) . The change i n l a n d u s e on farms (1950-1978) shows a s i g n i f i c a n t d e c r e a s e i n farm woodland w i t h a s l i g h t d e c r e a s e i n t o t a l c r o p a c r e a g e and p a s t u r e l a n d ( F i g . 3 ) . Harvested c r o p l a n d h a s s t a y e d r o u g h l y t h e same d u r i n g t h i s time p e r i o d ( F i g . 3 ) . The a r e a devoted t o seven major c r o p s w i t h i n t h e b a s i n ( F i g . 4 ) c o n s t i t u t e s most o f t h e h a r v e s t e d c r o p l a n d ( F i g .
3 ) . Corn, soybeans, and peanuts were t h e dominant c r o p s i n terms o f
Table 4. Average farm s i z e ( h e c t a r e s ) and p e r c e n t of t o t a l c r o p l a n d t h a t was h a r v e s t e d i n t h e Chowan b a s i n , y e a r s 1950-1978,
( U . S . B . C . Census of A g r i c u l t u r e 1952, 1961, 1967, 1972, 1977, 1981)
Average s i z e farm % t o t a l c r o p l a n d Year ( h e c t a r e s ) h a r v e s t e d
T o t a l Chowan 1 9 50 1959 1964 1969 1974 1978
North C a r o l i n a 1950 1960 1964 1969 1974 1978
V i r g i n i a 1950 1959 1964 1969 1974 1978
decreased. Harvest y i e l d s of f i v e major c r o p s a l l showed modest t o marked i n c r e a s e s from 1950 t o 1978 ( F i g . 5 ) .
Change i n t h e number of farm a n i m a l s w i t h i n t h e time p e r i o d examined does n o t appear t o be l a r g e , e x c e p t f o r t h e i n c r e a s e i n
number of b r o i l e r c h i c k e n s ( F i g . 6 ) . The number of commercial b r o i l e r s o v e r t h e p a s t decade has d r a s t i c a l l y i n c r e a s e d from .06 x 106 t o
14.5 x
lo6,
a 74-fold i n c r e a s e (B. Young, Department o f B i o l o g i c a l and A g r i c u l t u r a l Engineering, p e r s o n a l communication). The number of farm machines used i n t h e watershed h a s n e a r l y t r i p l e d from 1950-1978 ( n o t shown) t o a t o t a l of approximately 5500.CHOWAN RIVER BASIN
AREAS IN MAJOR L A N D USED
8
FARM w O ~ U ~
11
HARVESTED CROPLAND1 1 ! I I L I ,
5 0 55 60 65 70 75 80
YEAR
F i g u r e 3 . Changes i n a r e a s of major a g r i c u l t u r a l l a n d u s e s i n t h e Chowan B a s i n .
CHOWAN RIVER BASIN
AREAS PLANTED
-
MAJOR CROPS22
k
k
i
55CORN
-
GRAINI'0
I
I I I I I I I50 55 60 65 70 75 80
YEAR
F i g u r e 4. Changes i n a r e a s d e v o t e d t o major c r o p s i n t h e Chowan
YIELDS OF MAJOR CROPS
CHOWAN RIVER BASIN
YEAR
F i g u r e 5. Changes i n y i e l d s of major c r o p s i n t h e Chowan Basin
1950-1978.
LIVESTOCK NUMBERS CHOWAN RNER BASIN
500
YEAR
F i g u r e
6 .
Changes i n number of farm a n i m a l s i n t h e chowan B a s i n1950-1978.
t o n n a g e d o u b l e d from 1957 t o 1976 i n V i r g i n i a and t h e n d r o p p e d t o t h e 1957 v a l u e , w h i l e p h o s p h o r u s f e r t i l i z e r t o n n a g e r e m a i n e d c o n s t a n t . Commercial f e r t i l i z e r u s a g e i n N o r t h C a r o l i n a h a s remained e s s e n t i a l l y s t a b l e o v e r t h e p a s t s i x t e e n y e a r s (1958-1974) w i t h a s l i g h t i n c r e a s e i n m e t r i c t o n s / h e c t a r e o f c r o p l a n d , C u r r e n t f e r t i l i z e r u s a g e (1973- 1 9 8 0 ) i n t h e w a t e r s h e d h a s a l s o remained f a i r l y c o n s t a n t w i t h a p e a k o c c u r r i n g i n 1976 ( F i g . 8 ) .
Ownership p a t t e r n s o f f a r m s changed from 1950-1978 ( T a b l e 5 ) .
Full-owners a r e t h o s e who own l a n d a n d d o n o t r e n t from o t h e r s . P a r t - owners own some l a n d and r e n t some, a n d t e n a n t s r e n t e n t i r e l y f r o m o t h e r s . The p e r c e n t a g e s o f f u l l - o w n e r s a n d t e n a n t s h a v e d e c r e a s e d w h i l e p e r c e n t a g e o f p a r t - o w n e r s h a s more t h a n d o u b l e d .
Land a r t i f i c i a l l y d r a i n e d f o r a g r i c u l t u r e i n t h e w a t e r s h e d o v e r t h e p a s t 30 y e a r s h a s i n c r e a s e d e x p o n e n t i a l l y from 905 h e c t a r e s i n 1 9 4 0 ( p r i m a r i l y i n G a t e s County, NC) t o 1 2 4 , 0 3 5 h e c t a r e s i n 1 9 7 8
( F i g . 9 ) . A p p r o x i m a t e l y 31X o f t o t a l l a n d and 67% o f l a n d i n f a r m s o f t h e N o r t h C a r o l i n a s e c t i o n o f t h e Chowan R i v e r w a t e r s h e d i s a r t i f i - c i a l l y d r a i n e d ( T a b l e 6 ) . Much l e s s d r a i n a g e h a s t a k e n p l a c e i n V i r g i n i a ; a p p r o x i m a t e l y 2% o f t h e t o t a l l a n d a n d 6% o f f a r m l a n d i s a r t i f i c i a l l y d r a i n e d . For t h e t o t a l Chowan R i v e r w a t e r s h e d , a b o u t 9.7% o f t h e t o t a l l a n d a n d 2 3 . 6 % o f f a r m l a n d i s a r t i f i c i a l l y d r a i n e d ( T a b l e 6 ) . The amount o f l a n d d r a i n e d i n S o i l C o n s e r v a t i o n S e r v i c e (S.C.S.) p r o j e c t s i n N o r t h C a r o l i n a i s 4.5 x
lo4
h e c t a r e s by t h e c h a n n e l i z a t i o n o f 1 0 0 km o f s t r e a m s ( T a b l e 7 ) . No c o m p l e t e d S.C.S. w a t e r s h e d d r a i n a g e p r o j e c t s were r e p o r t e d i n t h e V i r g i n i a w a t e r s h e d .Changes i n F o r e s t
The a r e a o f commercial f o r e s t l a n d i n t h e Chowan w a t e r s h e d h a s i n c r e a s e d i n t h e y e a r s 1964 t o 1974 ( T a b l e 8). For t h e t o t a l b a s i n t h e r e was a n i n c r e a s e i n l o b l o l l y - s h o r t l e a f p i n e , o a k - h i c k o r y , oak- gum-cypress, a n d elm-ash-cottonwood f o r e s t , a n d a small d e c r e a s e i n o a k - p i n e f o r e s t . However, i n t h e N o r t h C a r o l i n a Chowan w a t e r s h e d t h e r e h a s been a n e t d e c r e a s e o f 9 x
lo3
h e c t a r e s o v e r t h e t e n y e a r p e r i o d . A l l f o r e s t t y p e s i n North C a r o l i n a e x c e p t f o r o a k - h i c k o r y h a v e d e c r e a s e d b u t t h e l a r g e s t d e c r e a s e (-21.3 xl o 3
h e c t a r e s ) wasi n oak-gum-cypress, which i s f o r e s t e d w e t l a n d . T h i s amounts t o 302 l e s s o f t h i s t y p e o f f o r e s t i n N o r t h C a r o l i n a s i n c e 1 9 6 4 a n d a 24%
oak-gum-cypress d e c r e a s e f o r t h e t o t a l w a t e r s h e d . I n t h e V i r g i n i a p o r t i o n of t h e w a t e r s h e d t h e r e h a s b e e n a n i n c r e a s e i n e a c h o f t h e f o r e s t t y p e s f r o m 1964-1974 ( T a b l e 8 ) . Bottomland t y p e s (oak-gum- c y p r e s s and elm-ash-cottonwood) c o n s t i t u t e d 2 7 % o f t h e c o m m e r c i a l f o r e s t i n N o r t h C a r o l i n a a n d 1 0 % i n V i r g i n i a ( T a b l e 9 ) .
Ownership p a t t e r n s o f commercial f o r e s t i n t h e b a s i n t h r o u g h t h e y e a r s 1964-1974 h a v e n o t changed s f g n i f i c a n t l y . F a r m e r s own r o u g h l y h a l f , a n d t h e f o r e s t i n d u s t r y r o u g h l y a q u a r t e r of t h e c o m m e r c i a l f o r e s t . The r e m a i n d e r i s owned by m i s c e l l a n e o u s c o r p o r a t i o n s and i n d i v i d u a l s , t h e s t a t e , a n d c o u n t i e s and m u n i c i p a l i t i e s . T h e r e i s n o n a t i o n a l f o r e s t w i t h i n t h e r i v e r b a s i n ( T a b l e 1 0 ) .
z
I I I57 60
I 65
I
70 75 80
YEAR
F i g u r e 7. H i s t o r i c a l t r e n d o f amounts of n i t r o g e n (X) and p h o s p h o r u s (P) from f e r t i l i z e r u s e d i n Chowan E a s i n .
FERTILIZER
22 ( CHOWAN RIVER BASIN
YEAR
T a b l e 5. P e r c e n t o f t o t a l number o f farms i n which o p e r a t o r was a f u l l - o w n e r , part-owner, o r t e n a n t i n Chowan
b a s i n . 1950-1978. (U.S.B.C. Census o f A g r i c u l t u r e 1952 1961, 1967, 1972, 1 9 7 7 , 1981)
Year
-
Full-owner X Part-owner % Tenant %1950 4 6 23 3 2
1 9 5 9 4 3 34 2 1
1 9 64 3 3 3 9 1 8
1 9 6 9 3 9 4 1 1 2
1974 3 3 49 1 2
1978 28 55
9
T a b l e 6. Land a r t i f i c i a l l y d r a i n e d by c o u n t y i n Chowan B a s i n a s p e r c e n t o f t o t a l l a n d and l a n d i n f a r m s , 1978. (U.S.B.C. Census of A g r i c u l t u r e 1981)
B e r t i e Chowan G a t e s H e r t f o r d Northampton TOTAL
VIRGINIA
Brunswick Dinwiddie G r e e n v i l l e
I s l e o f Wight Lunenburg Mecklenburg Nottoway P r i n c e George Southamp t o n Sur r y
S u s s e x Suf f o l k
CHOWAN BASIN TOTAL 1 2 4 , 0 3 5 9.7 23.6
Table 7. S o i l C o n s e r v a t i o n Watershed P r o j e c t s i n North C a r o l i n a Chowan Basin completed t o d a t e . (U.S.D.A., S o i l Conser- v a t i o n S e r v i c e (1977), U.S.D.A, S o i l C o n s e r v a t i o n S e r v i c e
(1981)).
Watershed
Date Drainage Channels
Completed Area ( h a ) C o n s t r u c t e d (km)
-
Ahoskie Creek 6/30/67 1 9 , 5 0 1 48.8 Burnt Mill Creek 11/02/62 4,251 5.2 Cutawhiskie Creek 6/22/66 12,049 33.5 Horse Swamp F l a t Swamp 10/08/64 3,779 16.2
P o l l o c k Swamp 04/30/66 5,862
-
13.4TOTAL 45,442 1 0 9 . 1 k
*23% s t r e a m l e n g t h s c h a n n e l i z e d by SCS
i s due t o p r a c t i c e s such a s mechanical s i t e p r e p a r a t i o n ( i n c l u d i n g chop and burn, r o o t r a k e and bed, and b u l l d o z i n g ) , l o g d e c k s , and w i l d f i r e (Burns 1977).
Mass b a l a n c e Models
Major c r o p models. A mass balance model was c a l c u l a t e d f o r each major c r o p of North C a r o l i n a ( c o r n f o r g r a i n , c o r n f o r s i l a g e ,
soybeans, peanuts, tobacco, c o t t o n , and wheat) and V i r g i n i a ( c o r n f o r g r a i n , c o r n f o r s i l a g e , p e a n u t s , soybeans, wheat, tobacco, and b a r l e y )
( F i g s , 10-17). Mass b a l a n c e models of n i t r o g e n and phosphorus f o r t h e major c r o p s i n t h e Chowan watershed i n c l u d e a l l known s i g n i f i c a n t i n p u t s and o u t p u t s f o r t h e agro-ecosystem. T o t a l i n p u t s of n i t r o g e n f o r e a c h c r o p i n c l u d e f e r t i l i z e r , p r e c i p i t a t i o n , and n i t r o g e n -
f i x a t i o n ; t o t a l i n p u t s of phosphorus i n c l u d e f e r t i l i z e r and p r e c i p i - t a t i o n . The o u t p u t s a r e t h e amount of n i t r o g e n and phosphorus
Table 8. Change i n a r e a (103 h a ) of commercial f o r e s t l a n d t y p e i n t h e Chowan Basin, 1964-1974. (USDA, F o r e s t S e r v i c e 1974, 1976a, 1976b)
TOTAL CHOWAN BASIN County
NORTH CAROLINA :
B e r t i e Chowan
Gates
Hertf o r d Northampton TOTAL h, VIRGINIA: Brunswick Dinwiddie G r e e n v i l l e I s l e o f Wight Lunenburg Mecklenberg No t toway P r i n c e George Southampton Suf f o l k S u r r y Sussex TOTAL
a l l g r o u p s
-0.62 -2.33 -1-18 -3.25 -1.75 -9.13 +1.82 +go. 50
-.02 +11.00
+3.60 -.09 +1. 04 +1.50 +74
.lo
-14.70 -,42
+.
33 +l65.7 +I%. 57l o b l o l l y - s h o r t l e a f
oak-
pine
-1.87 -2.04 -6.83 -3.41 -4.29 -18.44 -8.22 +20.08 -3.13 +2.21 -2.58 -2.62 -1.92 -3.32 +10.37 -1.98 +*77 -2.62 +7.04 -11.40 oak- h i c k o r y+4.04 +5.13 +4.61 +lo. 74
+7 -07 +3l. 59
+10.37 +30.89 -11.09
+.
57 -4.52 +1.35 -1.56+.
29 +lo. 0 3-4.94 +2.89 -15.06 +l9.22 +SO. 8 1
oak-gum- c y p r e s s
-3.25 -3.88 +.02 -8.87 -5.33 -21.31 0 +1.22 +5.74 +3.21 0