University of Windsor University of Windsor
Scholarship at UWindsor
Scholarship at UWindsor
Electronic Theses and Dissertations Theses, Dissertations, and Major Papers
1-1-2007
Parameters affecting coagulation/flocculation of drinking water
Parameters affecting coagulation/flocculation of drinking water
under cold temperatures.
under cold temperatures.
Omar Alshikh
University of Windsor
Follow this and additional works at: https://scholar.uwindsor.ca/etd
Recommended Citation Recommended Citation
Alshikh, Omar, "Parameters affecting coagulation/flocculation of drinking water under cold temperatures." (2007). Electronic Theses and Dissertations. 6987.
https://scholar.uwindsor.ca/etd/6987
PARAMETERS AFFECTING COAGULATION / FLOCCULATION OF DRINKING WATER UNDER COLD TEMPERATURES
by
Omar Alshikh
A Thesis
Submitted to the Faculty o f Graduate Studies through Civil and Environmental Engineering in Partial Fulfillment
o f the Requirements for the Degree o f Master o f Applied Science at the
University o f Windsor
Windsor, Ontario, Canada
Library and Archives Canada
Bibliotheque et Archives Canada
Published Heritage Branch
395 W ellington S treet O ttaw a ON K1A 0N4 C a n a d a
Your file Votre reference ISBN: 978-0-494-35012-6 Our file Notre reference ISBN: 978-0-494-35012-6
Direction du
Patrimoine de I'edition
395, rue W ellington O ttaw a ON K1A 0N4 C a n a d a
NOTICE:
The author has granted a non exclusive license allowing Library and Archives Canada to reproduce, publish, archive, preserve, conserve, communicate to the public by
telecommunication or on the Internet, loan, distribute and sell theses
worldwide, for commercial or non commercial purposes, in microform, paper, electronic and/or any other formats.
AVIS:
L'auteur a accorde une licence non exclusive permettant a la Bibliotheque et Archives Canada de reproduire, publier, archiver,
sauvegarder, conserver, transmettre au public par telecommunication ou par I'lnternet, preter, distribuer et vendre des theses partout dans le monde, a des fins commerciales ou autres, sur support microforme, papier, electronique et/ou autres formats.
The author retains copyright ownership and moral rights in this thesis. Neither the thesis nor substantial extracts from it may be printed or otherwise reproduced without the author's permission.
L'auteur conserve la propriete du droit d'auteur et des droits moraux qui protege cette these. Ni la these ni des extraits substantiels de celle-ci ne doivent etre imprimes ou autrement reproduits sans son autorisation.
In compliance with the Canadian Privacy Act some supporting forms may have been removed from this thesis.
While these forms may be included in the document page count,
Conformement a la loi canadienne sur la protection de la vie privee, quelques formulaires secondaires ont ete enleves de cette these.
ABSTRACT
Raw water temperatures in Ontario drop below 5.0 °C for several months during the year.
Bench scale experiments were conducted using jar test apparatus to examine the effect o f
raw water temperatures on the treatment efficiency o f the coagulation/flocculation (CF)
process, using alum as the primary coagulant, and a cationic polymer Maganafloc LT-22
as a coagulant aid, over a temperature range o f 1.0 - 22.0 °C. Temperature adversely
affected alum coagulation, with residual turbidity increasing with reducing temperatures.
The adverse effect on residual turbidity was partly compensated by increasing alum and
Magnafloc LT-22 dosages.
Test results at about 3.5 °C suggest that polyaluminum chloride (PAC1) blend (Sumaclear
-750) may be a better primary coagulant than alum for the CF process at low
temperatures. Residual turbidity levels similar to or lower than that observed with alum
DEDICATION
ACKNOWLEDGEMENTS
The author is indebted to his advisors Professor Nihar Biswas and Dr. Rajesh Seth for
their guidance and support throughout this research and thesis writing. W ithout their
timely suggestions and advice this work would be incomplete.
Special thanks to the Walkerton Clean Water Centre for their financial support and for
Dr. Saad Jasim for his experienced notes during discussions. Mr. Glen Bondy and the
staff o f A. H Weeks Treatment Plant in Windsor- Ontario are thankfully acknowledged
for the materials they delivered to support this research, and for the valuable information
they provided through documents and discussions. The author would like to thank Dr.
Sirinart Anavoranich from the Chemistry Department at the University o f Windsor for
allowing the storage o f the raw water at their cold room.
Furthermore the author would like to express his deepest gratitude to his family for being
supportive to him all the way during the work progress. Also, he would like to thank
colleagues and friends for their encouragement and support. The Department o f Civil and
Environmental Engineering and the Faculty o f Graduate Studies and Research are
TABLE OF CONTENTS
A BSTRACT...I ll
DEDICATION... IV
ACKNOW LEDGEM ENTS... V
TABLE OF CO NTENTS... VI
LIST OF T A B L E S ... IX
LIST OF F IG U R E S ... X
LIST OF ABBREVIATIONS AND SYM BO LS... XIII
1 IN TR O D U C TIO N ... 1
1.1 Ba c k g r o u n d... 1
1.2 Ra w w a t e rt e m p e r a t u r e sin On t a r io... 3
1.3 Re s e a r c ho b je c t iv e s...5
1.4 Or g a n iz a t io no ft h e s i s...6
2 REVIEW OF LITERA TURE...8
2.1 Ov e r v ie wo nc o a g u l a t io n / f l o c c u l a t io np r o c e s s... 8
2.1.1 Colloidal particles and natural organic matter (NOM )...10
2.1.2 Interaction between N O M and inorganic m atter... 12
2.1.3 Zeta p o ten tia l...14
2.1.4 Coagulation mechanisms...16
2.1.5 Flocculation and particle transport in w a ter...21
2.2 C o a g u l a n t s a n d t h e i r r e a c t i o n s ... 22
2.2.1 Aluminum sulfate (Alum)...23
2.2.2 Polymers (coagulant aids)...24
2.3 Pa r a m e t e r sa f f e c t in gc o a g u l a t io n/ f l o c c u l a t io np r o c e s s...27
2.3.1 Controllable p aram eters...27
2.3.2 Uncontrollable param eters...31
2.4 Te m p e r a t u r ee f f e c to nd if f e r e n tp a r a m e t e r s... 37
2.4.1 Effect on solubility...37
2.4.2 Effect on reaction rate...39
2.4.3 Effect on velocity gradient....41
2.4.4 Effect on flocculation andfiltration...43
2.5 S u m m a r y ...43
3 M ATERIALS AND M E T H O D S... 45
3.1 Ra wm a t e r ia l s... 45
3.1.1 Raw water...45
3.1.2 Chemicals...46
3.2 An a l y t ic a lm e t h o d s... 47
3.2.1 Turbidity...47
3.2.2 p H ....48
3.2.3 Temperature...48
3.2.4 Total Organic Carbon...49
3.3 Ex p e r im e n t a ls e t u pa n dc h e m ic a ls o l u t io n sp r e p a r a t io n... 50
3.3.1 Equipment setup...50
3.3.2 Working solutions preparation...52
3.4 Se l e c t io no fo p e r a t in gp a r a m e t e r s... 53
3.5 Ex p e r im e n t a lp h a s e s... 54
3 .5 .1 Phase I: Effect o f temperature on residual turbidity...54
3.5.2 Phase II: Effect o f different alum and polym er dose at low temperature...56
4.1 Re s u l t s... 59
4.1.1 Results fo r phase 1...59
4.1.2 Results fo r phase II....64
4.1.3 Results fo r Phase III...67
4.2 Dis c u s s io n... 74
4.2.1 Effect o f temperature on alum coagulation...74
4.2.2 Effect o f alum and polym er dose at low temperature...76
4.2.3 Effect o f using PACl blend as an alternative at low tem perature...77
5 CONCLUSIONS AND RECOM M ENDATIONS...80
5.1 Co n c l u s io n s... 80
5.2 Re c o m m e n d a t io n s... 81
APPENDIX A: DATA FO R EX PER IM EN TS... 83
APPENDIX B: LETTERS OF PER M ISSIO N ... 86
REFER ENCES...90
LIST OF TABLES
Table 2-1: Aluminium ions solubility constant (Pemitsky and Edzwald, 2003)...38
Table 2-2: Temperature and power relationship (Nomographs on velocity gradients, 1978)...43
Table 3-1: Collected raw water specification...46
Table 3-2: Operating conditions summary for Phase I - temperature effe ct... 55
Table 3-3: Operating conditions summary for Phase II - dose effect... 57
Table 4-1: Residual turbidity at various temperatures for batch #1. Values shown for temperature and initial turbidity are average ±SD ... 60
Table 4-2: Residual turbidity at various temperatures for batch #2. Values shown for temperature and initial turbidity are average ±SD ... 62
Table 4-3: TOC in treated water using alum and polymer. Raw water=36 ±4 NTU. Initial temperature3.5 ± 0 .5 ... 73
Table 4-4: TOC in treated water using PAC1 and polymer. Raw water =36 ± 4 NTU. Initial temperature=3.5± 0 .5 ... 73
LIST OF FIGURES
Figure 1-1: Raw water temperature distribution for A.H. Weeks Treatment Plant -2005 ..4
Figure 1-2: Detroit river raw water temperature variation during the year 2 0 0 5 ...4
Figure 2-1: Schematic diagram for A.H. Weeks Water Treatment Plant... 9
Figure 2-2: Particles size range (Binnie et. al, 2 0 0 2 )...10
Figure 2-3: NOM molecule showing different functional groups (Prenitsky, 20 0 3)... 12
Figure 2-4: Double layer model (Courtesy o f Zeta-meter In c .)... 15
Figure 2-5: Double layer compression (Courtesy o f Zeta-meter In c .)... 18
Figure 2-6: Charge neutralization effect (Courtesy o f Zeta-meter Inc.)... 19
Figure 2-7: Enmeshment and Bridging coagulation m echanism s...20
Figure 2-8: Addition o f alum with increasing incoming turbidity level... 28
Figure 2-9: Water physical properties change with temperature (Heinanen, 1987)... 36
Figure 2-10: Solubility o f various aluminium species (Pemitsky, 2003)... 39
Figure 2-11: Relation between mixing speed and velocity gradient at different temperatures...42
Figure 3-1: pH measurement setup...48
Figure 3-2: TOC analyzer... 49
'y Figure 3-3: Dimensional drawing for B-KER two litre ja r... 51
Figure 3-4: Jar test apparatus inside the incubator... 51
Figure 4-2: Percentage turbidity removals with temperature. Raw water turbidity=9.0 ±
1.1 NTU. Alum and polymer dosages=30 and 0.05 mg/L respectively. Values shown
are average ±SD based on triplicate treatment for each temperature... 61
Figure 4-3: Effect o f temperature on residual turbidity with alum coagulation. Raw water
turbidity=40 ±2.5 NTU. Alum and polymer dosages=30 and 0.05 mg/L respectively.
Values shown are average ±SD based on triplicate treatments (Table 4.2)...63
Figure 4-4: Comparison turbidity removals between batch #1 with low turbidity and
batch #2 with moderately high turbidity. Values shown are average based on
triplicate treatments... 64
Figure 4-5: Effect o f alum dose change on residual turbidity. Raw water=40 ± 2.5 NTU.
Polym er... 65
Figure 4-6: Percent turbidity change with different alum dosages. Raw water=40±2.5
NTU ... 65
Figure 4-7: Effect o f polymer dose change on residual turbidity. Raw water=40 ± 2.5
NTU. Alum dose fixed at 40 mg/L. Temperature =2 ± 0. 5 °C...6 6
Figure 4-8: Percent turbidity change with different polymer dosages. Raw water =40 ±2.5
NTU. Alum dose fixed at 40 mg/L. Temperature=2±0.5 °C...6 6
Figure 4-9: Dose change effect for PAC1 and alum on residual turbidity. Rim #1. Raw
water =36 ±4 NTU. Polymer dose=0.05mg/L. Temperature=3.5± 0 .5 ...6 8
Figure 4-10: Dose change effect o f refined PAC1 dose and alum dose on residual
turbidity. Run#2. Raw water=36±4 NTU. Polymer dose=0.05mg/L.
Figure 4-11: Percent turbidity removals for alum and PAC1. Run #2. Raw water =36 ±4
NTU. Polymer dose=0.05mg/L. Temperature=3. 5± 0 .5 ...70
Figure 4-12: Effect o f changing polymer dose for system 1 and 2. Run #3. Raw water
=36 ±4 NTU. Alum dose=40mg/L and PAC1 dose=10 mg/L. Temperature=3.5±0.5
... 71
Figure 4-13: Colloids removal comparison for system 1 and 2. Run #3. Values shown are
for treated water filtered tol.5pm . Alum dose=40mg/L and PAC1 dose=10 mg/L.
LIST OF ABBREVIATIONS AND SYMBOLS
Abbreviations:
APHA American Public Health Association
ASCE American Society for Civil Engineers
AWWA American Water Works Association
CF Coagulation/ Flocculation
DOC Dissolved Organic Carbon
MAC Maximum Acceptable Concentration
NOM Natural Organic Matter
NTU Nephelometric Turbidity Unit
PAC1 Polyaluminum Chloride
r.p.m Revolution per minute
SD Standard Deviation
TH M ’s Trihalomethanes
TOC Total Organic Carbon
TOX Total Organic Halides
WWTP Weeks Water Treatment Plant
Symbols:
A Pre-exponential or frequency factor
B Boltzman constant
D Dielectric constant
E Activation energy
g Gram
G M ean velocity gradient
J P Perikinetic particles rate change
J O Orthokinetic particles rate change
K (t) Reaction rate constant
L Litre
ml Millilitre
mg Milligram
N Total particle concentration
P Power
Q
Volumetric flow rateR Ideal gas constant
sec Second
S Speed o f mixing in r.p.m
t time
T Absolute temperature
V Volume o f the basin
ZP Zeta potential
pL Microlitre
jj, Dynamic viscosity
i// Electrophoretic velocity
a Particle - particle collision efficiency factor
1 INTRODUCTION
This chapter discusses the availability and importance o f fresh water, which is the source
for most drinking water treatment facilities. The role o f the coagulation / flocculation
process in producing drinkable water, and typical raw water temperature’s seasonal
variations in Windsor, Ontario are reviewed.
1.1 Background
Fresh water is one o f the most important and valuable substances on Earth, and as the
population grows day after day it is only natural that the demand for fresh water will be
increased accordingly. Out o f the 1,385,984,000 cubic kilometer o f water available on
Earth, only 2.5% is considered as fresh water and that includes lakes, rivers, ice, snow
and underground aquifers (Environment Canada, 2006). It is interesting to note that
river’s share is only 0.0002% and lakes account for 0.007 %. World wide, almost 1.0
billion people do not have access to safe drinking water. With the United Nations (UN)
Millennium Development Goals, UN member states pledged to reduce by h alf the
proportion o f people without sustainable access to safe drinking water, by 2015
(Environment Canada, 2006).
Fortunately, almost 9%, or 891163 square kilometers o f Canada's total area is covered by
fresh water. However, since water bodies can get contaminated easily through
facing big challenges. For example, a single drop o f oil in a freshwater body can render
up to 25 liters o f water that is unsafe to drink (Environment Canada, 2006). Because o f
this, the treatment process in producing drinking water is receiving increasing attention.
General contaminants for raw water include, but are not limited to, various organic and
inorganic chemicals, suspended solids, and microorganisms.
Canada Drinking W ater Guidelines list maximum allowable concentrations for different
substances/ compounds and classified them as A) Microbiological parameters such as E-
coli, total Coliform and viruses, B) Chemical and Physical parameters, specifically78
substances/compounds ranging from pure substances such as arsenic to chlorinated
compounds such as trihalomethanes, C) Radiological parameters, specifcally78 radio
emitting substances and isotopes (Health Canada, 2006). All mentioned parameters are
regulated and those regulations are revised periodically, tending towards more stringent
maximum acceptable concentrations (MAC) in produced drinking water. Any parameter
that exceeds its MAC may cause a threat to human health (Health Canada, 2006).
The coagulation/ flocculation (CF) process is one o f the most common unit processes in
any drinking water treatment facility, and is aimed at removing colloidal organic/
inorganic particles that are suspended in raw source water. These colloidal particles,
which are usually < 1 0 pm in size and are negatively charged, form a stable suspension in
water due to the repulsive forces. By increasing the size o f these particles through the
process o f charge destabilization and inter-particle bridging, the CF facilitates their
significantly impact the CF process negatively; however, the impact could be partly
minimized by selecting the most appropriate coagulant (Davis, 1983). The CF process
using alum, which is one o f the most commonly used coagulants for drinking water
treatment, has been shown to be particularly susceptible to cold temperatures (Morris and
Knocke, 1984).
1.2 Raw water temperatures in Ontario
W ater has a high heat capacity compared to other substances such as air; thereby, it can
retain cold temperatures for longer periods o f time, especially in winter when the ambient
air temperature often drops below zero. In Ontario, raw water temperature drops below
5.0 °C for several months during the year, usually between November and March.
In Ontario, the water temperature in a lake or reservoir can easily drop to 1.0 °C and, o f
course, the surface water temperature in a river must drop to 0 °C before ice covers it
(Hanson and Cleasby, 1990). Hutchinson and Foley (1974) reported that Lake Huron
water is < 3.3 °C for three months o f the year. It is surprising to see the length o f time
each year when temperate zone surface water is very cold.
According to data (Year 2005) provided by A.H Weeks Water Treatment Plant in
Windsor, Ontario, raw water temperatures at the treatment plant intake in the Detroit
River were 3.5 °C or below for the period between December and March (Figure 1-1);
also, the variation o f raw water temperature is small compared to other months (Figure 1-
2). Further information about raw water temperatures at different locations in Ontario can
180 160 140 120 w 100 Q 80
60 40 20 0
I
;
■.>■■■ t z
= - i
;.; v r z
m
.uJ
<3.5 3 . 5 - 1 0 > 1 0 Tem perature ( C )
Figure 1-1: Raw w ater tem perature distribution for A.H. W eeks Treatment Plant -2005
S catter plot of Tem perature ( C ) vs Month
2 4 6 8 ID 12
30-r
£ 20
-10
-0 2 4 6 8 ID 12
30 25 20 15 10 5 0 Month
Given the fact that W indsor is located at the south west part o f Ontario (N 42:16, W
82:57) and it has mild weather compared to the northern parts o f the province, it is
expected that most o f the raw waters sources for the drinking water treatment plants
would have a similar range o f temperatures or may be lower than Windsor for several
months in a given year.
Cold raw water temperature has a direct impact on the performance o f any treatment
plant because a number o f physical and chemical characteristics change, and
consequently operating parameters that are used in the summer time are no longer valid
(Davis, 1983). The effect o f raw water temperature had been investigated by several
researchers, yet the relationship between the level o f impact and the level o f temperature
has not been clearly established (Davis, 1983; Viraraghavan and Mathavan, 1988;
Ammary and Cleasby, 1995; Binnie et.al., 2002).
1.3 Research objectives
The main objective o f this study was to evaluate the coagulation /flocculation process
efficiency under cold temperatures at the A.W. Weeks Treatment Plant in Windsor
(WWTP), Ontario using the Detroit River water as the raw water source. The main
operating parameters that have been varied during the course o f this work were
temperature, coagulant dose, and coagulant aid dose. The specific objectives o f the study
□ To examine the effect o f temperature ranging between 1 and 22 °C on residual
turbidity with alum coagulation. Alum and polymer (Magnafloc LT-22) dosages
were fixed at 30 and 0.05 mg/L, respectively.
□ To evaluate the effect o f varying alum and polymer dosages on residual turbidity
at selected low temperatures.
□ To compare the performance o f alum and alternate coagulant (polyaluminum
blend Sumaclear-750) on residual turbidity and dissolved organic carbon (DOC)
at selected low temperatures.
1.4 Organization of thesis
This thesis is organized to include five chapters. Chapter one is used for introduction
where the need for the study has been established. Here, the role o f the coagulation and
flocculation process and the associated difficulties when raw water temperature drops has
also been presented. Seasonal variations in raw water temperature in bodies o f water,
such as lakes and rivers are discussed and a specific example for the Detroit River is
shown.
In chapter two a literature review and theoretical background for the CF process is
discussed. The topics covered are: zeta potential theory and its applications in water
treatment, the nature o f colloidal particles and natural organic matter (NOM) and why the
CF process is targeting them. The mechanisms whereby coagulant and coagulant aid
initiate the CF process are reviewed. All the parameters, both controllable and
In chapter three, all materials that have been used in the study are reviewed, experimental
set up and the equipment specifications and the required modification are mentioned.
Various phases o f the study and operating conditions for each phase are listed. Finally,
type o f measurements and the analytical methods followed are detailed.
In chapter four, all results have been presented. Analysis and discussion o f those results
are reported. Finally, chapter five provides a summary o f research outcomes for the
different phases, lessons learned during the course o f the work, conclusions and
2
REVIEW OF LITERATURE
This chapter reviews the theoretical background o f the Flocculation /Coagulation (CF)
and details the factors that significantly impact the process.
2.1 Overview on coagulation / flocculation process
Drinking water treatment process usually consists o f more than one stage; it typically
includes CF, particle settling, filtration, and disinfection. Other processes involving
chemical treatment are also not uncommon. Disinfection is the last stage before treated
water is sent into the distribution network. Figure 2-1 shows a schematic diagram for the
A.H Weeks W ater Treatment Plant in Windsor (WWTP), Ontario.
High efficiency o f the CF process is vital because it could decide the fate o f
suspended/colloidal/ dissolved organic particles that are embedded in raw water; these
particles along with the microorganisms are the main targets in most drinking water
treatment processes. Coagulation is the process by which a chemical is added to
destabilize suspended particles and to react with dissolved organic materials. Flocculation
allows particles to collide and aggregate, significantly increasing filtration performance.
Additionally, coagulation/flocculation efficiency also controls disinfection by- product
L y
-H
!d
H
a
H
4
M
py.
ui cc
□I—EK*\
Figure 2-1: Schematic diagram for A.H. W eeks W ater Treatment Plant
M
tf
W
W
iK
A
H
E
IH
tf
k
iP
lf
ii
C
E
2.1.1 Colloidal particles and natural organic matter (NOM)
Natural water usually contains a variety o f impurities, and a wide range o f particles.
Solids may refer to the inorganic materials in raw water and may have three forms:
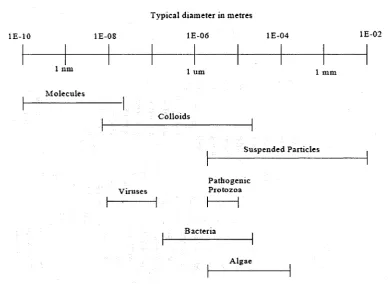
A) Suspended solids, such as clay, silt, sand and vegetable matter (Binnie et al, 2002), and
in some other definitions iron oxide, silicates, calcites, aluminum oxide and other
minerals are included (Wiesner and Klute, 1997). Suspended particles may range from
big particles that are removed by screens and strainers down to 1 0pm.
B) Colloids are very fine particles, typically ranging from 10 nm to 10pm. Colloids
present a real challenge since their settling velocities are intolerably slow and they could
easily escape filtration (Ravina, 1993).
Typical diam eter in metres
I E - 10 IE-08 IE-06 IE-04 IE-02
1 nal i nm 1 mm
Molecules
Colloids __________ |
. Suspended Particles .
Pathogenic Protozoa
I 1
Bacteria________ |
Algae
Figure 2-2: Particles size range (Binnie et. al, 2002)
C) Dissolved molecules are present as individual molecules or as ions. Figure 2-2 shows
the size range for different particles. The type and size o f particles in each watershed are
usually different and may be unique; however, most raw waters show similar
electrochemical behavior. Their surfaces are covered with hydroxyl (OH‘) groups and
under the pH levels o f most natural waters these particles have a negative surface charge
typically in the range o f 0.1 to 1.0 peq/mg (Pemitsky, 2003).
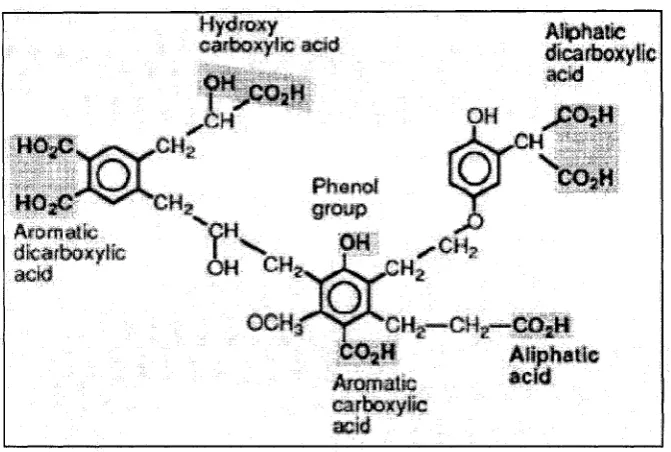
Natural organic matter (NOM) can be found in almost every source o f natural waters; the
main sources are soil, higher plant life, algae, forest litter and other living organisms
(Malley et al., 1988). The largest component o f NOM is aquatic humic matter, and it
comprises almost 60% o f the dissolved organic matter in fresh waters (Thurman, 1985).
The exact physical and chemical nature o f NOM is highly variable and site specific;
usually they are colored and polyelectrolytic in nature. Humic matters or substances can
be divided into two divisions, those are humic and fulvic acids (Thurman, 1985).
NOM molecules are large and contain many functional groups as shown in Figure 2-3.
Those groups can affect their chemical behavior. W hat makes the behavior even more
complex is that the charge on those different groups can also change with pH (Croue et.
mM AJptiatie
iteiwijfle
actdPtm w l
group
OH >20 3H
"COjM
Afftriitfc ■
acW
o i®
^ m s
%
^.'Ui
COj|H ||||i|iilii
Arom atic •* * *
* sil
-m ...,- ;| .—c n - n
Figure 2-3: NOM molecule showing different functional groups (Prenitsky, 2003)
In many treatment plants, the coagulant doses are determined by the NOM concentrations
rather than by turbidity alone. The charge density o f NOM species is typically 10-100
times greater than the charge density o f inorganic particles, which are mostly responsible
in creating turbidity. W ater with 10 mg/L o f clay-based turbidity having a negative
charge o f 0.5 peq/ mg should require 5.0peq/L o f positive charge, while 3.0 mg/L o f
DOC with a negative charge o f 10 peq/ mg requires a positive charge o f 30 peq/L for
neutralization, which shows six times more charge demand than the needed for clay
(Edzwald and Van Benschoten, 1990).
2.1.2 Interaction between NOM and inorganic matter
The presence o f NOM in water can cause coloring o f water, interfere with treatment
also may cause adsorption and transport o f toxic metals into the distribution system (Saar
and Weber, 1982).
It is believed that NOM can react with inorganic clay colloids in a number o f ways (Van
Olphen, 1963). The main reaction is to act as a stabilizing agent for the clay suspension,
thus hindering the destabilization process. Also, sometimes NOM might be absorbed on
the negative surfaces o f clay and result in destabilization and precipitation, or penetrating
between clay layers and replacing the inter-water layer (Green, 1951).
The reaction that causes the formation o f trihalomethanes (THMs) is considered to be
very important because these products are believed to be carcinogens. The formation o f
chlorinated organics in water treatment occurs from the reaction o f free chlorine with
acidic carbons and carbon containing methylene groups o f humic matter under basic
conditions (Morris and Baum, 1978) as shown in the simple reaction below:
NOM + Cl 2 Total Organic Halides (TOX) 2-1
TOX = THM ’s + other organic halides 2-2
THMs can be chloroform (CHCI3), bromodichloromethane (CHBrC^),
dibromochloromethane (CHBr2 Cl) and bromoform (CHBr3) (APHA, 1998). The
formation o f those products will depend on several factors such as the concentration o f
organic matter and chlorine, the pH, temperature and reaction time. Due to the fact that
NOM is a precursor in the formation o f those toxic substances, it is best to remove NOM
Canada has set a 0.1 mg/L limit for the total o f all THMs in drinking water (Health
Canada, 2003).
2.1.3 Zeta potential
The previous section stated that colloids and most NOM particles hold a negative charge
on their surfaces. Those particles have small diameters, and thereby have a high surface
area to volume ratio. The effect o f repulsion forces due to similar charge, distributed on
the surface, keeps these small particles apart from each other; hence, they develop a
stabilized status in the water column (Malley et.al, 1988).
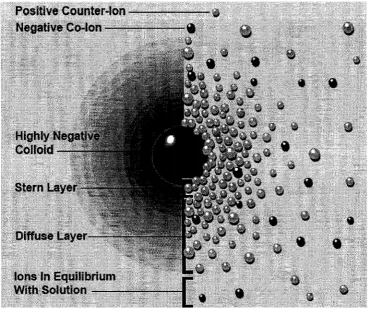
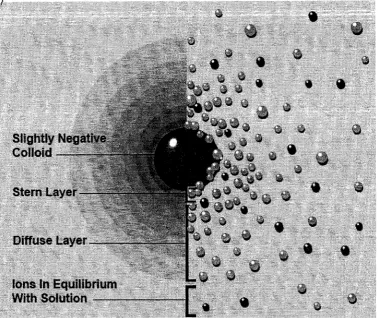
The double layer model is often used to describe ionic atmosphere in the vicinity o f
charged colloids (Steel and Terence, 1981). Since the core o f most the colloids
encountered in raw waters is negatively charged, positive ions are attracted and attached
to form a positive layer called a stem layer. A mixed layer o f both positive and negative
ions is formed due to repulsion forces between those counter ions and is called the
diffused layer (Steel and Terence, 1981). As a result, an electrical potential is created and
this has greater magnitude near the surface o f the colloid and it gradually decreases with
distance from the colloid surface towards the bulk water. Figure 2-4 illustrates the double
layer model. The potential at the junction o f the stem and diffuse layers is known as the
Zeta Potential ( Z P), in fresh waters. And since the double layer is extended, ZP is a
P o sitiv e C ounter-Ion
N eg a tiv e C o -io n
---Highly N eg a tiv e : :‘i
C olloid "
S tern Layer
D iffu se Layer
Ions In Equilibrium With S o lu tio n
Figure 2-4: Double layer model (Courtesy o f Zeta-meter Inc.)
Often ZP is used as a measure for colloid particles stability. When ZP is high, the
stability o f colloids is also high and vise versa. The mathematical expression for ZP
(Reynolds and Richards, 1996):
Z P
D
Z P: Zeta potential (millivolt) f i: Dynamic viscosity (N-s/ m2)
: Electrophoretic velocity (m Is) D: Dielectric constant
Dynamic viscosity and dielectric constant for water are both temperature dependant,
There are two opposing forces working on the particles; an electrostatic repulsion force
and an attraction force known as Vander Waals (Ravina, 1993). Electrostatic repulsion,
originating from different ion charges in the diffused layer, becomes significant when
two particles approach each other and their electrical double layer begins to overlap.
Energy is required to overcome this repulsion. On the other hand, the Vander Waals
attraction force is the result o f forces between molecules. This force effect is additive; a
molecule in one colloid has a Vander Waals attraction force to each molecule in another
colloid. This is exists in each molecule in the first colloid, and the resultant force is the
sum o f all o f these. DLVO theory (developed by the scientists Derjaguin, Landau,
Verwery, and Overbeek) is the explanation o f how particles interact; basically, it looks at
the balance between these two opposing forces. The net effect resulting from them
creates a virtual energy barrier. In order to have an effective flocculation, colliding
particles must have sufficient kinetic energy to overcome this barrier, then agglomeration
will occur (Ravina, 1993).
2.1.4
Coagulation mechanisms
Coagulation refers to the destabilizing process o f colloidal particles in raw water. This
brings the ZP to a minimum value near zero. The electrical potential is reduced and the
energy barrier is minimized. Essentially, the coagulation process is comprised o f two
steps, first is the addition o f a certain amount o f chemical (coagulant) at certain point, and
the second step is to disperse this chemical quickly in the bulk water. This is done usually
Many studies have described this process and how different parameters can affect
coagulation efficiency (Hanson and Cleasby, 1990; Sajjad, 1995). Mixing intensity
(speed o f mixer), mixing time, mixer geometry and chemical addition sequence are some
examples o f these parameters studied. Coagulation is often termed as rapid mixing and
usually has a short detention time in the rapid mixing tank. Destabilization can have
several mechanisms and each coagulant can perform by more than one mechanism. Four
well known mechanisms are (O’Melia, 1972):
• Double layer compression
• Adsorption / Charge neutralization
• Enmeshment (Sweep floe)
• Interparticle bridging
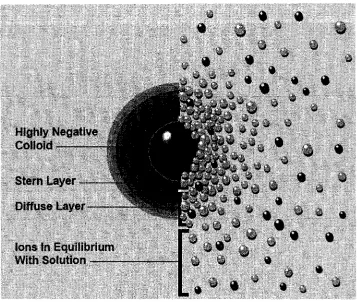
Double layer compression can be achieved by increasing the ionic concentration. That is
why in saline water the thickness o f double layer is small compared to fresh waters
(Ravina, 1993). This technique is mentioned as a coagulation mechanism; however, it is
impractical to use it in drinking water treatment, because o f the large amounts o f salts and
needed to achieve this goal. Application o f such technique can be found in the
Highly N egative C olloid
Stern Layer
D iffuse Layer
io n s In Equilibrium With Solution
Figure 2-5: Double layer compression (Courtesy o f Zeta-meter Inc.)
Charge neutralization occurs when coagulants added to raw water hydrolyze and
dissociate and provide positive ions that are dispersed in the bulk water and adsorb onto
colloid surfaces (Bagwell et.al, 2001). Due to this neutralization, charge density
surrounding the colloids decreases followed by reduction in electrical potential, opening
the chance for more collision between adjacent colloids to take place (Bagwell et.al,
2001). Figure 2-6 shows the charge neutralization effect. Aluminum and ferric salts are
commonly used coagulants. Alum, which refers to the chemical A l 2 (S ()4) 3.X H 20 , is an
example o f those salts which dissociate in water and form a variety o f positive ions (Steel
S lig h tly N e g a tiv e
S tern L ayer
D iffu se L ayer
Io n s In E quilibrium With S o l u t i o n
---Figure 2-6: Charge neutralization effect (Courtesy o f Zeta-meter Inc.)
Lowering charge density by utilizing the charge neutralization technique is one o f the
most important techniques used in drinking water treatment (Ravina, 1993). Charge
neutralization can not only be achieved by using inorganic metal coagulants but also
when using cationic polymers. These polymers usually have big molecules and high
molecular mass, with positive sites along their surface attracting negatively charged
particles which induces neutralization.
Enmeshment or colloids entrapment effectively occurs when chemical reactions produce
concentrations o f coagulant dose and high pH. The region for those conditions is called
the “sweep floe” region (Hanson and Cleasby, 1990). The precipitated compounds collide
and aggregate as they start settling, resulting in water clarification.
primary coagulants (Steel and Terence, 1981). The effect o f colloidal attachment to the
polymer molecule could be related to coulomb attraction if the charges are opposite, and
to ion exchange, hydrogen bonding and Vander Waals forces in other cases (Bagwell et.
al., 2001). Bridging can also be achieved by threads and fibers from large polymer
molecules assisting in capturing small sized newly created micro floes. The net effect is a
macro size floe that resembles a chain. Figure 2-7 is a schematic representation for
enmeshment and bridging.
Interparticle bridging is mostly related to polymers used either as coagulant aids or as
2.1.5 Flocculation and particle transport in water
Flocculation refers to the successive collision between stabilized colloids and micro floes.
The result o f this process promotes particle growth to the size o f a macro floe. Floes are
easily removed either through settling or filtration. The size o f macro floes can be
different from one plant to another depending on the operating conditions and incoming
water characteristics (Prenitsky, 2001). One study showed agglomerated macro floes
ranging from 10 - 300 pm with the bulk being around 50 -100 pm (Geng, 2005).
Particle transport during the flocculation process might have different mechanisms
including (O ’Melia, 1972):
• Thermal Brownian motion
• Bulk fluid movement induced by mixing
• Differential settling, where fast settling particles collide with slow ones
Collisions induced by thermal motion are often termed as perikinetic flocculation, while
those which are induced by the bulk fluid movement are termed orthokinetic flocculation,
which results in inter-particle contacts (Binnie et. al., 2002).It is important to understand
these mechanisms which may identify the dominant mechanism in the process, which in
turn may relate to the particle size as shown in the following equations:
r d N - 4 j'Oc* B * T * N
2 ’4
d t 3 (i
Jo ~ ~ ~ = * a * G * d 3 * N 2-5
d t 3
a : Particle - particle collision efficiency factor B : Boltzman constant
T : Absolute temperature d : Colloidal particle diameter G : Mean velocity gradient jU : Kinematics viscosity
The ratio o f the two equations will show the importance o f particle size.
J 0 _ j u * G * d 3
J p ~ 2B * T
If we assume the following conditions: water temperature 25 °C, particle size 1 .Opm and
mean velocity gradient o f 1 0 sec' 1 (a typical value in flocculation), then the ratio o f rates
is equal to 1.0. Accordingly, particles with a diameter less than 1.0 pm exhibit
predominantly perikinetic flocculation, thus temperature will influence flocculation o f
particles with this size or smaller. Particles with diameters more than one micron would
exhibit predominantly orthokinetic flocculation (Han and Lawler, 1992).
2.2 Coagulants and their reactions
Understanding the aqueous chemistry after adding coagulants to raw water is considered
a key factor in evaluating the performance o f coagulants. Metal salts, such as aluminum
sulfates and chlorides, ferric sulfates and chlorides are traditional coagulants. When
adding these salts into the system, they are dissolute and are injected in a liquid form. A
majority o f treatment plants use aluminum sulfate due to its availability, low cost, and
fair performance in terms o f turbidity removal. Recently, polymeric aluminum is believed
2.2.1
Aluminum sulfate (Alum)
Reactions o f alum when added to water are too complex to describe fully; however, the
main reactions taking place can be summarized as:
1) Dissolution
A l 2( S 0 4) 3---> 2 A l ( H 20 ) f + 3 S O ? 2 _ 7
2) Hydrolysis
In this process, H2O is replaced in the hydration shell with OH ~ ions. Sometimes the H2O
molecule with the aluminum compound can be seen and sometimes it is hidden (Steel and
Terence, 1981). Reactions may be written in the following manner (Steel and Terence,
1981):
A l ( H 20 ) f + H 20 ---> A l ( H 20 ) 5 O H +1 + H + 2-8
2 A l ( H 20 ) 50 H +2 + H 20 --->AI(H20 )a( O H Y \+ H + 2-9
Other authors represented A l ( H 20 ) f as A l +3 for simplification purposes and re-wrote
hydrolysis reactions as follows (Cotton and Wilkinson, 1980; O ’Melia and Dempsey,
1982):
A l +3+ H 20 >AlOH+1+ H + 2-10
A r + 2 H 20 --->Al(OH)+2 + 2 H + 2-11
A l +3+ 3 H 20 --->Al(OH)3 + 3 H + 2-12
A l +3+ A H 20 ---> A l( O H ) - + A H + 2-13
3) Polymerization
Products o f the hydrolysis step combine to form a variety o f polymerized species such as:
The compound All30 A{ 0 H ) 2A is abbreviated as Al(3 (Prenitsky, 2003). Alum chemistry
is often described by the presence o f A l £ ,A 1 0 H +1 and Al(OH)~4 species which are in
equilibrium with amorphous A l(O H )3 solid phase (Van Benschoten and Edzwald, 1990);
however, there are many reactions producing different positively charged hydroxy-
alumina complexes.
Existence o f those alum compounds depends on two factors, concentration and pH value
at the time o f the dissociation. Alum can work in two different ways; at low turbidity raw
waters, high concentrations might be added leading to the formation o f A l(O H) 3. This
compound precipitates, thus working in the sweep floe region and trapping colloids as it
settles. In high turbidity raw waters, alum positive compounds would be adsorbed on the
negatively charged colloids, and destabilization occurs through a charge neutralization
mechanism. Overlap between those mechanisms depends on the characteristics o f raw
water and operating conditions. It is widely believed that alum does not deliver adequate
results under cold temperature (Knock et.al, 1986) compared to other coagulants such as
ferric chloride and ferric sulfate and poly aluminum chloride and poly aluminum sulfate.
Alum could be the coagulant o f choice during the summer (Davis, 1983); while in winter,
other alternatives could be used.
2.2.2 Polymers (coagulant aids)
Polymers are increasingly being used due to their ability to enhance and improve water
type do not hold any charges. By using polymer as a coagulant aid, the residual turbidity
in the final effluent is reduced. Use o f polymers also reduces sludge production (Ammary
and Cleasby, 1995). Polymers are characterized by three features: A) molecular weight,
B) structure, and C) charge density. Molecular weights have a wide range and can vary
from 50,000 - 1,000,000 g/mol (Ravina, 1993). Generally, the higher the molecular mass,
the higher the efficiency in performing the bridging mechanism (Ravina, 1993).
Monomers are attached in different ways to form a certain polymer structure; thereby,
two polymers with the same molecular weight could have a different structure and
performance (Ravina, 1993). Also, some monomers are charged and others are not; a net
charge density is created for a certain polymer (Ravina, 1993).
2.2.3 Poly aluminum chloride (PACl)
Polymers are being used extensively since they have been shown to perform well in cold
temperatures (Matsui et.al, 1998; O ’Melia, 1985). Many countries in Europe and Japan
are switching to use PACl coagulation instead o f the traditional alum. PACl is produced
by adding a controlled amount o f a base such as sodium hydroxide to aluminum solutions
in the presence o f chloride or nitrate ions. Usually an OH / Al ratio between 2.4 - 2.7 is
used (O’Melia and Dempsey, 1982). This ratio can characterize the degree o f
neutralization (r) and determine the basicity o f the PACl, (Pemitsky, 2003) where:
r = [OH'] / [Al T] 2-15
Here the hydroxyl ion [OH'] represents the quantity o f the base added during the
production. The value o f ( r ) can range from 0 to 3 corresponding to basicity o f 0 - 100%.
Manufacturers produce commercial PACl with the basicity in the range 15-85%; the
higher the basicity, the lower fraction o f A ln OA(O H )2A is present. Basicity value
determines alkalinity consumption as well as the amount o f polymeric species present
(Pemitsky, 2003). As in any chemical reaction, the end product or the final form o f the
PACl depends on the concentration o f aluminum chloride that is used, type and
concentration o f the base added, solution pH, mixing intensity and finally the time
(Pemitsky, 2003).
The predominant species in the commercially produced PACl are primarily Alu OA(O H )2l
then A l ( H 20 ) f and colloidal A l(O H )3 (Buffle et. al, 1985, Van Beschoten and
Edzwald, 1990). Depending on the species that are dominating the product, PACl can
perform destabilization through one o f the known mechanisms. For example, if
AIuOa(O H) 24 dominates, then destabilization is through charge neutralization, while if
A l(O H )3 dominates, then sweep floe complex precipitation will take place.
Bridging can also be performed if the molecular weight o f the produced PACl is high.
Manufacturers are producing many types o f PACl compounds nowadays, some o f them
are blends containing PACl, polyamines and other compounds at the same time. These
products can be used for different water characteristics; however, no clear molecular
2.3 Parameters affecting coagulation/ flocculation process
Coagulation and Flocculation can be affected by many factors including interacting
constituents, surrounding environment, kinetics o f aluminum hydrolysis and precipitation
(Bagwell et.al, 2001). Matsui et.al (1998) reported a required destabilization time o f 10' 5
to 10' 3 second for hydroxyl-aluminum complexes. This figure may give some indication
o f how fast hydrolysis reaction occurs, and accordingly how they might be influenced
instantaneously by the operating conditions.
2.3.1 Controllable parameters
These parameters are under the control o f the treatment facility operators and thus can be
manipulated to overcome any changes in raw water characteristics.
A) Coagulant dose:
Regardless o f the type o f the main coagulant, dose can be increased or decreased
according to the incoming turbidity type and level. The general trend is increasing dose
with higher turbidities and low temperatures (Budd et.al, 1997). If an excess dose o f
alum is applied, then very slight or no improvement to turbidity removal may be
observed (Morris and Knock, 1984). In addition, higher amount o f coagulants produces
the adverse effect by generating extra sludge that needs to be treated later (Ammary and
Cleasby, 1995). Figure 2-8 is a scatter plot for incoming turbidity vs. alum dose for the
90.0 S ' 80.0 5 - 70.0 £ 60.0
I
50.0a
4o.o
30.0
1
200|
10.00.0
0.0 2 0 .0 4 0 .0 60.0 80.0 Alum dose ( mg /I)
Figure 2-8: Addition o f alum with increasing incoming turbidity level. Source: W W TP. Data for Novem ber 2005
B) Coagulant aid dose
Coagulant aids are used to enhance and improve the CF process. Their main function is to
establish the bridging mechanism, and therefore, it is more aiding flocculation rather than
the coagulation stage. Coagulant aids are added in small concentration; however, their
effect on the final turbidity levels is considerable. Additionally, they can lead to the
reduction o f concentration for the main coagulant. Coagulant aid role could be considered
as complementary to the main coagulant (Ammary and Cleasby, 1995).
Several types o f coagulant aids are used, such as activated silica. It consists o f a
preparation o f colloidal sodium silicate which can act as coagulant by itself or as a
coagulant aid when used with alum by establishing bridges (Steel and Terence, 1981).
silica may expand the pH range for effective coagulation, produce larger and tougher
floes, and increase color removal (Steel and Terence, 1981).
Polyelectrolytes (polymers) now are widely used as coagulants aid because o f their large
molecule size. The bridging mechanism is effective, producing a floe size up to 100 times
greater than those produced by using metallic coagulants alone (Steel and Terence, 1981).
The optimum combinations and/or ratios for coagulant to coagulant aid are not always
known. This varies according to the nature o f the chemicals and raw water
characteristics, as well as their interactions.
C) Coagulation (rapid) mixing intensity & G-value
The importance o f the rapid mixing intensity and its effect on the coagulation /
flocculation process is often overshadowed by chemical overdosing in treatment plants
(Sajjad, 1995). This parameter can play a major role in the CF process due to the ability
o f the operators to change mixing speed and time, consequently the energy that is
imparted to the water changes. Rapid mixing provides the required kinetic energy to
particles to overcome the energy barrier and allow the collision between colloids.
Hudson (1981) suggested various mixing times during rapid mixing. The suggested
values ranged from 0.5- 5.0 minutes. During rapid mixing, not only dispersion o f the
coagulant in the raw water is carried out, but also it brings about the initial stage o f
particle collisions and subsequent aggregation. These aggregates act as the nuclei for
optimum rapid mixing intensity (Ammary and Cleasby, 1981). A relation is developed
between the velocity gradient (G-value) and speed o f mixing as shown:
G = a S b 2-17
Where G is the velocity gradient s e c '1; S is the speed o f mixing in (r.p.m); (a) and (b) are
constants and they are temperature dependent, and for a specific impeller geometry.
Above equation is for two blade turbine impeller at 23 °C (Sajjad, 1995).
It has been reported (Ghosh et.al, 1985) that G-values between 300 and 1000 se c_1 proved
to be optimum for cationic polymers, while Me Bride et al. recommended 1000 se c' 1 to
be used with a combination o f alum and cationic polymer.
D) Flocculation (slow) mixing intensity and mixing regime
Flocculation often refers to the successive collisions o f destabilized colloids and/or
microflocs required to promote particle growth. During this stage, sweep floe and
bridging mechanisms take place; therefore, the mixing speed is different from that for
coagulation. G- values between 10 -60 sec' 1 for conventional flocculation are typically
used in this stage (ASCE & AWWA, 1998).
Because o f multiple basins in the flocculation stage, and subsequent different mixing
patterns, tapered mixing speeds are implemented. This entails gradual decrease in the
mixing speed, which allows the microflocs to develop into macro-flocs, development o f
bridging between the macro-flocs, and maintenance o f the floes at the biggest possible
E) Mixer type
Mixing in the CF process can be varied by either changing mixer type or the mixing
pattern in time and intensity. Researchers found that different impeller geometry can
make the flocculation process more efficient with respect to power input, while others
(Sajjad, 1995; Hanson and Cleasby, 1990) found that there is a significant impact on
flocculation kinetics, which may be explained by the relationship between the impeller
shape and G-value imparted to water.
F) Residence time
Residence or detention time is defined as:
V
t = — 2-18
0
Where V is the volume o f the basin, and Q is the volumetric flow rate going into that
basin. W hen the treatment facility encounters problems, and since the physical geometry
can not be changed for the existing basins, increasing residence time can only be made by
decreasing hydraulic loadings for the plant. Production capacity will be affected, but
sometimes it is necessary to take such a measure in order to meet required specifications
for effluent water and comply with regulations.
2.3.2 Uncontrollable parameters
Parameters not under the control o f the treatment plant operators may refer mainly to the
characteristics o f the incoming raw water (sometimes referred to as the nature o f raw
results when applied to various treatment facilities. The main features that are common to
all types o f raw water are:
1) Alkalinity and pH
Alkalinity by definition is the measurement o f water buffering capacity to neutralize any
acidic solution added to water. Alkalinity may refer to the presence o f bicarbonate
(HCO3'1), carbonate (CO3'2) and also hydroxide in natural waters and it is measured as
CaC0 3. Alkalinity is essential to make the reaction with alum occur and let the
coagulation mechanisms proceed. During the process alkalinity is consumed by added
coagulants (Tseng et.al, 2000).
Since most coagulants and coagulant aids are acidic in nature, alkalinity is consumed and
pH value decreases for two reasons, bicarbonate consumption and carbonic acid
formation as shown in the reaction below (Ravina, 1993).
A l2 ( S 0 4) 3 + 3Ca(HCO3) 2 + 6H 20 --->3 CaSO, + 2 A l(O H )3 +6H 2C 0 3 2-19
Natural waters have different alkalinities; thereby the effectiveness o f the chemical
reaction which takes place can vary accordingly. The pH o f natural raw waters also
changes from one place to another. Normally it varies from 6 - 8.5, and it is related to
alkalinity as well. The pH plays a vital role in the reaction kinetics; most o f the treatment
facilities using alum are adjusting raw water pH by either adding acidic solutions or CO2
gas. Lower pH values, between 5.5- 7.5 (ASCE &AWWA, 1998), can be used to keep
Higher pH values would give a chance for Al(OH) 3 to form and precipitate. From the
above discussion it can be seen that the pH values can dictate the coagulation mechanism.
Generally, it is not permitted to have final pH value o f the treated water well below 7.0 in
order to avoid problems caused by acidity in the distribution network.
2) Turbidity
Turbidity is the measure o f relative clarity o f water caused by suspended and colloidal
matter, such as clay, silt, and finely divided organic and inorganic matter. Also, it can
include biological organisms such as algae, cyanobacteria, zooplankton, and filamentous
or macro bacterial growths. Guidelines have been set by Health Canada to reduce
turbidity in treatment facilities as low as possible, depending on the treatment type and
technology used as follows (Health Canada, 2006):
• For chemically-assisted filtration, shall be less than or equal to 0.3 NTU in at least
95% o f the measurements made, and shall not exceed 1.0 NTU at any time.
• For slow sand or diatomaceous earth filtration, shall be less than or equal to 1.0 NTU
in at least 95% o f the measurements, and shall not exceed 3.0 NTU at any time.
• For membrane filtration, shall be less than or equal to 0.1 NTU in at least 99% o f the
measurements made, and shall not exceed 0.3 NTU at any time (Health Canada,
2006).
Turbidity is not a direct measure o f suspended particle concentration in water but it is
several factors affect the intensity o f light scattering, such as size, distribution, shape,
refractive index and adsorptive capacity o f the particle, it might not give a precise
measurement every time.
Turbidity measurements are very widely used as a good indicator o f water quality.
Species causing turbidity might have different implications for raw water quality;
inorganic particles such as silt, clay, and natural precipitants, e.g., CaCC>3, M n0 2, Fe2 0 3,
might raise or lower pH and alkalinity, be sources o f micronutrients and affect zeta
potential (Health Canada, 2006). While organic particles such as decomposed plant and
animal debris and humic substances, might be sources and supply energy for micro
organisms, impart taste and odor, serve as precursors for the formation o f chlorinated or
ozonated compounds, might form complexes with toxic elements, affect pH and finally
might shield colloids (Health Canada, 2006). The presence o f organic materials may
result in high disinfectant demand, high coagulant dose and reduced filter run time.
Finally, biological species such as algae and zooplankton may impart taste and odor, be a
disease carrier, and corrode tanks and pipes. The presence o f biological species may have
some implications on the treatment process and can block filters.
3) Particle size distribution and charge density
Properties o f particles, such as size, shape, density, porosity, charge density may
influence their interactions with the added chemicals. Among those, size might be
Particle removal efficiency can be monitored by using several measurement techniques
such as turbidity, conductivity and particle counting. Today, instruments can analyze
particles in the nanometer range which gives a more thorough indication o f the particle
distribution and its nature. This can assist treatment facilities in selecting the appropriate
coagulant(s).
4) Temperature
Raw water in rivers and lakes experiences drastic changes in temperature during the
year. This can have a direct impact on several water properties. A classification o f
temperature ranges was made in the following manner (Womba et.al, 2001):
- Temperature < 4°C [Cold water]
- 4 °C > Temperature < 14 °C [Cool water]
- Temperature > 15°C [Warm water]
In the range between 0 and 22 °C, where m ost o f the treatment facilities in Ontario work,
water density varies between 0.999 and 0.0997 g/mL, which is a change o f only 0.2%.
Over this range, the dielectric constant changes from 88.026 to 79.463, and this reflects a
change o f 10%. The physical property which significantly changes with the change in
temperature is water viscosity. In the above temperature range, dynamic viscosity will
change from 1.7921 to 0.9608 cP (Chapra, 1997), which is a change o f 46%. Figure 2-9
shows the effect o f temperature on water physical properties. Changing viscosity by such
a high percentage will have an impact on zeta potential, required energy for mixing the
bulk o f water, and particle settling velocity. The CF process efficiency will be impaired,
0.5
-50
100
1500
Temperature (°C)
1.02
1.00
g 0.98
0.94
-Q
0.92
-0.90
-20
0
20 40 60 80 100 120Temperature (°C)
80
-1
75 ' « 70-1
65 ' 5 60 Q 5,5-0 50 100 150
Temperature (°C)
2.4 Temperature effect on different parameters
The temperature effect has been studied by several researchers (Mohtadi and Rao, 1973;
Morris and Knock, 1984; Hanson and Cleasby, 1990; Ammary and Cleasby, 1995; Kang
and Cleasby, 1995; Sajjad, 1995; W obma et.al, 2001; Pemitsky, 2003) and each o f them
added more understanding to the CF process phenomena under cold temperatures. Most
o f them used synthetic water and chose two temperatures, one high, and the other low to
study the effect on kinetics, solubility, fluid dynamics, settling rate, mixing regime and
filtration time.
2.4.1 Effect on solubility
Generally, solubility such as solid- liquid, liquid-liquid and gas-liquid are affected and
they decrease with lowering o f temperatures (Bagwell et.al, 2001). The CF process and
the solubility o f the coagulant follow this general rule. Coagulant solubility (dissociation)
is the first step in a series o f chemical reactions and reducing it may affect the whole
process efficiency. At the time o f adding the coagulant, pH for the bulk solution plays a
vital role in solubility and can direct solubility products either to have the positive
hydroxy - aluminum ions which neutralize charge, or aluminum hydroxide precipitates
which are active in the sweep floe (enmeshment) mechanism. Solubility graphs often
illustrate different aluminum species against pH (Hanson and Cleasby, 1990; O ’Melia
and Dempsey, 1982; Pernitsky, 2003).The following equations show how the relations
Table 2-1: Aluminium ions solubility constant (Pernitsky and Edzwald, 2003)
Chemical reaction Equilibrium expression
pK
(20 °C)
pK
(5 °C)
A1 +3+H20 = Al(OH)+2+H+ K n=[Al(OH)+2][H+]/ [Al+3] 5.12 5.65
A l+3+2H20 = Al(OH)2++2H+ K12=[A 1(0H )2+][H+]2/ [Al+3] 10.45 11.56
A1 +3+4H20 = Al(OH)4'+4H' K i4=[A l(O H )4’][H+]4/ [Al+3] 23.57 25.33
A1(OH)3(s)= A1+j+ 3 OH’ Ksp = [Al+3] [ OH’] 3 31.67 32.4
A l( O H )3{S) >AI+3 + 3 OH~l 2-20
K SP = \ A l +3][OH~1f 2-21
log K SP = log[ ^ / +3 ] + 3 log [OH-1 ] 2-22
log[ ^ / +3 ] + 3( p H - 1 4 ) = -3 1 .6 2-23
\og[Al3] = 1 0 . 3 3 - 3 p H 2-24
A l +i + 4 H 20 - — > A l (O H) ; 1 + 4 H +1 2-25
K u = [Al (O H)- ‘ ] [ H +1] +4 /[.Al+3 ] 2-26
log £ 14 = l o g [ ^ / ( 0 / / ) - 1] + 4 1 o g [//+1] - l o g [ ^ / +3] = -23.57 2-27
Substituting equation 2-24 into 2-27
lo g [^ /(0 /7 )-1] = j9 /7 -13.91 2-28
J / +3 + H 20 ---» Al (O H )+2 + H +x 2-29
K n = [Al(OH)+2}[H+xV [ A r 2] 2-30
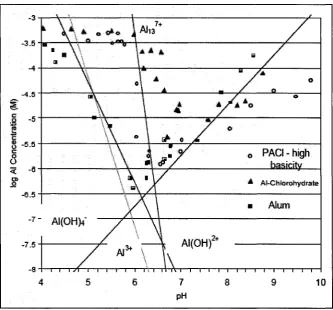
Figure 2-10 shows the concentration as a function o f pH, and trend lines are plotted based
on the above equations. PAC1 is more soluble than alum, when basicity is increased the
pH for minimum solubility increases for different types o f PAC1. Since PAC1 can work in
a higher pH range, acidification o f raw water could be avoided. Testing o f alum and
PAC1 at two different temperatures (20 and 5 °C) showed that solubility is reduced
considerably for both compounds. Alum solubility drops from 16 to only 3pg/L, while
for PAC1 at high basicity, the solubility drops from 52 to 5 pg/L (Pemitsky, 2003).
-3.5
1* A 4
-4.5
; -5.5
-8.5
Alum
-7.5 -a
Figure 2-10: Solubility o f various aluminium species (Pernitsky, 2003)
2.4.2 Effect on reaction rate
rate is reduced to half o f its original value (Chapra, 1997). This is illustrated by the taking
the ratio for Arrhenius equation at two different temperatures, as follows:
K (r) : Reaction rate constant
A : Pre-exponential or frequency factor (mole / sec) E : Activation energy (J /mole)
R : Ideal gas constant (8.134 J/mole. K) T : Absolute temperature (K)
reaction taking place (Chapra, 1997). Researchers tend to believe that reaction rate is the
dominating factor (Kang and Cleasby, 1995). Mixing patterns and intensities have been
well studied; nevertheless they are not as important as reaction kinetics. W hen reactant
molecules in a slow reaction are uniformly distributed throughout the system, the speed
o f reaction (reaction rate) would not change radically because the rate is controlled by the
thermodynamic conditions (Sajjad, 1995).
The result o f the CF reactions is the formation o f floes with different size and strength.
Studies on floe strength showed that internal binding forces for macro floes are affected
— E
K m = A * e RT or ln K fn = In A —
) i1) R * T 2-32
mi=e
2-33m )
E
0 = e RTlT' 2-34 ^ ( ^ 2) _ q {T2 - Tx)
2-35 K { T X)