ABSTRACT
MESSER, TIFFANY LAROSE. Groundwater Nitrate Reductions within Upstream and Downstream Sections of a Riparian Buffer. (Under the direction of Dr. Michael R. Burchell, II).
Riparian buffer systems have gained much interest over the past 25 years for their ability to reduce groundwater nitrate (NO3--N) through the process of denitrification, a
process which transforms NO3--N into harmless nitrogen gas. Buffer ability to reduce NO3--N
has been found to be variable and does not always work as effectively as desired to meet water quality goals. Therefore research is still needed to identify the causes for variability within these systems to maximize their benefit in conservation programs, such as the North Carolina Conservation Reserve Enhancement Program (NC CREP).
Over the past five years a detailed evaluation of the hydrology and attenuation of groundwater NO3--N was conducted on two sections of buffer enrolled in NC CREP along
the same stream. These sections had two distinct widths, but were also in two distinct topographic locations. The research objectives for this site included: 1.) conduct a detailed hydrologic evaluation of the site, 2.) determine changes in NO3--N concentrations through the
buffer, 3.) evaluate contributions of denitrification and dilution to observed NO3--N
reductions, and 4.) based on research findings, make recommendations for ideal buffer locations for future enrollments in NC CREP, to maximize water quality impacts of the program.
transects within each buffer section to monitor shallow (1.5-2.3 m) and deep (2.7 -3.6 m) groundwater nitrate levels.
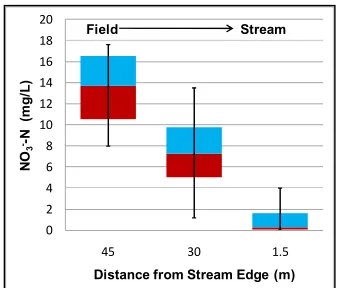
NO3--N decreased at the 1.5 m depth through the buffers from Zone 3 (grassed filter
strip) to Zone 1(stream edge) with average NO3--N concentrations of 4.5 to 1.7 mg/L and
12.9 to 1.4 mg/L in Section 1 and Section 2 respectively. Likewise, NO3--N decreased
through the buffers from Zone 3 to Zone 1 at the 3 m depth with average NO3--N
concentrations of 2.9 to 2.5 mg/L and 12.8 to 6.0 mg/L for Section 1 and Section 2 respectively. Section 2 significantly reduced NO3--N at both the 1.5 m and 3 m depths, while
Section 1 only had significant NO3--N reductions at the 1.5 m depth (α=0.05). The
groundwater NO3--N concentrations entering each section’s Zone 3 were significantly
different and had an enormous impact on overall nitrate mass in each buffer section. These differences were attributed to contributing groundwater areas from the adjacent field.
Hydrology and water quality results supported denitrification was the predominant NO3--N reduction mechanism in both sections. The relative wetness of Zones 2 and 1, low
redox readings and high DOC concentrations during the summer months indicated the sections were suitable for denitrification to proceed. Dilution was most likely minimal as groundwater NO3--N concentrations and NO3--N /Cl- ratios and a deeper aquifer water
quality assessment indicated the waters were separated. Both sections effectively reduced NO3--N concentrations through the buffer. Section 2 appeared to reduce groundwater NO3--N
concentrations as high as entering Section 2, but was constrained by entering NO3--N
Groundwater Nitrate Reductions within Upstream and Downstream Sections of a Riparian Buffer
by
Tiffany LaRose Messer
A thesis submitted to the Graduate Faculty of North Carolina State University
in partial fulfillment of the requirements for the degree of
Master of Science
Biological and Agricultural Engineering
Raleigh, North Carolina 2010
APPROVED BY:
_______________________________ ______________________________ Dr. Michael R. Burchell Dr. Deanna L. Osmond
Committee Chair Minor Representative
DEDICATION
I would like to dedicate this to the people who have loved and continue to love me
unconditionally and support me through this long and sometimes difficult journey.
To the love of my life Patrick S. Messer
Thank you for always being my inspiration in all aspects of life.
To Mom and Dad
Thank you for teaching me to love and always supporting me to continue my education.
To Tabitha, Bethany, Drew, and Shaina
Thank you for always being there for me and one another.
To my grandparents
BIOGRAPHY
Tiffany Messer was born on September 27, 1986 in Lexington, KY to Drew and Lorra Graham. She is the oldest of three younger siblings Tabitha, Bethany, and Drew. Growing up on a farm outside of Winchester, KY where they raised beef cattle, tobacco, and corn, she soon became aware of the importance of agricultural and water quality. During her high school years she became very active in Calvary Christian Church and learned of her desire to improve water quality conditions in financially limited locations. She graduated from George Rogers Clark High School in 2004.
After graduation she enrolled at the University of Kentucky in Lexington, KY. She received her B.S. in Biosystems and Agricultural Engineering with a specialty in bioenvironmental in 2008. Throughout her undergraduate degree she became involved with several recruitment and leadership roles by serving as an Ambassador for the College of Engineering, and on the College of Agriculture Student Council, the Biosystems and Agricultural Engineering Student Branch, and the ¼ Scale Tractor Team. Three remarkable advisors encouraged and assisted her along the way through her undergraduate program: Dr. Jane Riggs, Dr. Steven Workman, and Dr. Scott Shearer. The opportunities that these three individuals opened for her to participate in, including recruitment, research, and teaching assignments, confirmed her ultimate desire of pursuing a Ph.D. in Biological and Agricultural Engineering and becoming a university professor.
began her M.S. research under the direction of Dr. Michael Burchell in the Biological and Agricultural Engineering Department at North Carolina State University. Her research focus was nitrate reduction in riparian buffers. Despite the long and sometimes heart wrenching process of improving her writing and research techniques, Tiffany ultimately decided to apply to the Ph.D. program at N.
ACKNOWLEDGEMENTS
The completion of this project and degree could never have been completed without the help and support of many incredible individuals. I would first like to thank NC CREP for funding and supporting this project and making this research possible. I would also like to thank my wonderful committee Dr. Michael Burchell, Dr. Garry Grabow, and Dr. Deanna Osmond for their constant guidance. A special thanks needs to be given to my adviser Dr. Michael Burchell for his continuous patience and consistency in using every opportunity to guide and teach me and other students over the past two years. His constant diligence and persistence to teach new writing techniques and how to improve overall writing skills will be a critical and cherished element throughout my career. I would also like to thank Dr. Steve Workman for recommending me to NC State. Dr. Wayne Skaggs and Dr. Francois Brigand, for which I am deeply grateful for their assistance and teaching, were instrumental in assessing and estimating groundwater hydrology and pollutant movement in this project.
An enormous thanks to the dedicated individuals that helped me in the lab and field: Jacob Wiseman, Amey Tilak, Jamie Blackwell, Mike Shaffer, Spencer Davis, Cory George, Laura Lord, Bill Price, and Randall Etheridge. I will never forget sampling in the scorching hot sun, freezing snow, and down pouring rain or our thumbs feeling like they may never be the same again after completing DOC filtered samples in the lab.
extremely difficult to model project. Thank you also to NC DWQ for installing the deep aquifer wells, which made evaluating water quality signatures in the deeper aquifer possible in this project
TABLE OF CONTENTS
LIST OF TABLES ... xiii
LIST OF FIGURES ... xix
CHAPTER 1: INTRODUCTION ... 1
Historical Review ... 1
Riparian Buffers ... 3
Pollutant Removal Processes ... 6
Nitrate Removal Effectiveness of Riparian Buffers... 9
North Carolina Conservation Reserve Enhancement Program ... 16
Research Objectives ... 18
REFERENCES ... 19
CHAPTER 2: EFFECTIVENESS OF NITRATE REDUCTION IN A 43 METER WIDE RIPARIAN BUFFER: A HYDOLOGIC AND BIOGEOCHEMICAL EVALUATION ... 24
ABSTRACT ... 24
INTRODUCTION ... 26
MATERIALS AND METHODS ... 30
Site Description ... 30
Site Instrumentation ... 36
Data Analysis ... 43
Statistics ... 50
RESULTS AND DISCUSSION ... 52
Groundwater Hydrology Data ... 52
Groundwater Gradients ... 56
Saturated Hydraulic Conductivity, Groundwater Velocity, and Residence Time ... 66
Overall Groundwater Quality NO3--N Results ... 68
Transect and Seasonal NO3--N Trends ... 72
NO3--N Summary ... 75
Redox Potential ... 75
Dissolved Organic Carbon (DOC) ... 83
Denitrification Assessment Using NO3--N to Cl- Ratios ... 85
Potential Mixing Between Surficial and Deeper Aquifers ... 92
NO3--N Removal Evaluation through Riparian System ... 97
CONCLUSIONS ... 100
REFERENCES ... 103
CHAPTER 3: EFFECTIVENESS OF NITRATE REDUCTION IN A 60 METER RIPARIAN BUFFER: A HYDOLOGIC AND BIOGEOCHEMICAL EVALUATION ... 109
ABSTRACT ... 109
INTRODUCTION ... 111
MATERIALS AND METHODS ... 115
Site Instrumentation ... 119
Monitoring and Data Collection ... 121
Data Analysis ... 123
Statistical Analysis ... 127
RESULTS AND DISCUSSION ... 128
Groundwater Hydrology ... 128
Saturated Hydraulic Conductivity, Groundwater Velocity, and Residence Time ... 143
Overall Groundwater Quality NO3--N Results ... 145
Transect and Seasonal Groundwater NO3--N Trends ... 148
Groundwater NO3--N Summary ... 151
Redox Potential ... 152
Dissolved Organic Carbon ... 158
Denitrification Assessment Using NO3--N to Cl- Ratios ... 161
Potential Mixing Between Surficial and Deeper Aquifers ... 168
NO3--N Removal Evaluation through Riparian System ... 174
CONCLUSIONS ... 176
REFERENCES ... 179
CHAPTER 4: GROUNDWATER NITRATE REDUCTIONS WITHIN UPSTREAM AND DOWNSTREAM SECTIONS OF A RIPARIAN BUFFER ... 184
INTRODUCTION ... 186
MATERIALS AND METHODS ... 190
Site Description ... 190
Monitoring and Data Collection ... 193
Data Analysis ... 194
Statistical Analysis ... 198
RESULTS AND DISCUSSION ... 198
Overall Summary of Results ... 198
Overall Groundwater Quality NO3--N Results ... 200
Groundwater Hydrology ... 202
Redox Potential and Dissolved Organic Carbon ... 217
Denitrification / Dilution Assessment ... 223
NO3--N Removal Evaluation through Riparian System ... 225
CONCLUSIONS ... 228
REFERENCES ... 231
APPENDICES ... 234
APPENDIX A: Vegetation Assessment ... 235
Vegetation Overview ... 235
APPENDIX B: Soil Analysis ... 237
Section 1 Soil Chemical Analysis ... 237
Section 2 Soil Chemical Analysis ... 237
DEA Procedures (Provided by Amey Tilak, NCSU 2009) ... 239
NC CREP Boring Log Evaluations (NC DENR Div. of Water Quality) ... 245
APPENDIX C: Statistical Evaluation Results ... 253
Code for Statistical Evaluations ... 253
NO3-N Evaluation Example Code (adapted from Grabow, 2010) ... 253
Redox Evaluation Example Code ... 254
NO3--N Statistical Analysis Results using PROC MIXED ... 256
Cl- Statistical Analysis Results using PROC MIXED ... 257
NO3--N/Cl- Statistical Analysis Results using PROC MIXED... 258
DOC Statistical Analysis Results using PROC MIXED ... 259
Na+ Statistical Analysis Results using PROC MIXED ... 260
Ca2+ Statistical Analysis Results using PROC MIXED ... 261
T-tests for Difference in NO3--N Concentrations at the Field Edge ... 262
Evaluation of Treatment 1 and 2 Depth and Deep Aquifer Interactions using PROC MIXED ... 263
Redox Interactions using PROC MIXED ... 266
Code for statistical evaluations using means to take into account day to day variations (Not used in this study) ... 267
NO3 -N Evaluation Example Code ... 267
Redox Evaluation Example Code ... 269
Confined and Surficial Aquifer Evaluation Example Code ... 270
NO3--N Statistical Analysis Results using PROC MIXED ... 271
Cl- Statistical Analysis Results using PROC MIXED ... 272
NO3--N/Cl- Statistical Analysis Results using PROC MIXED... 273
DOC Statistical Analysis Results using PROC MIXED ... 274
Na+ Statistical Analysis Results using PROC MIXED ... 275
T-tests for Difference in NO3--N Concentrations at the Field Edge ... 277
NO3--N, Ca2+, and Na+ differences depending on aquifer ... 278
Redox Interactions using PROC MIXED ... 281
APPENDIX D: Hydraulic Gradient and Flow Direction Modeling and Calculations ... 282
Flow Velocity and Residence Time Calculations ... 283
Groundwater Flow Vectors Modeled in Surfer 9 (Golden Software, 2010) ... 293
APPENDIX E: Nitrogen Application and Removal Calculations ... 305
Potential Nitrate-Nitrogen Mass Removal ... 309
APPENDIX F: Installation Procedures and Laboratory Procedures ... 316
BAE Environmental Analysis Laboratory at NCSU Analytical Procedures ... 316
Water Quality Monitoring Well Installation Procedure ... 316
APPENDIX G: Other Water Quality Constituents ... 319
Section 1 NH4-N and O-PO4 ... 319
Section 2 NH4-N and O-PO4 ... 322
NO3--N concentrations to DOC and DOC over Time ... 325
APPENDIX H: Water Table Elevation and Rainfall Evaluations ... 329
Section 1 Evaluations ... 329
Section 2 Evaluations ... 344
LIST OF TABLES
CHAPTER 2
Table 2. 1: Soil classifications within buffer treatment (USDA-NRCS Soil Survey Staff, 2006). ... 34 Table 2. 2: Transect layout from Zone 3 to Zone 1. Distances are relative to the stream. ... 38 Table 2. 3: Average yearly water table depth in Section 2 Note data was unavailable from November 2007 to April 2008 due to equipment malfunction. ... 54 Table 2. 4: Maximum consecutive days water table was within 30 cm of the soil surface during growing season (March 20th thru November 6th). Highlighted cells are years that wetland hydrology was present at monitored zone locations. Data was missing in July through August of 2005 and March through April 2008. ... 56 Table 2. 5: Average yearly absolute elevation differences between zones. Note data was unavailable from November 2007 to April 2008 due to equipment malfunction. ... 60 Table 2. 6: Particle Size Analysis for Buffer Treatment ... 67 Table 2. 7: Groundwater mixing conclusions based on NO3--N and Cl- concentrations, and NO3--N/Cl- ratios for 1.5 m deep wells downstream transect. ... 89 Table 2. 8: Groundwater mixing conclusions based on NO3--N and Cl- concentrations, and NO3-
-N/Cl- ratios for 1.5 m deep wells center transect. ... 89 Table 2. 9: Groundwater mixing conclusions based on NO3--N and Cl- concentrations, and NO3-
Table 2. 10: Groundwater mixing conclusions based on NO3--N and Cl- concentrations, and NO3
--N/Cl- ratios for 3 m deep wells downstream transect. ... 90 Table 2. 11: Groundwater mixing conclusions based on NO3--N and Cl- concentrations, and NO3
--N/Cl- ratios for 3 m deep wells center transect. ... 90 Table 2. 12: Groundwater mixing conclusions based on NO3--N and Cl- concentrations, and NO3
--N/Cl- ratios for 3 m deep wells in upstream transect. ... 90 Table 2. 13: NO3--N removal per year for varying depths and zones of the studied riparian buffer
treatment system. ... 98 CHAPTER 3
Table 3. 7: Groundwater mixing conclusions based on NO3--N and Cl- concentrations, and NO3-
-N/Cl- ratios for shallow groundwater in the downstream transect. ... 164 Table 3. 8: Groundwater mixing conclusions based on NO3--N and Cl- concentrations, and NO3-
-N /Cl- ratios for shallow groundwater in the center transect. ... 165 Table 3. 9: Groundwater mixing conclusions based on NO3--N and Cl- concentrations, and NO3-
-N/Cl- ratios for shallow groundwater in upstream transect. ... 165 Table 3. 10: Groundwater mixing conclusions based on NO3--N and Cl- concentrations, and NO3
--N/Cl- ratios for deep groundwater in the upstream transect. ... 165 Table 3. 11: Groundwater mixing conclusions based on NO3--N and Cl- concentrations, and NO3
--N/Cl- ratios for deep groundwater in the middle transect. ... 166 Table 3. 12: Groundwater mixing conclusions based on NO3--N and Cl- concentrations, and NO3
--N/Cl- ratios for deep groundwater in the upstream transect. ... 166 Table 3. 13: NO3--N removal per year for varying depths and zones of the studied riparian buffer
treatment system. ... 174 CHAPTER 4
Table 4. 4: a.) Average annual water table depths in Section 1. b.) Average annual water table depths in Section 2. Note data was unavailable from November 2007 to April 2008 due to equipment malfunction. ... 204 Table 4. 5: Maximum consecutive days water table was within 30 cm of the soil surface during growing season (March 20th thru November 6th). Highlighted cells are years that wetland hydrology was present at monitored zones. Data was missing in July through August of 2005 and March through April 2008. ... 206 Table 4. 6: Average yearly groundwater elevation differences between zones in Section 1. Note data was unavailable from November 2007 to April 2008 due to equipment malfunction. ... 212 Table 4. 7: Average yearly groundwater elevation differences between zones in Section 2. Note data was unavailable from November 2007 to April 2008 due to equipment malfunction. ... 213 Table 4. 8: Travel times between each monitoring location in the buffer zones for Sections 1 and 2 based on groundwater angle... 217 Table 4. 9: Potential NO3--N removal per year for varying depths and zones of the studied
riparian buffer section system. ... 226 APPENDIX A
Table A. 1: Plant species for Sections 1 and 2 at the research buffer site ... 236 APPENDIX B
Table B. 2: Section 2 soil chemical analysis completed in the BAE Environmental Analysis Laboratory for the three soil layers closest to the soil surface. ... 238 APPENDIX D
Table D. 7: Section2 1.5m depth flow velocity and residence time calculations using Devlin (2003). Soil type was assumed sandy loam based on soil samples and a porosity of 0.35 was
therefore used. ... 288
Table D. 8: Section 2 3m depth flow velocity and residence time calculations using water table elevation data. Soil type was assumed sandy loam based on soil samples and a porosity of 0.35 was therefore used... 289
Table D. 9: Section 2 3m depth flow velocity and residence time calculations using Devlin (2003). Soil type was assumed sandy loam based on soil samples and a porosity of 0.35 was therefore used. ... 290
Table D. 6: Example sheet of Devlin (2003) for determining groundwater flow angles and gradient ... 291
Table D. 7: Additional example sheet of Devlin (2003) for determining groundwater flow angles and gradient ... 292
APPENDIX E Table E. 1: Nitrogen Application each year on the research study site’s field 1. ... 306
Table E. 2: Nitrogen Application each year on the research study site’s field 2. ... 307
Table E. 3: Nitrogen Application each year on the research study site’s field 3. ... 308
Table E. 4:Potential NO3--N removal based on DEA analysis ... 315
APPENDIX F
LIST OF FIGURES
CHAPTER 1
Figure 1.1: Schematic of the riparian buffer zones (adapted from NRCS, 1997) ... 4 CHAPTER 2
Figure 2. 23: Groundwater angles estimated using Devlin (2003) on contours modeled in Surfer 7 mapping software during 2009 (Golden Software, Golden, CO). ... 64 Figure 2. 24: Groundwater contour map of July 2009 (dry period). ... 65 Figure 2. 25: Groundwater contour map of January 2009 (wet period). ... 66 Figure 2. 26: The 5%, 25%, median, 75%, and 95% percentiles groundwater NO3--N
concentrations over the study for 1.5 m deep surficial wells at differing locations in the riparian buffer (n=165 water quality samples). ... 70 Figure 2. 27: The 5%, 25%, median, 75%, and 95% percentiles groundwater NO3--N
concentrations over the study for 3 m deep surficial wells at differing locations in the riparian buffer (n=201 water quality samples. ... 70 Figure 2. 28: Overall mean groundwater NO3--N concentrations at the 1.5 m and 3 m depths
(n1.5m=550 and n3m = 625 water quality samples). Note – error bars represent standard error. ... 70
Figure 2. 29: Highest, lowest, and average soil redox readings at the 1.5 and 3 m soil depths at differing distances relative to the stream (June 2005 to April 2010). ... 72 Figure 2. 30: Transect and seasonal NO3--N evaluation at the 1.5 m depth (n=55 water quality
samples) ... 74 Figure 2. 31: Transect and seasonal NO3--N evaluation at the 3 m depth (n=65 water quality
Figure 2. 33: Seasonal evaluation of redox readings in the buffer from Zone 3 to Zone 1 (n=45 during each season). ... 78 Figure 2. 34: Soil redox compared to NO3--N in center transect at the 1.5 m depth well (June
2005 to April 2010). ... 79 Figure 2. 35: Soil redox compared to NO3--N in center transect at the 3 m depth well (June 2005
Figure 2. 42. The 5%, 25%, median, 75%, and 95% percentiles of NO3--N/Cl- ratio over the
study for 1.5 m deep surficial wells at differing locations in the riparian buffer (n=55 water quality samples). Samples were taken from January 2005 – May 2010. ... 87 Figure 2. 43. The 5%, 25%, median, 75%, and 95% percentiles of NO3--N/Cl- ratio over the
study for 3 m deep surficial wells at differing locations in the riparian buffer (n=67 water quality samples). Samples were taken from January 2005 – May 2010. ... 87 Figure 2. 44: Means of deeper aquifer compared to means of 1.5 m and 3 m depth water quality constituents at the stream and field edge of the riparian buffer treatment system (n values for the 1.5 m, 3 m, 8 m, and 11 m depths were 89, 120, 60, and 20 respectively for NO3--N and chloride;
n values for the 1.5 m, 3 m, 8 m, and 11 m depths were 68, 95, 60, and 20 respectively for calcium and sodium). Make note that the calcium quantity in the deep aquifer was cut off for viewing purposes. ... 93 Figure 2. 45:NO3--N concentrations at sampled depths. Quantity of samples collected at 1.5
Figure 2. 49: NO3--N concentrations compared to calcium concentrations. Quantity of samples
collected at 1.5 m, 3 m, 8 m, and 11 m were 62, 89, 60, and 20 respectively. ... 96 Figure 2. 50: NO3--N concentrations compared to sodium concentrations. Quantity of samples
collected at 1.5 m, 3 m, 8 m, and 11 m were 62, 89, 60, and 20 respectively. ... 97 CHAPTER 3
Figure 3. 22: Groundwater contour map of January 2009 (wet period). ... 142 Figure 3. 23: The 5%, 25%, median, 75%, and 95% percentiles of groundwater NO3--N
concentrations over the study for 1.5 m deep surficial wells at differing locations in the riparian buffer (n=144 water quality samples). ... 146 Figure 3. 24: The 5%, 25%, median, 75%, and 95% percentiles of groundwater NO3--N
concentrations over the study for 3 m deep surficial wells at differing locations in the riparian buffer (n=202 water quality samples). ... 146 Figure 3. 25: Overall mean groundwater NO3--N concentrations at the 1.5 m and 3 m depths
(n1.5m=694 and n3m = 836water quality samples). Note – error bars represent standard error. .. 147
Figure 3. 26: Overall mean groundwater NO3--N concentrations per year at the 1.5 m and 3 m
depths (n1.5m=793 and n3m = 886water quality samples). ... 148
Figure 3. 27: Transect and seasonal groundwater NO3--N evaluation at the 1.5 m depth (n=55
water quality samples). ... 150 Figure 3. 28: Transect and seasonal groundwater NO3--N evaluation at the 3 m depth (n=65 water
Figure 3. 32: Zone 1 (stream edge) 5 averaged monthly redox readings with respect to water table elevation at same location (June 2005 to April 2010). ... 156 Figure 3. 33: Lower Zone 2 (mid buffer) 5 averaged monthly redox readings with respect to water table elevation at same location (June 2005 to April 2010). ... 156 Figure 3. 34: Upper Zone 2 (mid buffer) 5 averaged monthly redox readings with respect to water table elevation at same location (June 2005 to April 2010). ... 157 Figure 3. 35: Zone 3 (field edge) 5 averaged monthly redox readings with respect to water table elevation at same location (June 2005 to April 2010). ... 157 Figure 3. 36: Average DOC concentrations for research site (n=176). Note error bars represent standard error and outliers from suspected well contamination by dead animal or plant material were removed. ... 159 Figure 3. 37: Seasonal evaluation of DOC (n=176) from March 2008-May 2010. 1.5 m depth results for Zone 3 and Zone 2 for fall were unattainable due to low water table elevations at the research site at the time of sampling. ... 160 Figure 3. 38: The 25%, The 5%, 25%, median, 75%, and 95% percentiles of NO3--N/Cl- ratio
over the study for 1.5 m deep surficial wells at differing locations in the riparian buffer (n=55 water quality samples). Samples were taken from January 2005 – May 2010. ... 162 Figure 3. 39: The 25%, The 5%, 25%, median, 75%, and 95% percentiles of NO3--N/Cl- ratio
Figure 3. 40: Means deeper aquifer compared to means of shallow, and deep water quality constituents at the stream and field edge of the riparian buffer treatment system (1.5 m, 3 m, 8 m, and 11 m were 78, 120, 60, and 20 respectively for NO3--N and Chloride; 1.5 m, 3 m, 8 m, and
11 m were 53, 87, 60, and 20 respectively for calcium and sodium). Make note that the calcium quantity in the deep aquifer was cut off for viewing purposes. ... 169 Figure 3. 41:NO3--N concentrations at sampled depths. Quantity of samples collected at 1.5 m, 3
m, 8 m, and 11 m were 78, 120, 60, and 20 respectively... 170 Figure 3. 42: Chloride concentrations at sampled depths. Quantity of samples collected at 1.5 m, 3 m, 8 m, and 11 m were 78, 120, 60, and 20 respectively. ... 170 Figure 3. 43: Calcium concentrations at sampled depths. Quantity of samples collected at 1.5 m, 3 m, 8 m, and 11 m were 53, 87, 60, and 20 respectively... 171 Figure 3. 44: Sodium concentrations at sampled depths. Quantity of samples collected at 1.5 m, 3 m, 8 m, and 11 m were 53, 87, 60, and 20 respectively. ... 171 Figure 3. 45: NO3--N concentrations compared to calcium concentrations. Quantity of samples
collected at 1.5 m, 3 m, and the deeper aquifer were 53, 87, and 80 respectively. ... 172 Figure 3. 46: NO3--N concentrations compared to sodium concentrations. Quantity of samples
collected at 1.5 m, 3 m, and the deeper aquifer were 53, 87, and 80 respectively. ... 173 CHAPTER 4
Figure 4. 4: Section 1 overall mean groundwater NO3--N concentrations at the 1.5 m and 3 m
depths (n1.5m=694 and n3m = 836 water quality samples). Note – error bars represent standard
error. ... 200 Figure 4. 5: Section 2 overall mean groundwater NO3--N concentrations at the 1.5 m and 3 m
depths (n1.5m=550 and n3m = 625 water quality samples). Note – error bars represent standard
Figure C. 1: Treatment 1 NO3--N statistical analysis results ... 256
Figure C. 2: Treatment 2 NO3--N statistical analysis results ... 256
Figure C. 3: Treatment 1 Cl- statistical analysis results ... 257 Figure C. 4: Treatment 2 Cl- statistical analysis results ... 257 Figure C. 5: Treatment 1 NO3--N/Cl- Statistical Analysis Results ... 258
Figure C. 6: Treatment 2 NO3--N/Cl- Statistical Analysis Results ... 258
Figure C. 7: Treatment 1 DOC Statistical Analysis Results ... 259 Figure C. 8: Treatment 2 DOC Statistical Analysis Results ... 259 Figure C. 9: Treatment 1 Na+ Statistical Analysis Results ... 260 Figure C. 10: Treatment 2 Na+ Statistical Analysis Results ... 260 Figure C. 11: Treatment 1 Ca2+ Statistical Analysis Results ... 261 Figure C. 12: Treatment 2 Ca2+ Statistical Analysis Results ... 261 Figure C. 13: NO3--N differences between Treatments 1 and 2 ... 262
Figure C. 14: Nitrate differences depending on well depth for Treatment 1 ... 262 Figure C. 15: Nitrate differences depending on well depth for Treatment 2 ... 263 Figure C. 16: T-test of the NO3--N concentrations between Treatment 1 surficial and confined
aquifers ... 263 Figure C. 17: T-test of the NO3--N concentrations between Treatment 2 surficial and confined
Figure C. 19: T-test of the Ca2+concentrations between Treatment 2 surficial and confined aquifers ... 265 Figure C. 20: T-test of the Na+ concentrations between Treatment 1 surficial and confined aquifers ... 265 Figure C. 21: T-test of the Na+ concentrations between Treatment 2 surficial and confined aquifers ... 266 Figure C. 22: Treatment 1 redox statistical analysis results ... 266 Figure C. 23: Treatment 2 redox statistical analysis results ... 267 Figure C. 24: Section 1 NO3--N statistical analysis results ... 271
Figure C. 25: Section 2 NO3--N statistical analysis results ... 271
Figure C. 26: Section 1 Cl- statistical analysis results ... 272 Figure C. 27: Section 2 Cl- statistical analysis results ... 272 Figure C. 28: Section 1 NO3--N/Cl- Statistical Analysis Results ... 273
Figure C. 29: Section 2 NO3--N/Cl- Statistical Analysis Results ... 273
Figure C. 36: T test of NO3--N Concentration differences at the field edge of Section 1 and
Section 2... 277 Figure C. 37: T-test of the NO3--N concentrations between Section 1 surficial and confined
aquifers ... 278 Figure C. 38: T-test of the NO3--N concentrations between Section 2 surficial and confined
aquifers ... 278 Figure C. 39: T-test of the Ca2+ concentrations between Section 1 surficial and confined aquifers ... 279 Figure C. 40: T-test of the Ca2+concentrations between Section 2 surficial and confined aquifers ... 279 Figure C. 41: T-test of the Na+ concentrations between Section 1 surficial and confined aquifers ... 280 Figure C. 42: T-test of the Na+ concentrations between Section 2 surficial and confined aquifers ... 280 Figure C. 43: Proc mixed of redox interactions in Section 1 ... 281 Figure C. 44: Proc mixed of redox interactions in Section 2 ... 281 APPENDIX D
Figure D. 5: Groundwater flow vectors during November 2008 ... 295 Figure D. 6: Groundwater flow vectors during December 2008 ... 296 Figure D. 7: Groundwater flow vectors during January 2009 ... 296 Figure D. 8: Groundwater flow vectors during February 2009 ... 297 Figure D. 9: Groundwater flow vectors during March 2009 ... 297 Figure D. 10: Groundwater flow vectors during April 2009 ... 298 Figure D. 11: Groundwater flow vectors during May 2009 ... 298 Figure D. 12: Groundwater flow vectors during June 2009 ... 299 Figure D. 13: Groundwater flow vectors during July 2009 ... 299 Figure D. 14: Groundwater flow vectors during August 2009 ... 300 Figure D. 15: Groundwater flow vectors during September 2009... 300 Figure D. 16: Groundwater flow vectors during October 2009 ... 301 Figure D. 17: Groundwater flow vectors during November 2009 ... 301 Figure D. 18: Groundwater flow vectors during December 2009 ... 302 Figure D. 19: Groundwater flow vectors during January 2010 ... 302 Figure D. 20: Groundwater flow vectors during February 2010 ... 303 Figure D. 21: Groundwater flow vectors during March 2010 ... 303 Figure D. 22: Groundwater flow vectors during April 2010 ... 304 Figure D. 23: Groundwater flow vectors during May 2010 ... 304 APPENDIX E
Figure E. 2: DEA after one hour of incubation. ... 311 Figure E. 3: DEA after four hours of incubation. ... 312 Figure E. 4: DEA for Transect A after one hour of incubation. ... 313 Figure E. 5: DEA for Transect A after four hours of incubation. ... 313 Figure E. 6: DEA for Transect C after one hour of incubation. ... 314 Figure E. 7: DEA for Transect C after four hours of incubation ... 314 APPENDIX F
Figure F. 1: Well Installation ... 318 APPENDIX G
Figure G. 1: NH4-N to NO3--N at water quality monitoring depths 1.5 m and 3m (nshallow = 50 and
ndeep= 64) ... 320
Figure G. 2: O-PO4 NO3--N at water quality monitoring depths 1.5 m and 3m (nshallow = 50 and
ndeep= 64) ... 320
Figure G. 3: Section 1 average NH4-N at the 1.5 m and 3 m monitoring depths (nshallow = 50 and
ndeep= 64) ... 321
Figure G. 4: Section 1 average O-PO4 at the 1.5 m and 3 m monitoring depths (nshallow = 50 and
ndeep= 64) ... 321
Figure G. 5: NH4-N to NO3--N concentrations at the 1.5 m and 3 m monitoring depths (n1.5 m= 50
and n3m=64) ... 323
Figure G. 6: O-PO4 to NO3--N concentrations at the 1.5 m and 3 m monitoring depths (n1.5 m= 50
Figure G. 7: Section 2 average NH4-N at the 1.5 m and 3 m monitoring depths (n1.5 m= 50 and
n3m=64)... 324
Figure G. 8: Section 2 average O-PO4 at the 1.5 m and 3 m monitoring depths (n1.5 m= 50 and
n3m=64)... 324
Figure G. 9: Section 1 NO3--N concentrations to DOC at 1.5 m below the soil surface. ... 325
Figure G. 10: Section 1 DOC at 1.5 m below the soil surface. ... 325 Figure G. 11: Section 1 NO3--N concentrations to DOC at 3 m below soil surface ... 326
Figure G. 12: Section 1 DOC at 3 m below the soil surface. ... 326 Figure G. 13: Section 2 NO3--N concentrations to DOC at 1.5 m below the soil surface. ... 327
Figure G. 14: Section 2 DOC at 1.5 m below the soil surface. ... 327 Figure G. 15: Section 2 NO3--N concentrations to DOC at 3 m below soil surface ... 328
Figure G. 16: Section 2 NO3--N concentrations to DOC at 3 m depth below soil surface ... 328
APPENDIX H
CHAPTER 1: INTRODUCTION
Historical Review
The amendment to Section 319 of the Clean Water Act in 1987 focused on nonpoint sources (NPS) of pollution to water quality. NPS pollution has impaired a substantial amount of streams and estuaries in the United States including North Carolina over the past century. All states must now report the progress of restoring impaired water bodies within a set time period using Best Management Practices (BMPs) as required under the Clean Water Act (CWA, 1987).
Concerns of the North Carolina – Department of Environment and Natural Resources (DENR) have elevated over the past 30 years regarding the water quality conditions of the Neuse and Tar-Pamlico River Basins. During the mid-1970’s eutrophication became a predominant concern as evidence of these conditions were found in stream surveys of the Neuse River. Eutrophication is a condition caused by excessive nutrient availability resulting in algal blooms that reduce oxygen levels in streams that can result in fish kills. A two year special investigation was completed during the late 1980’s and early 1990’s for the Neuse River to examine the causes of the algal blooms, leading to reevaluation of regulations (NCDWQ, 2002). Nonpoint source pollution was found to make up a large portion of the nitrogen loading to the Neuse River in North Carolina and majority of this is from agricultural practices (NRDC, 1998).
and harmful algal blooms were occurring in the mid-1980’s (NCDWQ, 2007). Therefore, North Carolina – DENR implemented the Tar-Pamlico Nutrient Strategy in 1990 (NCDWQ, 2008). The strategy was comprised of three phases. Phase I (1990-1994) focused on known point source pollution, such as industrial plants, and developed more cost effective ways to reduce nutrient loading (NCDWQ, 2008). Phase II (1994-2004) targeted both point and nonpoint pollution sources. The point source pollution goals for Phase II included keeping phosphorus loading levels measured during 1991 constant depending on estuarine conditions and establishing a 30% reduction in nitrogen loading levels (NCDWQ, 2008). During Phase II, increasing concerns of the impacts of NPS pollution on water quality led to additional regulations being added to the initial phase comprised of voluntary actions. Mandatory rules addressing agriculture, urban stormwater, fertilizer management, and riparian buffer protection were adopted in 2004 (NCDWQ, 2008). Phase III (2004-2014) extends the goals set in Phase II for an additional ten years including the 30% nitrogen reduction.
The reduction of nitrogen has been a critical focus for maintaining acceptable water quality throughout North Carolina for many years and continues today. Nitrate-nitrogen (NO3-
-N) is a form of nitrogen that adds a considerable amount to the total nitrogen loading in water sources, such as streams. Agricultural NPS pollution is also the leading contributor of NO3--N to
throughout the state of North Carolina that are currently, or have the potential to be, impaired due to NPS pollution.
Riparian Buffers
Riparian buffers are one of several focus areas defined in North Carolina that can reduce NPS pollution. The USDA Forest Service defines riparian buffers as (2010):
“An area of trees and other vegetation located in areas adjoining and upgradient from
surface water bodies and designed to intercept surface runoff, wastewater, subsurface flow and
deeper groundwater flows from upland sources for the purpose of removing or buffering the
effects of associated nutrients, sediment, organic matter, pesticides or other pollutants prior to
entry into surface waters and groundwater recharge areas.”
Additionally, riparian buffers are defined as follows by leading experts (Lowrance et. al, 1985; Osmond et. al, 2002):
A complex assemblage of plants, organisms, and their environment adjacent to water.
Riparian buffers may include wetlands, stream banks, and floodplains since they do not have
definitive boundaries. Characterized by laterally flowing water that rises and falls at least once
within a growing season and being linear shape, riparian buffers also have a high degree of
connectiveness with other ecosystems.
Researchers have reported riparian buffers reduce NO3--N concentrations found in surface water
and groundwater and improve overall water quality in the adjacent water resources (Evans et. al, 2007;Gilliam, 1994; Dukes et al., 2002; Hill, 1996; Schultz et al., 1995).
The United States – Department of Agriculture (USDA) promotes a three zone buffer with distinct vegetation zones to minimize stream contamination (Welsh, 1991). The three vegetation zones work collectively to reduce nutrient runoff (Figure 1.1). Zone 1 includes the area from the edge of the active channel to a minimum 4.6 m (15 ft) perpendicular to the incoming water flow. Vegetation is predominantly hardwoods and should remain undisturbed. Zone 2, with a minimum width of 13.7 m (45 ft), has vegetation that is comprised of that similar to Zone 1, but allows some disturbances. Examples of these disturbances include timber management including harvesting, grading and revegetation, road intrusions into the buffer, and periodic mowing with mitigation (NCDWQ, 2008). Zone 3 has a width of approximately 6.1 m (20 ft). Vegetation in Zone 3 is a grassed filter strip. The area can be used for grazing, but must have some type of grass present at all times (Lowrance et. al¸1995).
The three zone design utilizes biogeochemical, physical, and biological mechanisms to reduce pollutants from entering waterways. High water tables and carbon sources from vegetation litter primarily in Zone 1 and 2 provide suitable conditions for biogeochemical processes to occur to reduce subsurface pollutants, such as NO3--N. Physically, riparian zones
provide bank stabilization, shading and a reduction in sedimentation. Zone 1 is designed to enhance bank stability and decrease erosion through the root system of the trees around the stream bank (Lowrance et al., 1997). The trees further provide shade over the stream to reduce water temperatures for suitable habitats for stream biota (Tabacchi et. al, 1998). Litter cover in all three zones reduces the velocity of runoff. The riparian zones also provide aquatic and wildlife habitat by providing food, (in the form of carbon), cover, and water (Osmond et al, 2002).
The state of North Carolina has recognized the potential of riparian buffers to reduce NPS pollution; thus they have implemented nonpoint rules specifically for riparian zones.
Three riparian buffer rules have been mandated by NC-DENR (NCDWQ, 2008):
land activities. (i.e. grading and revegetation, road intrusions into the buffer, and periodic mowing)
2.) Mitigation Rule: The rule identifies the process applicants follow to receive approval for activities that are allowed with mitigation and outlines the mitigation measures.
3.) Delegation Rule: The rule arranges the requirements and the process for the implementation of buffer rules in local government jurisdictions.
The rules were implemented to increase pollutant reduction opportunities. The protection rule ensures the buffer area will remain undisturbed for biogeochemical and physical processes to proceed, while the mitigation and delegation rules deal with the logistics between the landowner and government. The three rules work collectively to potentially increase pollutant removal efficiency.
Pollutant Removal Processes
by a number of mechanisms. These include denitrification, plant immobilization, and microbial immobilization (Hill, 1996). Of these, denitrification is the only process that can completely remove NO3--N from the system. That is why much research has focused on this process.
Enhanced denitrification could be the solution for removing the majority of NO3--N prior
to entering waterways (Dukes et al., 2002; Hefting et al., 2005, Spruill, 2004). Denitrification is an anaerobic, microbially mediated process where NO3--N is converted into (harmless) nitrogen
gas (N2) and then released into the atmosphere. If NO3--N is found in the soil pore water,
denitrification can occur provided the following conditions are present (Postma et al., 1991; Puckett, 2004; Knowles, 1982; Korom, 1992; Sylvia et. al, 1998):
1.) Denitrifying bacteria 2.) Anaerobic conditions
3.) A carbon source that can act as an electron donor 4.) Suitable temperature (35-60° C)
5.) Suitable pH conditions (near neutrality)
The following equation displays the chemical process of denitrification (Brady et al., 2008). en teOfNitrog ValenceSta Gas Dinitrogen Nos O deGas NitrousOxi Nor O eGas NitricOxid Nir O s NitriteIon Nar O s NitrateIon N O N NO NO NO ← − + − + − + − − + − ↑ → ↑ → ↑ → → ) 0 ( 2 ) 1 ( 2 ) 2 ( 2 ) 3 ( 2 2 ) 5 (
3 2 2
2 (1. 1)
the form of nitrous oxide instead of oxygen as an electron acceptor. An electron donor in the form of organic carbon is used to reduce nitrogen into oxidized forms. The majority of the bacteria involved in this chemical transfer reaction is heterotrophs and require organic carbon as the electron donor. Predominate types of denitrifying bacteria include Pseudomonas, Alcaligenes, Flavobacterium, and Bacillus, with Pseudomonas being the most commonly found (Knowles, 1982). Four enzymes correspond with each step of the process: dissimilatory nitrate reductase (Nar), nitrite reductase (Nir), nitric oxide reductase (Nor), and nitric oxide reductase (Nor) (Knowles, 1982; Sylvia et. al, 1998).
All of the denitrification enzymes are inhibited by oxygen, which requires submerged conditions in the microsite locations (Sylvia et. al, 1998). Therefore, anoxic conditions are crucial for denitrification to occur. Sylvia et al. (1998) reported that Nar and Nir become active once oxygen concentrations reach below 10% of the atmospheric concentrations (approximately 0.29 mmolO2/LH2O at 20° C). Consequently, variability in water table fluctuation throughout the
year considerably affects the rate of denitrification.
highly dependent on temperature and pH conditions in the soil for bacteria to survive and enhance NO3--N reduction. Knowles (1982) cited studies that found denitrification to occur at
reduced rates between 10 to 35° C and increase to temperatures of 60 to 75° C then diminish substantially after this point. The pH is critical for denitrification rates as well. Sylvia et. al (1998) reported that the denitrifying bacteria functions best near neutrality and low pH inhibits enzyme activity slowing denitrification rates.
Nitrate Removal Effectiveness of Riparian Buffers
Riparian buffers can be ideal for denitrification, but research shows it can be highly variable. Maintaining the ideal conditions in riparian zones for denitrification to occur is critical to increase the efficiency of NO3--N reduction through these systems. Riparian buffers have
been found to reduce NO3--N concentrations as much as 90%, while in other cases have been
found to have no effect on NO3--N concentrations entering adjacent stream channels (Lowrance et al., 1984; Lowrance, 1992; Dukes et al., 2002; Hunt et al., 2004; Peterjohn et al., 1984; Angier et al., 2008; Spruill, 2004). Therefore, identifying design components which enhance NO3--N removal in these systems is critical for buffers to meet water quality goals.
topography, soil permeability, hydraulic conductivity, and carbon availability that lead to ideal conditions for denitrification to occur in buffer systems.
Groundwater flow along with water table depth is highly dependent on soil types and seasonality. In a study by Spruill (2004), four buffer sites had a range of NO3--N reduction from
95% to 0%. The lack of NO3--N reduction was postulated due to lack of groundwater flow
though the buffer area before entering the stream. Groundwater bypass of the active denitrification zones in buffers can occur when, for example, groundwater flow paths do not intercept the buffer due to topographic gradients or restrictive soils, along with high evapotranspiration during the summer along with seasonally deep water table levels that do not allow groundwater to reach active denitrification zones. Dukes et al (2002) documented that two of six studied riparian buffers had water table gradients such that water moved from the streams into the buffers. Therefore no NO3--N reduction was provided for the adjacent field by the two
buffers. Puckett (2004) completed at study on 13 buffers focusing on groundwater NO3--N fate
with respect to the groundwater flow paths. Findings suggested deep groundwater did not reach reduction zones in the buffers due to tile drains, ditches, or flow paths beneath the denitrifying zones. Higher rates of denitrification have been found to occur during warmer months, and higher NO3--N concentrations in the stream were found in cooler months during a buffer study
Residence time is an important factor for NO3--N to reach denitrifying microsites and
undergo denitrification. The velocity at which water travels is highly related to the topography and soil permeability in the riparian zone. Vidon et al. (2004) examined eight riparian sites to define the effect of topography on NO3--N reduction and water table fluctuations using a model.
Topographic qualities in the riparian zones were identified as critical components for decreasing runoff and groundwater velocity within the buffer. Decreased velocities from flatter topographies allow more time for the water to seep through the riparian buffer and possibly denitrify in the soil. Schiff et. al (2002) found that deeper water tables were caused by larger hydraulic gradients, increased hydraulic conductivity, and decreased residence times in the riparian zone, resulting in less NO3--N reduction.
Increased buffer width has also been evaluated to observe its effectiveness in increasing residence time and reducing NO3--N. Dukes’ et al. (2002) study of four riparian buffers with
differing widths concluded that the wider plot (15 m) had a 15% greater decrease of NO3--N
compared to the thinner plot (8 m). These differences were most likely due to increased residence times through the buffer. Mayer et. al (2007) completed a meta-analysis of 89 buffers to estimate buffer NO3--N reduction with widths ranging from 0 to 50 m. The analysis took into
account vegetation type and hydrologic flow conditions. NO3--N reduction increased as width
Angier’s et al. (2008) study of a riparian buffer examined widths varying from 60 to 250 m. Groundwater samples indicated that the highest NO3--N concentrations were found in areas with
buffer widths greater than 100 m. The study concluded that NO3--N reduction is not only
dependent on the component of buffer width, but the flow direction and depth at which groundwater flows through buffer zones was equally, if not more, critical for NO3--N reduction.
Reduction of NO3--N can be dependent on the depth that groundwater flows through the
riparian zones during low-flow regimes. In one of many studies, 89% of NO3--N reduction,
NO3--N concentrations were lower because of increased denitrification rates in coarse sediment
layers that was receiving carbon leaching downward from overlying organic rich horizons. Irregular flow patterns and fluctuating water tables decrease anoxic conditions suitable for denitrification at soil depths close to the surface and have also been reported to decrease NO3--N
reduction effectiveness during dry regimes (Kellogg et. al, 2005).
Soil stratification and conductivity studies have also shown to have an important effect on reduction of NO3--N. Davis et al. (2007) completed a study on NO3--N reduction through the
A and C soil horizons in shallow groundwater of a riparian buffer with a lateral flow path. Results from well samples were believed to show that the NO3--N concentration in the A horizon
experienced dilution from precipitation combined with biological consumption (mostly from plant uptake and denitrification), while the C horizon only showed biological consumption. Again groundwater NO3--N removal correlates to the amount of organic material found on the
surface of the buffer. Hefting (2005) reported that biomass production differed significantly in a study of several forested sites between vegetation types. The forested vegetation site had higher organic carbon availability from plant litter on the forest floor and a higher efficiency for NO3--N
reduction. Vidon et al., 2004 reported similar results in a study of two riparian zones. Spruill (2004) found higher NO3--N removal efficiencies in soil strata with lower hydraulic
conductivities possibly due to longer residence times in the riparian zone.
be measured in soil to identify the tendency for a component to accept or donate electrons and predict reduced species in the soil solution (Sylvia et al., 1998; Richardson and Vepraskas, 2001). The potential difference is created as electrons are transferred, becoming more positive (soil oxidized) as a substance loses electrons and more negative (soil waterlogged) as a substance gains electrons (Sylvia et al., 1998). Oxidized soils tend to take electrons from the Pt wire, while reduced soils transfer electrons to the electrode (Richardson and Vepraskas, 2001). Therefore, lower redox potential readings usually exhibit anoxic soils with available carbon sources (Sylvia et al., 1998). The redox potential is measured using a Pt-tipped electrode and a reference electrode creating a standard set of conditions (Richardson and Vepraskas. 2001). The Pt wire is used since it is chemically inert, only conducts electrons, does not generally react with itself, and does not oxidize readily as metals such as Fe, Cu, and Al often do (Richardson and Vepraskas, 2001). In field measurements are completed using a portable Ph/millivolt (mV) and saturated calomel or silver/silver-chloride reference electrode, where the redox potential is measured in millivolts (mV).
Patrick (1960) showed evidence that NO3--N begins to undergo denitrification at redox potentials
as high as 250 mV, with increasing NO3--N concentration reductions correlated with decreasing
redox potential.
Difficulties in establishing if denitrification is responsible for observed NO3--N reduction
in concentrations are often attributed to the possibility of deeper groundwater mixing within the riparian zones. Discharge and upwelling areas within buffers have been found to have converging flowpaths that could dilute the amount of NO3--N in groundwater, because the deeper
groundwater typically contains low NO3--N concentrations (Mengis et al., 1998). Researchers
have developed several methods to determine if removal of NO3--N observed is indeed
denitrification or dilution. Lowrance (1992) along with other researchers used chloride, from well samples in the riparian zones, to provide evidence that denitrification and not dilution was responsible for observed NO3--N losses. The conservative ion chloride (i.e. having minimal
plant uptake and not undergoing microbial transformations in soil) was used to compare changes in the ion relative to NO3--N through the buffer. Results showed that chloride decreased along
with NO3--N through the buffer towards the stream, indicating dilution occurring. Mengis et al.
(1998) used 15N, which is stable and nonradioactive, to evaluate the dynamics of denitrification through riparian buffers. Widory et al. (2003) found that 15N enrichment increased as NO3--N
comparison with NO3--N leading to conclusions that microbial denitrification was occurring
within the riparian zones.
Studies have shown how denitrification can occur in these systems and the mechanisms that can affect their pollutant reduction efficiencies. Still, designing and establishing the ideal buffer has been debatable as to how to meet all the needed conditions to maximum denitrification efficiency as described above. More research is needed to determine critical design mechanisms that can maximize NO3--N reduction for these systems. Additional studies
will add to the progress that has been made and enhance the overall impact of riparian zones.
North Carolina Conservation Reserve Enhancement Program
Research has accomplished enough to justify recommending and funding buffers in conservation programs. However, to maximize their benefit there are still many questions unanswered. Studies are needed to define the most important combinations of these factors to maximize NO3--N removal in these systems. For example riparian buffers are one of the primary
BMPs endorsed by the North Carolina Conservation Reserve Enhancement Program (NC CREP) to improve water quality, but enrollments are not always ideal sites.
and technical assistance to producers (USDA, 2010). The program’s goals are to improve water quality by reducing sediment and nutrient loading in the basins using Best Management Practices (BMPs). As of 2007 NC CREP had 31,794 acres enrolled in the program that protects approximately 873 stream miles. NC CREP hopes to enroll 100,000 acres of environmentally sensitive land through the program.
Producers that choose to take part in the program sign at least a 10 to 15 year contract to convert sensitive cropland and pastureland to conservation practices encouraged by the program (USDA, 2010). A percentage of the soil rental rates and installation costs will be paid to the producers depending on what practice they plan to implement and the length of their contract. The 2007 NC CREP Annual Report proposed paying $1000 per acre for permanent easements and $250 per acre for 30-year easements. Eligible BMPs include tree planting of shortleaf pines, hardwood tree planting, filter strips, riparian buffers, wetland restoration, and bottomland timber establishment on wetlands (USDA, 2010). Riparian buffers must have a minimum impact zone of either 50 or 100 feet with limited tree removal. Payments vary depending on county, length of contract, CRP soil rental rates, and tax value of the cropland
Research Objectives
The evaluated research site in this study has been a part of NC CREP since 2004. The location of the site is in Halifax County, North Carolina and part of the Tar-Pamlico River watershed. The site location was chosen by finding an area that appeared to be an ideally functional riparian buffer situated correctly in the landscape. The riparian buffer was receiving a source of nutrients, nitrogen, from an adjacent row crop field. The adjacent field at the research site also enabled data analysis to not be complicated by hydrologic variables such as short circuits by old tile drains or deeply incised qualifying streams/canals. The proposed research will address hydrologic and biogeochemical factors that affects of NO3--N removal in buffers,
particularly through denitrification. Objectives of the research project are:
1.) Complete a water quality and hydrologic assessment on riparian buffer effectiveness in reducing groundwater NO3--N through denitrification
2.) Determine the effect dilution from deeper groundwater has on reduction of NO3--N
through the buffer
3.) Determine if differences in buffer width affect NO3--N reductions through the buffer
REFERENCES
100th United States Congress. 1987. Clean Water Act. Washington D.C.: United States Congress. Angier, J.T. and G.W. McCarty. 2008. Variations in Base-Flow Nitrate Flux in a First-Order Stream and Riparian Zone. J. Am. Water Resourc. Assoc. 44(2): 367-380.
Bailey, L.D. and E.G. Beauchamp. 1973. Effects of Temperature on NO3- and NO2- Reduction,
Nitrogenous Gas Productions, and Redox Potential in a Saturate Soil. Can. J. Soil Sci. 53(2): 213-218.
Brady, N.C. and R.R. Well. 2008. The Nature and Properties of Soils. Columbus: Pearson Prentice Hall.
Bӧhlke, J.K, M.E. O’Connell, and K.L. 2007. Prestegaard. Ground water stratification and delivery of nitrate to an incised stream under varying flow conditions. J. Environ. Qual. 36(3): 664-680.
Cey, E.E., D.L. Rudolph, R. Aravena, and G. Parkan. 1999. Role of the riparian zone in controlling the distribution and fate of agricultural nitrogen near a small stream in southern Ontario. J. Contam. Hydrol. 37(1-2): 45-67.
Clément, J.C., G. Pinay, and P. Marmonier. 2002. Seasonal Dynamics of Denitrification along Topohydrosequences in Three Different Riparian Areas. J. Environ. Qual. 31:1025-
1037.
Davis, J.H., S.M. Griffith, W.R. Horwath, J.J. Steiner, and D.D. Myrold. 2007. Mitigation of Shallow Groundwater Nitrate in a Poorly Drained Riparian Area and Adjacent Cropland. J. Environ. Qual. 36(3): 638-637.
Dukes, M.D. R.O. Evans, J.W. Gilliam, S.H. Kunickis. 2002. Effect of riparian buffer
width and vegetation type on shallow ground water quality in the Middle Coastal Plain of North Carolina. Trans. ASAE. 45(2):327-336.
Evans, R.O., K.L. Bass, M.R. Burchell, R.D. Hinson, R. Johnson, and M. Doxey. 2007. Management alternatives to enhance water quality and ecological function of channelized streams and drainage canals. J. Soil and Water Conserv. 62(4):308-320.
Hefting, M. M., J. Clément, P. Bienkowski, D. Dowrick, C. Guenat, A. Butturini, S.
Topa, G.Pinay and J. T. A. Verhoeven. 2005. The role of vegetation and litter in the nitrogen dynamics of riparian buffer zones in Europe. Ecol. Eng. 24(5): 465-482.
Hill, A.R., K.J. Devito, S. Campagnolo, and K. Sanmugadas. 2000. Subsurface denitrification in a forest riparian zone: Interactions between hydrology and supplies of nitrate and organic carbon. Biogeochem. 51:193-223.
Hill, A.R., P.G.F. Vidon, and J. Langat. 2004. Denitrification potential in relation to lithology in five headwater riparian zones. J. Environ. Qual. 33(3): 911-919.
Hill, A.R. 1996. Nitrate Removal in Stream Riparian Zones. J. Environ. Qual. 25(4): 743-755.
Hunt, P.J., T.A. Matheny, and K.C. Stone. 2004. Denitrification in a Coastal Plain Zone Contiguous to Heavy Swine Loaded Wastewater Spray Field. J. Environ. Qual. 22: 2367- 2374.
Kellogg, D.Q, A.J. Gold, P.M. Groffman, K. Addy, M.H. Stolt, and G. Blazejewski. 2005. In Situ Ground Water Denitrification in Stratified, Permeable Soils Underlying Riparian Wetlands. J. Environ. Qual. 34:524-533.
Knowles, R. 1982. Denitrification. MicroBio. Rev. 46(1): 43-70.
Korom, S.F. 1992. Natural Denitrification in Saturated Zone: A Review. Water Resour. Assoc. 28(6): 1657-1668.
Lowrance, R., R. Todd, J. Fail, O. Hendrickson, R. Leonard, L. Asmussen. 1984. Riparian Forests as Nutrient Filters in Agricultural Watersheds. Bioscience. 34(6): 374-377.
Lowrance, R.R., R. Leonard, J. Sheridan. 1985. Managing riparian ecosystems to control nonpoint pollution. J. Soil and Water Conserv. 40(1): 87-91.
Lowrance, R.R. 1992. Groundwater Nitrate and Denitrification in a Coastal Plain Riparian Forest. J. Environ. Qual. 21: 401-405.
Lowrance, R.R., G. Vellidis, R.D. Wauchope, P. Gay, and D.D. Bosh. 1997. Herbicide Transport in a managed riparian buffer system. Trans. ASAE. 40(4): 1047-1057.
Mankin, K.R., D.M. Ngandu, C.J. Barden, S.L. Hutchinson, W.A. Geyer. 2007. Grass-shrub riparian buffer removal of sediment, phosphorus, and nitrogen from simulated runoff. J. Am. Water Resour. Assoc. 43(5): 1108-1116.
Mayer, P.M., S.K. Reynolds, Jr., M.D. McCutchen, T.J. Canfield. 2007. Meta-Analysis of Nitrogen Removal in Riparian Buffers. J. Environ. Qual. 36(4): 1172-1180.
Mengis, M., S.L. Schiff, M. Harris, M.C. English, R. Aravena, R.J. Elgood, A. MacLean. 1998. Multiple geochemical andisotopic approaches for assessing groundwater nitrate elimination in a riparian zone. Ground Water. 37:448-457.
NC CREP Annual Report. 2007. Conservation Research Program. Washington, NC: North Carolina Conservation Reserve Enhancement Program. Available at:
http://www.enr.state.nc.us/dswc/pages/crep_newsletters.html. Accessed 31 October 2008. NC CREP and USDA. 2008. USDA and North Carolina Expand CREP Program.
Washington, D.C.: USDA. Available at:
http://www.enr.state.nc.us/DSWC/pages/crepfactsheet.pdf. Accessed 31 October 2008. NCDWQ. 2008. Nonpoint Source Management Program: Tar-Pamlico Nutrient Strategy. Raleigh, NC: North Carolina Division of Water Quality. Available at:
http://h2o.enr.state.nc.us/nps/tarpam.htm. Accessed 31 October 2008.
NCDWQ. 2007. Nonpoint Source Management Program. Raleigh, NC: North Carolina Division of Water Quality. Available at: http://h2o.enr.state.nc.us/nps. Accessed 31 October 2008.
NCDWQ. 2002. Neuse Nutrient Strategy: Background. Raleigh, NCL North Carolina
Division of Water Quality. Available at: http://h2o.enr.state.nc.us/nps/neuse_back.htm. Accessed 31 October 2008.
NRDC. 1998. America’s Animal Factories: How States Fail to Prevent Pollution From Livestock Waste. Available at: http://www.nrdc.org/water/pollution/factor/aafinx.asp. Accessed 13 April 2009.
Osmond, D.L., J.W. Gilliam, and R.O. Evans. 2002. Riparian Buffers and Controlled Drainage to Reduce Agricultural Nonpoint Source Pollution, North Carolina Agricultural Research Service Technical Bulletin 318, North Carolina State University, Raleigh, NC.
Patrick, Wm.H, Jr. 1960. Nitrate Reduction in a Submerged Soil as Affected by Redox Potential. Trans. Seventh Inter. Cong. Soil Sci.II. 494-500.
Peterjohn, W.T., and D.L. Correll. 1984. Nutrient dynamics in an agricultural watershed: observations on the role of a riparian forest. Ecology. 65(5): 1466-1475.
Postma, D., Boesen, C., Kristiansen, H. and Larsen, F. 1991. Nitrate reduction in an unconfined aquifer: water chemistry, reduction processes, and geochemical modeling. Water Resour. Res. 27: 2027–2045.
Puckett, L.J. 2004. Hydrogeologic controls on the transport and fate of nitrate in groundwater beneath riparian buffer zones: results from thirteen studies across the United States.
Water Sci. and Technol. 49(3): 47-53.
Richardson, J.L and M.J. Vepraskas. 2001. Wetland Soils: Genesis, Hydrology, Landscapes, and Classifications. Boca Raton, FL: CRC Press LLC.
Schiff, S.L., K.J. Devito, R.J. Elgood, P.M. McCrindle, J. Spoelstra, and P. Dillon. 2002. Two adjacent forested catchments: Dramatically different NO3- export. Water Resource. Res. 38(12):
1-13.
Schultz, R.C., J.P. Colletti, T.M. Isenhart, W.W. Simpkins, C.W. Mize, M.L.
Thompson. 1995. Design and Placement of a Multispecies Riparian Buffer Strip System. Agroforest. Syst. 29(3): 201-226.
Spruill, T.B. 2004. Effectiveness of riparian buffers in controlling ground-water discharge of nitrate to streams in selected hydrogeologic settings of the North Carolina Coastal Plain. Water Sci. Technol. 49(3): 63-70.
Tabacchi, E., D. L. Correll, R. Hauer, G. Pinay, A. Planty-Tabacchi and R. C. Wissmar.
1998. Development, maintenance and role of riparian vegetation in the river landscape. Freshwater Biol. 40(3): 497-516.
USDA. Riparian Forest Buffers. Radnor, PA: Forest Service. Available at: http://www.na.fs.fed.us/spfo/pubs/n_resource/riparianforests/. Assessed 15 March 2010.
U.S. EPA. 1984. Report to Congress: Nonpoint Source Pollution in the U.S. Office of Water Program Operations. Washington, D.C.: Water Planning Division.
U.S. EPA. Nonpoint Source Pollution: The Nation’s Largest Water Quality Problem. Available at: http://www.epa.gov/nps/facts/point1.htm. Assessed 12 January 2010.
Vidon, P. G. F. and A. R. Hill. 2004. Landscape controls on the hydrology of stream riparian zones. J. Hydrol. 292(1-4): 210.
Wafer, C.C., J.B. Richards, D.L. Osmond. 2004. Construction of Platinum-Tipped Redox Probes for Determining Soil Redox Potential. J. Environ. Qual. 33:2375-2379.
Welsh, D. 1991. Riparian Forest Buffers. USDA Forest Service. Forest Resources Management.