EDUCATION
An Integrated Biochemistry and Genetics Outreach
Program Designed for Elementary School Students
Eric D. Ross, Sarah K. Lee,1Catherine A. Radebaugh, and Laurie A. Stargell2
Department of Biochemistry and Molecular Biology, Colorado State University, Fort Collins, Colorado 80523-1870
ABSTRACTExposure to genetic and biochemical experiments typically occurs late in one’s academic career. By the time students have the opportunity to select specialized courses in these areas, many have already developed negative attitudes toward the sciences. Given little or no direct experience with thefields of genetics and biochemistry, it is likely that many young people rule these out as potential areas of study or career path. To address this problem, we developed a 7-week (1 hr/week) hands-on course to introducefifth grade students to basic concepts in genetics and biochemistry. These young students performed a series of investigations (ranging from examining phenotypic variation,in vitroenzymatic assays, and yeast genetic experiments) to explore scientific reasoning through direct experimentation. Despite the challenging material, the vast majority of students successfully completed each experiment, and most students reported that the experience increased their interest in science. Additionally, the experiments within the 7-week program are easily performed by instructors with basic skills in biological sciences. As such, this program can be implemented by others motivated to achieve a broader impact by increasing the accessibility of their university and communicating to a young audience a positive impression of the sciences and the potential for science as a career.
A
S students progress from elementary school through high school, their attitudes toward science tend to become progressively more negative (Ayers and Price 1975; Simpson and Oliver 1985; Morrell and Lederman 1998; Jarvis and Pell 2002). Attitudes toward science may affect both classroom performance (Koballa and Crawley 1985; Rennie and Punch 1991; Tuan et al.2005) and the courses in which students choose to enroll (Farenga and Joyce 1998). This presents a significant challenge for recruiting students intofields such as biochemistry and genetics, where the difficult subject mat-ter means that students are traditionally not exposed to even the basic concepts of thesefields until late in their academic careers. By this point, negative attitudes toward the sciences have often solidified; consequently, many students rule out these career choices without ever having been exposed to the fields.To address this problem, we developed a curriculum that introduces very young students to basic biochemical and genetic concepts. We chose to target fifth graders, because they tend to still have a relatively positive view of the sciences (Morrell and Lederman 1998) and are old enough to perform basic biochemical experiments.
In teaching basic genetic and biochemical concepts, we focused on the following major areas: genetic variation, the function of enzymes in biological systems, the role of DNA mutation in conferring phenotypic changes, and the use of model systems. The popular press frequently discusses each of these topics, and therefore, a basic understanding of these areas promotes scientific literacy. Numerous products, ranging from detergents to shampoos, advertise that they contain enzymes, yet almost none of thefifth grade students that we worked with had even a basic understanding of the function of enzymes. Understanding the effects of DNA mutation is essential for understanding evolution. Finally, while essential to biological research, the value of model systems is not always intuitively obvious to those outside of thefield (Petsko 2011), where basic research takes a backseat to translation studies that appear to more directly affect the human condition.
Our program development focused on four goals. First, we aimed to provide a positive environment for elementary school students to interact with professional scientists. We Copyright © 2012 by the Genetics Society of America
doi: 10.1534/genetics.111.135285
Manuscript received September 30, 2011; accepted for publication November 22, 2011 Supporting information is available online at http://www.genetics.org/content/ suppl/2011/11/30/genetics.111.135285.DC1.
1Present address: Chemistry and Biochemistry, Abilene Christian University, Abilene
TX 79699.
2Corresponding author: Department of Biochemistry and Molecular Biology, Colorado
reasoned that many students do not have direct contact with scientists, and in the absence of direct interaction, student views of scientists are shaped by outside factors. These factors likely include the overwhelmingly negative and/or mislead-ing portrayals of scientists in the media and entertainment (Maugh Ii 1978; Haynes 1994; Jones 2001; Jones 2005). Second, we wanted to develop experiments that realistically reflect the scientific method, yet are simple enough that ele-mentary school students in a large classroom setting could reproducibly perform them. Third, we sought to utilize experiments that are transferrable and transportable, using reagents that are accessible to most biological scientists. Fourth, we wanted to introduce students to basic concepts in biochemistry and genetics, including the types of questions that are posed and the approaches used to address them.
To accomplish these goals, we developed a 7-week course, entitled Biochemistry Is Elementary, in which students worked through five basic biochemical and genetic experi-ments in a1-hr/week session. The vast majority of students successfully completed each experiment. Although longitudi-nal studies would be needed to determine whether this course had a lasting impact, student surveys indicated that in the short term, we were successful in accomplishing each of our goals.
Materials and Methods
Week 1: Introduction to genotype and phenotype
Required materials:Additional materials beyond the work-book were not required.
Student activity:Students record the number of individuals in the class and a description of their experimental group (e.g.,fifth grade students at Skyview Elementary School in Windsor, CO). In pairs, students record whether they have: a widow’s peak, dimples, freckles, a cleft chin, and unat-tached ear lobes. Students also record whether they can roll their tongue and whether, when they clasp their hands to-gether, their left or right thumb is on top of the other and held closest to their body. Data from the entire class are assembled to determine the fraction of students with the dominant trait.
Week 2: Enzymes as builders or breakers
Required materials:The following materials are required per group of two to three students: two 1.7-ml microcentrifuge tubes; three 15-ml screw cap conical tubes, four solution droppers,five glucose test strips (Bayer Diastix no. 2803), two lactase tablets (Fast Act, Vanilla twistflavor 9000 FCC units per tablet), 6 ml water, 1 ml 2% (w/v) glucose in water, 10 ml milk, labeling markers, tube racks, and paper towels as needed.
Student activity: Students first test positive and negative control samples. Working in groups of two to three, students label two microcentrifuge tubes 1 and 2. Each group then transfers approximately 1 ml of water and glucose solution
to tubes 1 and 2, respectively. Each student records the tube number and its contents in a results table. Students then dip a glucose test strip into tube 1 and quickly remove it after the test square becomes wet. The test strip is placed on a paper towel for 1 min. Then the color of the test square is recorded in the results table. This process is repeated for tube 2.
Students then label three 15-ml tubes 3, 4, and 5 and mark the 5-ml line on each tube. Students transfer 5 ml of milk to tubes 3 and 4 and 5 ml of water to tube 5. Students record the tube number and contents in their results table. Students add half of an enzyme tablet each to tubes 4 and 5, cap the tubes tightly, and mix all three tubes by inverting for 5 min. Students then dip a glucose test strip into tube 3, quickly remove it after the test square becomes wet, and place it on a paper towel for 1 min. Then, they record the color of the test square in the results table. This process is repeated for tubes 4 and 5.
Week 3: Salivary amylase
Required materials:Each student requires4 ml of starch solution,1 ml of iodine solution,4 ml of distilled water, six 1.7-ml microcentrifuge tubes, 1 solution dropper, and 1 petri dish top or bottom. Extra solution droppers are needed to dispense the starch solution, iodine solution, and distilled water. Labeling markers, paper towels, and tube racks are also needed.
Starch solution is prepared by adding 10 g of soluble starch (JT Baker, Cat. no. JT4006-4) to 1 liter water (tap or distilled). The mixture is heated with constant stirring until boiling. The mixture is then removed from heat, placed on a cool stir plate, and stirred until the solution has cooled to room temperature. The solution is stored in a 1-liter bottle. To prepare 500 ml of iodine solution, 10 g of potassium iodide (JT Baker, Cat. no. JT3168-4) are added to 480 ml distilled water and stirred until completely dissolved. Two g of iodine crystals (JT Baker, Cat. no. JT2211-0) and enough distilled water to bring the total volume to 500 ml are then added. The solution is stirred until the iodine crystals are completely dissolved. The iodine solution is stored in a brown bottle in the dark, as the solution breaks down in the light. (Iodine solution stored in the dark can be used for at least 2 years.) The iodine solution is diluted 1:4 prior to use.
Student activity:Students work in groups of four tofive to share reagents, but each student completes the experiment individually. Students then compare their results to those obtained by the other students in their group.
saliva to tube 4 using a clean dropper. Students record the tube number and its contents in their results table. Students then add 2 drops of iodine solution to tubes 3 and 4, close the tubes, mix both tubes by gently inverting the tubes for 1 min, and record thefinal color of the liquid in each tube. To ensure accuracy and introduce the importance of reproducibility, students repeat the assay using tubes 5 and 6.
Week 4: Using yeast to study enzyme defects (part 1)
Required materials:The following materials are needed per student: three yeast agar plates, three sterile cotton tipped applicator packs, one paper towel, one white tube containing sterile distilled water, one blue tube containing wild type yeast, one yellow tube containing mutant yeast, and one pair of gloves. The following materials are required for each group of four tofive students: two labeling markers, two tube racks, one roll of tape, and one zip-lock waste bag (1-gall size). One plastic container to serve as an incubator is also required per class.
To prepare dilute yeast (wild-type and mutant) solutions, BY4741 (wild-type yeast) and BY4741ade2Δ(mutant yeast) cells are streaked from glycerol stocks onto YPD plates. Plates are incubated at 30for 2 days, and then stored at 4. Two days prior to use, one colony each from the wild-type and mutant yeast streaks is used to inoculate 5-ml cultures of sterile YPD medium (10 g yeast extract, 20 g bacto peptone, and 20 g glucose in 1 liter of distilled water). Cultures are incubated overnight at 30with agitation. The next day, the O.D.600of each culture is determined. Cultures are diluted to
an O.D.600of 1 and then four 10-fold serial dilutions are
pre-pared in distilled water so that thefinal concentration is equiv-alent to an O.D.600of 1024. One-milliliter aliquots of the dilute
(1024) wild-type or mutant cells are transferred to sterile blue
or yellow microcentrifuge tubes, respectively. The dilute cells can be used immediately or stored overnight at 4prior to use.
Yeast agar plates are prepared as follows: In a 2-literflask, 20 g glucose, 5 g yeast extract, and 20 g bacto peptone are dissolved in 1 liter of distilled water. (To ensure an obvious red phenotype for the mutant cells, the amount of yeast extract is reduced in these plates from the standard YPD recipe.) Twenty grams of agar is added. The mixture is autoclaved for 40 min and swirled to mix. The solution is allowed to cool to approximately 50and then 30–35 ml per plate is poured into 100·15 mm petri dishes. The plates are allowed to sit over-night at room temperature and then stored at 4. These plates are marked with a black stripe on one side of the lid.
Student activity:Students work in groups of four to five to share reagents, but each student completes the experiment individually. Students then compare their results to those obtained by the other students in their group.
Students label the bottom of three agar plates with the numbers 1, 2, 3, and their initials. Wearing gloves, students pick up the white tube (containing sterile water) and invert it 10 times. Students open a sterile applicator package approx-imately 1 in. and set it down on their paper towel. Students open the white tube, remove the sterile applicator from its
package, and dip the applicator into the tube as far as it will go. They then remove the applicator from the tube and touch it to the center of the plate labeled 1. Students use the applicator to spread the liquid around the plate and then discard the applicator into a waste bag. Plate 1 is set aside to allow the liquid to soak into the agar. The same technique is then used to spread liquid from the blue (wild type) and yellow (mutant) tubes onto plates 2 and 3, respectively, using a new applicator each time. In a results table, students record the plate number and the liquid that was spread on it. When all of the plates are dry, students tape the lids to the bottoms on two sides and put them into the plastic incubator. After 3–4 days, students record the growth phenotypes in a results table and draw a picture of each plate. This process is then repeated after another 3–4 days.
Week 5: Using yeast to study enzyme defects (part 2)
Week 5 is used to examine the results of the week 4 ex-periment. Instructors discuss the results of the experiments and encourage the students to hypothesize about the basis for the observed phenotypes. Instructors photograph the plates with a digital camera and print a picture of each student’s plates. To maximize the visibility of the colonies, plates should be photo-graphed bottom-side up on a dark surface. To identify the plates, a strip of white paper with the student’s name should be included in each photograph. All yeast plates are removed from the classroom for autoclaving and proper disposal.
Week 6: Using yeast to study enzyme defects (part 3)
Required materials:The following materials are required per student: one yeast agar plate (black stripe), one yeast agar plate plus extra glucose (green stripe), one yeast agar plate plus extra protein (blue stripe), one yeast agar plate plus extra DNA components (purple stripe), one paper towel, four sterile cotton tipped applicator packs, one pair of gloves, one labeling template (Supporting Information, Figure S1), one experi-mental template (Figure S2), and one master template (Figure S3). The following are required per two students: one labeling marker and one master plate with wild type and mutant yeast cells. The following are required per four tofive students: one waste bag and one roll of tape. One plastic container to serve as an incubator is also required per class.
A yeast master plate contains100 single colonies of wild-type and mutant cells on two halves of a single plate. To pre-pare these plates, cultures are grown overnight and diluted to an O.D.600, 1024as described above. Using an applicator
sat-urated with this suspension (similar to the technique that the students used in week 4), the instructor spreads dilute (1024)
wild-type and mutant cells onto a single yeast agar plate (di-vided in half). When the plates are dry, they are placed in an incubator at 30for 2 days. The plates may be used immedi-ately or stored at 4.
contain 50 mg of adenine hemisulfate per liter. These plates are marked with a purple stripe on one side of the lid.
To further distinguish the yeast agar plates with extra components, food coloring (yellow, blue, or green) may be added to the plates prior to autoclaving. Red food coloring should be avoided, as it will decrease the contrast between the white and red yeast colonies.
Student activity:Students work in groups of four tofive to share reagents, but each student completes the experiment individually.
Students label the bottom of each plate by (a) placing the plate on the labeling template bottom side up, (b) tracing the line down the middle of the plate, (c) numbering the plate in the top left part (1 for yeast agar, 2 for the plate with extra sugar, 3 for the plate with extra protein, and 4 for the plate with extra DNA components), (d) labeling the left side of the plate“mut”for mutant, (e) labeling the right side of the plate“wt”for wild type, (f) writing their initials on the bottom of the plate, and (g) drawing a big black dot on the top right part of the plate.
After putting on a pair of gloves, students place plates 1 and 2 onto their experimental template with the lids facing up and line up the black dots on the plates with the dots on the template. Students place the master plate with wild-type and mutant yeast cells on the master template with the lid facing up. Using a sterile applicator, students pick up one wild-type (white) colony from the master plate and spread the yeast cells onto the wild-type side of the plate by zigzagging across the plate. The same applicator is then used to pick another wild-type (white) colony and spread it onto the wild-type side of plate 2. The applicator is then discarded into a waste bag. Using a sterile applicator, students pick up one mutant (red) colony from the master plate and spread the yeast cells onto the mutant side of plate 1. The same applicator is then used to pick another mutant (red) colony and spread it onto the mutant side of plate 2. The applicator is then discarded into a waste bag. Students then set plates 1 and 2 aside and repeat this process for plates 3 and 4. For all four plates, students tape the lid to the bottom on two sides and then place them in the plastic incubator. After 2–3 days, students record their results in a results table and draw a picture of each plate. This process is then repeated after another 2–3 days.
Week 7: Using yeast to study enzyme defects (part 4)
Week 7 is used to examine the results of the week 6 experiment and discuss the significance of these results. All yeast plates are removed from the classroom for autoclaving and proper disposal.
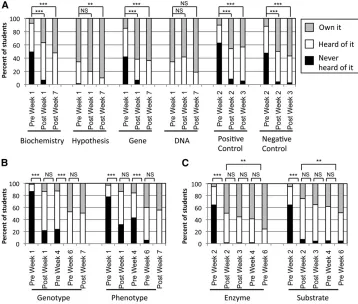
Student surveys were used to assess improvements in vocabulary (see Supporting Information for complete course surveys). In the surveys, students were asked to indicate for a given word whether they“owned it,”meaning that they felt comfortable defining and using the word; had “heard of it,” meaning that were familiar with the word, but could not pre-cisely define it; or “never heard of it.”The meaning of each
category was reiterated before the first survey. Statistical sig-nificance of changes in the fraction of students who owned a given word was evaluated using Fisher’s exact test. When analyzing differences in distribution among all three catego-ries, the Freeman–Halton extension of Fisher’s exact test for 2·3 tables was used (Freeman and Halton 1951).
Results
Course structure and metrics
The course was designed as a series of seven 1-hr classes (Table 1). During each of the first 3 weeks, students per-formed a single stand-alone experiment. During the final 4 weeks, students performed two separate 2-week experiments. Students were provided a workbook outlining a basic ques-tion (see File S1 for the workbook for weeks 4 and 5; the complete workbook for all 7 weeks is available upon request). We discussed the concepts that underlie the question; the students collectively developed a hypothesis, which they en-tered into their book. Basic biochemical and genetic experi-ments were then conducted to address the hypothesis. The workbooks included the detailed protocol for the experiment, as well as cues for where to note experimental results.
The course was offered at Skyview Elementary, a Title I public school in Windsor, Colorado. Here we discuss the results from the three fifth grade classes (74 students, 37 females, 37 males) that participated in the complete course. Each class had 24–25 students, and one professor and one graduate student were assigned to each class. Because the same professor and graduate student stayed with each class for the duration of the course, the three classrooms serve as three independent replicates for evaluating the effectiveness of the course.
Since the course included challenging vocabulary, it was important to provide students a forum in which to express whether the concepts were being clearly explained. There-fore, before and after most classes, students were given assessments. Since a major goal of this project was to make the science enjoyable for the students, we did not want to introduce onerous testing. Indeed, the teachers specifically requested that any assessments have the feel of surveys rather than tests and that assessments be limited in length. Thus, surveys that consisted largely of self-reporting were given, focusing predominantly on vocabulary (seeSupporting Information for complete course surveys). The teachers sug-gested using a template that was already frequently used in these classrooms, in which students were asked to classify words into one of three categories:“never heard it,” “heard it,”or“own it”(indicating that the student is fully comfort-able defining and using the word). Because of the obvious limits of self-reporting, a few questions were included in the surveys to objectively test knowledge of key concepts.
Week 1: Introduction to genotype and phenotype
what the job of a research scientist entails—essentially, iden-tifying a question with an unknown answer and working to find the answer. Next, we discussed the four basic steps in the scientific method: (i) identify a question, (ii) develop a hy-pothesis, (iii) perform experiments with which to test the hypothesis, and (iv) if necessary, revise the hypothesis and try again.
We designed the activity for week 1 to reinforce these ideas, while introducing the concept that differences in many observ-able characteristics among the students can be explained by differences in genes. Our question for the week was,“Why are some traits more common than others?”To facilitate the de-velopment of a hypothesis, we explained the concept of dom-inant and recessive traits, using eye color as an example. Predictably, the students hypothesized that dominant traits will be more common than recessive traits. In pairs, the students then determined their phenotype for a range of characteristics (Table 2). Upon assembling the data for the class, in many cases the recessive trait was more common, disproving our hypothesis.
We finished the class by discussing theories about why some traits are more common than other traits. With some guidance, the students pointed out that certain physical traits are more common in people from some parts of the world and suggested that perhaps these traits might be beneficial in those specific climates. In fact, it is unclear for the specific traits discussed whether their regional distribu-tion is a result of genetic drift or due to a specific selective advantage. Nevertheless, this dialogue allowed students to reason their way toward a process that underlies evolution, even though evolution was not explicitly discussed.
Week 2: Enzymes as builders and breakers
In week 2, we conducted ourfirst biochemical experiment, in which we examined the basis for lactose intolerance. We started by discussing the expression,“you are what you eat,” and asked students why they do not resemble the foods that they eat. We then introduced enzymes as the“builders and breakers”in our body and explained that different enzymes are responsible for breaking down or assembling chemical complexes. We introduced the generic mechanism for an enzymatic reaction as
Substrate þ Enzyme / Product þ Enzyme: The digestion of lactose was used as a paradigm by which to demonstrate the mechanism of enzymes. Lactose intoler-ance results from a lack of the lactase enzyme (Järveläet al.
2009). Lactase catalyzes the hydrolysis of lactose in the fol-lowing reaction:
Lactose þ Lactase / Glucose þ Galactose þ Lactase: Therefore, the question for the class was, “Will adding the lactase enzyme to milk cause the breakdown of lactose?”Our hypothesis was,“If we add the lactase enzyme to milk, then we will detect glucose.”Thus, we proposed treating milk with lactase and using glucose test strips to monitor the formation of glucose. Before conducting the experiments, we asked two questions to introduce the concept of negative and positive controls. First, how do we know that glucose is not already present in milk or that some other chemical in milk could not result in a false positive? Second, how do we know what a positive result for the presence of glucose will look like? To address these questions, milk without enzyme and a glu-cose solution were tested as controls. For the actual experi-ment, students added lactase to milk and mixed the tube by inversion for 2 min. As a control to ensure that the handling of the milk did not result in glucose formation, an identical sample was prepared without enzyme. Both samples were then tested using glucose test strips. All students got the same result: the addition of lactase resulted in glucose formation. Table 1 Program statistical analyses by experimental weeks
Week(s) Activity Key concepts Success rate(%)a experiment (%)Favorite b
1 Examining differences in phenotypes
among the students
Phenotypevs.genotype, dominant and recessive, hypotheses
100 8.7
2 Studying lactose hydrolysis Enzymes, positive control, negative
control, mutations
100 15.9
3 Testing for salivary amylase activity Enzymes, mutations 95c 20.3
4–5 Using yeast to study defects in theADE2gene Model organisms, enzymes, mutations 100 24.6
6–7 “Curing”cells of theade2Δphenotype Model organisms, enzymes, mutations 95d 27.5
aPercentage of students who successfully completed the experiment and got the expected result. bPercentage of students who indicated on thefinal survey that this was their favorite experiment. cPercentage of students who got the same result for their two independent replicates. dUnexpected results were due to either incorrect labeling or failure to apply the yeast strain.
Table 2 Phenotypes examined in Week 1
Trait Dominant or recessive
Widow’s peak Dominant
Dimples Dominant
Freckles Dominant
Cleft chin Recessive
Hand folding: left over righta Dominant
Tongue rollingb Dominant
Attached ear lobes Recessive
aWhen a person clasps their two hands together (without interlockingfingers),
most people will always clasp their hands with the same thumb nearest to their body. Folding one’s hands with the left thumb toward the body is dominant.
bAlthough being born with the ability to roll one’s tongue seems to be genetic, this
We then discussed the implications of these experiments. We explained to the students that most mammals have reduced expression of lactase in adulthood because they no longer need the enzyme. Thus, the ability to digest lactose after weaning is actually the result of a mutation (Järvelä et al.
2009), demonstrating the important point that mutations can confer a benefit (it was not hard to convince students that the ability to eat ice cream and pizza is a benefit). We discussed how understanding the basis for lactose intolerance allows scientists to develop treatments for people with this condition. When asked how they would treat lactose intolerance, stu-dents suggested some of the currently used methods, including removing lactose from milk and ingesting lactase enzyme when eating dairy products.
Week 3: Salivary amylase
To reinforce the concept of enzymes, in the third week we examined another enzyme whose activity varies among people, the human salivary amylase enzyme. Salivary amy-lase hydrolyzesa-1,4-glucan bonds in starch. This enzyme is found in saliva and starts the process of digestion of starchy foods. Within the human population, there are variations in the number of amylase gene copies present. Indeed, in terms of copy-number variation, the amylase locus is one of the most variable in the human genome (Iafrate et al. 2004). The result of copy-number variation is very different amylase protein levels between individuals (Perry et al. 2007). Fur-thermore, certain mutations in the human salivary amylase enzyme result in decreased starch hydrolysis (Ramasubbu
et al.2004; Ragunathet al.2008).
The variability in amylase activity can be monitored using an assay that detects the presence of starch, the substrate for amylase. When iodine is mixed with starch, the resulting solution is bright blue. When active amylase from human saliva is present in the mixture, the starch is broken down, resulting in a brown color. If the saliva contains low levels of amylase, or if mutations are present in the enzyme that result in a less effective amylase, the starch is not broken down, resulting in a blue color. This colorimetric assay allows students to easily test for the activity of amylase in their own saliva.
To encourage the concept of reproduction of results, each student performed the amylase assay two times. We found the students were able to reproduce their own results in 95% of the cases. The failures were most likely due to not adding enough saliva to the tube. This provides the opportunity for discussing the importance of repetition in biological experi-ments. The power of this experiment is that it reinforces the concept that enzymes are present in our own bodies, which was introduced in week 2 (the lactase experiment) and that people have variation (week 1).
Weeks 4–7: Using yeast to study enzyme defects
The fourth week of class started with the question, “if you identify an enzyme mutation that causes disease in humans, how would you determine the function of the enzyme and basis for disease?”In discussing this question, students very
quickly realized the challenges of researching on human sub-jects. In all classes, students suggested using other organisms to study the disease (usually they suggested mice). At this point, we discussed the significant genetic similarity among eukaryotes and the advantages of utilizing simple model organisms to study diseases.
In weeks 4–7, we conducted two experiments to highlight the value of model systems for studying human disease. The experiments centered on the yeastADE2gene.Ade2has pre-viously been used as the focus for other project-oriented lab courses, albeit for much more senior students (Aronson and Silveira 2009). The Ade2 protein provides a convenient model, both because of its well-studied nature and because simple-selective and nonselective assays exist to monitor its activity.Ade2is a phosphoribosylaminoimidazole carboxylase involved in the highly conservedde novopurine biosynthesis pathway (Smirnovet al.1967; Silver and Eaton 1969). Yeast cells lacking the Ade2 enzyme are unable to grow in the absence of adenine; in the presence of limiting adenine, cells lackingAde2activity turn red due to accumulation of a prod-uct derived from the substrate ofAde2(Smirnovet al.1967; Silver and Eaton 1969).
In humans, the bifunctional enzyme PAICS performs the function of the yeastAde2enzyme, as well as that ofAde1, the enzyme responsible for the subsequent step in adenine biosynthesis (Minet and Lacroute 1990; Schildet al.1990). PAICS is highly conserved in higher eukaryotes, and muta-tions in PAICS can result in developmental defects and in some cases embryonic lethality (Tionget al.1989; Nget al.
2009). Additionally, because cancer cells rely heavily on the
de novopurine biosynthesis pathway while normal cells pref-erentially utilize salvage pathways (Li et al. 2007), PAICS has emerged as a potential target for anticancer drugs.
Therefore, we told the students that an enzyme that is important in both development and cancer had been identi-fied. We explained that a similar gene had been identified in yeast and that we were going to try to use yeast to determine the function of the enzyme. Thefirst step, and the goal for weeks 4 and 5, was to determine whether mutations inADE2 confer a phenotype in yeast. The students hypothesized that deletion ofADE2would make the cells sick or dead, resulting in a detectable phenotype.
To practice sterile technique, and as a negative control, each student first streaked water onto a YPD plate using a sterile applicator. The students then streaked the wild-type andade2Δ deletion strains onto YPD plates. The plates were incubated in each classroom at room temperature in a large plastic con-tainer for 1 week. Because YPD contains limiting amounts of adenine, the ade2Δmutant cells appear red, while wild-type cells appear white.
the classrooms. This likely resulted from subtle temperature differences among the rooms, which can result in disparate yeast growth rates and consequently, differences in colony color.
Students then brainstormed possible causes of the red color phenotype observed in the mutant strain. In each class, the students proposed that the red phenotype in theade2Δstrain was due to a failure to make some essential nutrient. This theory is not exactly correct, as the color is actually due to build-up of the substrate ofade2Δ, not absence of the product. Nevertheless, the theory provided a simple testable hypothe-sis. The students hypothesized that if the medium was supple-mented with the product that Ade2 generates, the ade2Δ strain would be“cured”of its red phenotype. Therefore, stu-dents proposed different supplements that could be added to the medium. Student suggestions included extra sugar, pro-tein, fats, DNA components, agar, and vitamins.
In week 6, we tested some of these supplements. YPD plates were prepared with extra sugar (4% glucose as opposed to 2%), protein (3% peptone as opposed to 2%), or DNA components (50 mg adenine hemisulfate/liter). Each student streaked wild-type andade2Δstrains side-by-side on each medium. As a control to ensure that the color difference was reproducible, both strains were also streaked onto standard YPD. Plates were again incubated for 1 week at room temperature.
In week 7, we analyzed the results. Although a small fraction of the plates were again contaminated, all students observed that the ade2Δmutant strain grew white on me-dium supplemented with excess DNA components. However, the mutant strain grew red on the other media (Figure 2 and Figure S5). Therefore, the students correctly theorized that the ade2Δ strain could be “cured” of its red phenotype by supplementing the normal growth medium and discovered that only DNA components could cure the phenotype. This suggests that theAde2enzyme is responsible for synthesizing DNA components. On the basis of their results, the students then proposed possible treatments for defects in the ade2Δ gene. Students suggested dietary supplements, introducing a good copy of the gene back into cells, and enzyme
replace-ment therapy. We then discussed how each of these methods has been used successfully for various diseases.
Assessing effectiveness of the course
Pre- and post-course surveys were used to give students a forum to provide feedback and to evaluate our effective-ness in each of the four major goals of the course. Thefirst goal was to provide students the opportunity to interact with professional scientists. In pre-course surveys, only 21% of students said that they knew any scientists; 45% said that they did not know any scientists, while an additional 34% said that they were not sure. These numbers highlight the importance of giving students a forum in which to interact with professional scientists.
The second goal of the course was to develop realistic biochemical and genetic experiments that could be easily reproduced by elementary students. Therefore, we designed each experiment to follow the key steps of the scientific method, including the use of controls. The high success rate of each experiment (Table 1) clearly demonstrates that these experiments were easily reproducible by elementary school students, even in a large classroom setting.
The third goal was to utilize reagents that would be easily accessible to most biological scientists. The reagents for these experiments are relatively inexpensive and the only equipment required for these experiments is an autoclave for sterilizing yeast growth medium, tubes, and pipette tips, Figure 1 Theade2Dstrain produces red colonies when grown on YPD.
(A) Wild-type and (B)ade2Dcells were diluted to 1024and spread on YPD
plates. The plates were incubated at room temperature for 7 days and then photographed.
basic lab glassware, and a plastic container for incubating the yeast plates. Therefore, almost any biological scientist would be able to replicate these experiments at modest cost. Thefinal goal was to teach basic biochemical and genetic concepts, focusing on the function of enzymes, the role of mutation in creating phenotypic variation, and the use of model systems. Therefore, the surveys included questions assessing each of these areas. As previously discussed, self-reporting was used throughout the course to allow students the opportunity to provide feedback about their level of understanding of vocabulary. This also provided us informa-tion about how student confidence with vocabulary changed during the course: their confidence with key terminology significantly increased over the course of the program (Figure 3A andTable S1).
An obvious concern is whether students accurately self-report. Three results from the surveys give us confidence that student self-reporting is reasonably accurate. First, we in-cluded“genotype”and“phenotype”on the survey even dur-ing some weeks when these words were not mentioned in class. While self-reporting scores increased significantly dur-ing weeks when these words were discussed (weeks 1 and 4– 5), no significant improvement was seen during weeks when these terms were not discussed (weeks 2, 3, 6, and 7; Figure 3B). This indicates that the students did not simply reflexively claim greater understanding over time. By contrast, relative understanding of the terms“enzyme”and“substrate,”which were mentioned in every class after week 1, showed contin-ual improvement (Figure 3C), although the individcontin-ual week-to-week changes were not statistically significant.
Second, when asked to provide written definitions, most of the students who claimed to “own”a vocabulary word were able to successfully define it. For example, in the sur-vey following week 2, 50% of the students claimed to“own” the word “enzyme”(Figure 3C). When those students who claimed to own enzyme were then asked to define the word, more than half (53%) provided a definition consistent with what we had taught them—i.e., that enzymes are responsi-ble for building up and breaking down molecules. Another 22% gave a partially accurate definition; most of these gave a definition that was specific for lactase (for example, “an enzyme turns lactose into glucose”). Thus, 75% of the stu-dents who claimed to“own”the word“enzyme”were able to give a fully or partially accurate definition.
Third, we were concerned that, rather than separately considering each word, students might simply place every word into the same category. To address this, we analyzed the correlations between answers for week 2; this week was chosen because the pre-class survey showed the most equal mix of“never heard of it,” “heard of it,”and“own it.”For each word in the pre- and post-class surveys, we compared each student’s response to his or her response for“enzyme”(the primary topic of week 2). In the pre-class survey, there was no significant correlation (P.0.1 using Fisher’s exact test with the Freeman–Halton extension for 2·3 tables; Freeman and Halton 1951) between how students categorized “enzyme”
and how they categorized any of the other seven words ( Fig-ure S6A). This indicates that students really do independently consider each vocabulary word. Intriguingly, we expected that some students would be predisposed to score their knowledge higher due to differences in confidence; however, these results suggest that any such differences are modest. In the post-class surveys, there were statistically significant correlations be-tween how students self-scored their knowledge of“enzyme” and how they scored each of the other words except “milk” (Figure S6B). This is to be expected, as there are likely differ-ences in the rate at which students learn new vocabulary. Furthermore, even among students who self-scored identi-cally for“enzyme,”there still were substantial differences in how they self-scored for each of the other vocabulary words (Figure S6B), suggesting that students consider each word independently. For example, among students who owned the word enzyme, a minority owned “substrate,”while more than 90% owned“product,” “milk,”and“lactose intolerance.” Collectively, these results support the utility of self-reporting. Nevertheless, because of the limits of self-reporting, a few additional objective questions were included to measure progress in key areas. Although less than 10% of the students reported owning the term“model organism”(i.e., felt that they could define and use the term) before the class (Table S1), after thefinal class a significant fraction of the students (55%) were able to write a definition for the term. Students provided answers such as,“Something other than a human that can be teasted [sic] to learn something about a human,” “Yeast is a model organism beaucause [sic] it is easier to work with than humans,”and“An object that takes the place of a human to experiment on.” Likewise, after week 5, 66% of the class successfully filled in the blanks in the following equation describing a generic enzymatic reaction:
þ / þ :
By week 7, 91% answered this question correctly. This improvement is not a result of direct instructor feedback on incorrect answers; because we did not want the students to feel like they were being tested, the corrected surveys were not returned to the students and the results of surveys were not discussed with either the teachers or the students. Therefore, this ongoing improvement in the objective ability to write the equation for an enzymatic reaction, along with the improvement in self-reported understanding of the definition of enzyme (Figure 3C), highlights the value of having multiple activities reinforce a given concept.
Discussion
high success rates for each of the experiments (Table 1) and the enthusiastic reviews of the class clearly demonstrate that we accomplished this goal. When students were asked“Do you have any suggestions for us?”at the completion of the course, the majority of responses were simply “no.” More elaborate comments were generally positive and enthusias-tic. Such comments included,“No I think all is perfect,” “No it was really fun,” “No. You did everything right,” “No, well just keep being great!”, and“No I think that you should do all the things you did this year.”Indeed, none of the students offered any substantial criticism (seeTable S2for a complete list of student comments); and a common“complaint”was that students wished we had more time with them (some suggestions from thefinal evaluations included,“come earlier so have you [sic] longer” and “come with us to middle school”). When asked in thefinal course survey whether they had“fun doing experiments with us,”65 out of 66 students answered“yes,”none of the students answered“no,”and 1 student answered“not sure.”Additionally, in thefinal survey, students were asked whether the experiments made them “more interested in science,” “less interested in science,”or “not sure.”Sixty-two percent of students said that the expe-rience made them more interested in science, while only 1% said that the experiments made them less interested.
In our experience, the biggest challenge in performing experiments with elementary school students is that they are eager to jump into the experiments, so sometimes they struggl to listen to detailed instructions. We used a number of specific techniques to combat this problem. First, we had
students read written instructions out loud, which was much more effective than having each student silently read through the instructions. We generally waited to hand out reagents until we had read through the instructions. For the more complicated experiments, we handed out reagents incremen-tally, which prevented the students from moving ahead with the experiments. Finally, for complicated procedures, students took turns reading each step out loud, and then the teachers demonstrated each step. We found the students were more attentive when the teacher was performing the experiment; therefore, this provided a captive audience for us to explain the challenges of each step.
One strength of the course is that, with the exception of the last few class periods, each class can function as an independent module. Therefore, contraction of the class tofit a shorter timeline would be a simple task. For example, weeks 2 and 3 are conceptually redundant, in that both demonstrate the role of enzymes. Thus, if time were limiting, sessions could be eliminated. Additionally, there are easy ways to expand the class. For example, it would be simple to add an additional yeast genetics section. At the end of the final class, students hypothesized thatAde2must be involved in synthesis of DNA components. One additional experiment that would have supported this hypothesis would be to test the effects of excluding DNA components from the growth medium. Whenade2Δmutant strains are cultured in the ab-sence of adenine, they do not grow, supporting the hypothesis thatAde2is involved in synthesis of DNA components (spe-cifically adenine).
Interestingly, the yeast experiments were the most popular among the students, with 57% of the students rating one of the two yeast experiments as their favorite (Table 1). By contrast, the observation of phenotypes was rated as the fa-vorite of only 8.7% of students. This was somewhat surpris-ing, as the yeast experiments were the most technically challenging, while the phenotype observation was the sim-plest. This may in part be because the yeast experiments were freshest in students’ minds when they filled out the final survey. Nevertheless, it highlights the fact that students at this age are not afraid of a challenge.
One question in setting up the course was the best way to evaluate student progress. As previously discussed, because a major goal of the class was to provide students with an enjoyable scientific experience, we did not want to introduce onerous testing. Ideally, students would be objectively tested on every vocabulary word every week; however, this was not possible, as we were limited in the number of questions that could be asked each week due to time constraints, and it was specifically requested that the assessments not have the feel of tests. Thus, we worked extensively with the teachers to develop assessments that balanced the need for useful feedback with our desire to provide an enjoyable experience. Although there are well-established limits to the extent to which self-reporting can be used to objectively evaluate students (Cook and Campbell 1979), two factors made us comfortable in our decision to utilize self-reporting. First, the teachers had used this self-reporting system previously and felt that the students tended to accurately self-report. The few objective questions that we inserted into the surveys sup-ported this observation. Second, conveying didactic informa-tion represented a very small goal of the course. Realistically, it is unlikely that a few years from now the students will re-member the scientific vocabulary that they learned during the course; however, we hope that their positive experiences with science and with scientists will have a lasting impact. As confidence with science may affect selection of scientific clas-ses (Farenga and Joyce 1998), future attitudes toward science (Talton and Simpson 1986; George 2000), and scientific achievement (Oliver and Simpson 1988; Shrigley 1990; Osborneet al.2003; Hillet al.2010), the students’perceived understanding of the vocabulary may be as important as their true level of understanding.
As we did not want to create controversy that might compromise our core mission, we chose not to directly address the topic of evolution. Instead, our experiments demonstrated many of the key concepts that underlie evolution, including: (i) the idea that genetics can explain many of the visible differences among people, (ii) the fact that many genetic characteristics are regionally specific, (iii) the idea that mutations can be beneficial, and (iv) the fact that even very simple organisms like yeast are highly genetically similar to humans. Our hope is that these key concepts will lay the groundwork for future understanding of evolution presented in upper-level science classes.
In sum, teaching the Biochemistry Is Elementary course provided elementary students with a positive and challeng-ing environment in which to experience biochemistry and geneticsfirst hand. We believe the value of this course lies in its ability to engage students in science at a young age, which may help cultivate a life-long interest in science.
Acknowledgments
We thank Skyview Elementary for hosting this program and thefifth grade teachers—Teri Romshek, Amy Nicholl, Amy Sassano, and Nona Winder—for their help in establishing this program. We also thank the graduate student and post-docs who assisted in development and implementation of this program: Keely Sudhoff, Kristopher Hite, Troy Sorensen, Courtney Croke, Lynsie Sundin, Sarah Hobdey, Kyle MacLea, Whitney Luebben, Lindsey Long, Marie Yearling, Sheena D’Arcy, Aaron Nelson, and Kristi Barker. Finally, we thank Professor Alan Wheals for the scanning electron micrograph of yeast cells shown in Workbook 4. This work was supported by a National Science Foundation grant (MCB-0843073) to L. A.S. and a National Science Foundation grant (MCB-1023771) to E.D.R., as well as by a generous gift to Colorado State University from the Tsao family.
Literature Cited
Aronson, B. D., and L. A. Silveira, 2009 From genes to proteins to behavior: a laboratory project that enhances student under-standing in cell and molecular biology. CBE Life Sci. Educ. 8: 291–308.
Ayers, J. B., and C. O. Price, 1975 Children’s attitudes toward science. Sch. Sci. Math. 75: 311–318.
Cook, T. D., and D. T. Campbell, 1979 Quasi-experimentation: De-sign and Analysis Issues. Houghton Mifflin, Boston.
Farenga, S. J., and B. A. Joyce, 1998 Science-related attitudes and science course selection: a study of high-ability boys and girls. Roeper Rev. 20: 247–251.
Freeman, G. H., and J. H. Halton, 1951 Note on exact treatment of contingency, goodness of fit and other problems of signifi -cance. Biometrika 38: 141–149.
George, R., 2000 Measuring change in students’attitudes toward science over time: an application of latent variable growth mod-eling. J. Sci. Educ. Technol. 9: 213–225.
Haynes, R. D., 1994 From Faust to Strangelove: Representations of the Scientist in Western Literature. Johns Hopkins University Press, Baltimore, MD.
Hill, C., C. Corbett, and A. St. Rose, 2010 Why So Few?, Women in Science, Technology, Engineering, and Mathematics. American Association of University Women, Washington, DC.
Iafrate, A. J., L. Feuk, M. N. Rivera, M. L. Listewnik, P. K. Donahoe
et al., 2004 Detection of large-scale variation in the human genome. Nat. Genet. 36: 949–951.
Järvelä, I., S. Torniainen, and K. Kolho, 2009 Molecular genetics of human lactase deficiencies. Ann. Med. 41: 568–575. Jarvis, T., and A. Pell, 2002 Changes in primary boys’and girls’
attitudes to school and science during a two-year science in-service programme. Curric. J. 13: 43–69.
Jones, R. A., 2005 ”How many female scientists do you know?” Endeavour 29: 84–88.
Koballa, T. R., and F. E. Crawley, 1985 The influence of attitude on science teaching and learning. Sch. Sci. Math. 85: 222–232. Li, S. X., Y. P. Tong, X. C. Xie, Q. H. Wang, H. N. Zhou et al., 2007 Octameric structure of the human bifunctional enzyme PAICS in purine biosynthesis. J. Mol. Biol. 366: 1603–1614. Maugh, II, T. H., 1978 Speaking of science: the media: the image
of the scientist is bad. Science 200: 37.
Minet, M., and F. Lacroute, 1990 Cloning and sequencing of a hu-man cDNA coding for a multifunctional polypeptide of the pu-rine pathway by complementation of the ade2–101 mutant in
Saccharomyces cerevisiae. Curr. Genet. 18: 287–291.
Morrell, P. D., and N. G. Lederman, 1998 Student’s attitudes to-ward school and classroom science: Are they independent phe-nomena? Sch. Sci. Math. 98: 76–83.
Ng, A., R. A. Uribe, L. Yieh, R. Nuckels, and J. M. Gross, 2009 Zebrafish mutations in gart and paics identify crucial roles for de novo purine synthesis in vertebrate pigmentation and ocular development. Development 136: 2601–2611. Oliver, J. S., and R. D. Simpson, 1988 Influences of attitude toward
science, achievement motivation, and science self concept on achievement in science: a longitudinal study. Sci. Educ. 72: 143–155. Osborne, J., S. Simon, and S. Collins, 2003 Attitudes towards science: a review of the literature and its implications. Int. J. Sci. Educ. 25: 1049–1079.
Perry, G. H., N. J. Dominy, K. G. Claw, A. S. Lee, H. Fiegleret al., 2007 Diet and the evolution of human amylase gene copy number variation. Nat. Genet. 39: 1256–1260.
Petsko, G. A., 2011 In praise of model organisms. Genome 12: 115.
Ragunath, C., S. G. Manuel, V. Venkataraman, H. B. Sait, C. Kasinathan
et al., 2008 Probing the role of aromatic residues at the secondary saccharide-binding sites of human salivary alpha-amylase in sub-strate hydrolysis and bacterial binding. J. Mol. Biol. 384: 1232–1248.
Ramasubbu, N., C. Ragunath, P. J. Mishra, L. M. Thomas, G. Gyemant
et al., 2004 Human salivary alpha-amylase Trp58 situated at subsite -2 is critical for enzyme activity. Eur. J. Biochem. 271: 2517–2529.
Rennie, L. J., and K. F. Punch, 1991 The relationship between affect and achievement in science. J. Res. Sci. Teach. 28: 193– 209.
Schild, D., A. J. Brake, M. C. Kiefer, D. Young, and P. J. Barr, 1990 Cloning of three human multifunctional de novo purine biosynthetic genes by functional complementation of yeast mu-tations. Proc. Natl. Acad. Sci. USA 87: 2916–2920.
Shrigley, R. L., 1990 Attitude and behavior are correlates. J. Res. Sci. Teach. 27: 97–113.
Silver, J. M., and N. R. Eaton, 1969 Functional blocks of the ad-1 and ad-2 mutants of Saccharomyces cerevisiae. Biochem. Bio-phys. Res. Commun. 34: 301–305.
Simpson, R. D., and J. S. Oliver, 1985 Attitude toward science and achievement motivation profiles of male and female science students in grades six through ten. Sci. Educ. 69: 511–526. Smirnov, M. N., V. N. Smirnov, E. I. Budowsky, S. G. Inge-Vechtomov,
and N. G. Serebrjakov, 1967 Red pigment of adenine-deficient yeastSaccharomyces cerevisiae. Biochem. Biophys. Res. Commun. 27: 299–304.
Talton, E. L., and R. D. Simpson, 1986 Relationships of attitudes toward self, family, and school with attitude toward science among adolescents. Sci. Educ. 70: 365–374.
Tiong, S. Y., C. Keizer, D. Nash, J. Bleskan, and D. Patterson, 1989 Drosophila purine auxotrophy: new alleles of adenosine 2 exhibiting a complex visible phenotype. Biochem. Genet. 27: 333–348.
Tuan, H.-L., C.-C. Chin, and S.-H. Shieh, 2005 The development of a questionnaire to measure students’motivation towards sci-ence learning. Int. J. Sci. Educ. 27: 639–654.
GENETICS
Supporting Information
http://www.genetics.org/content/suppl/2011/11/30/genetics.111.135285.DC1
An Integrated Biochemistry and Genetics Outreach
Program Designed for Elementary School Students
Eric D. Ross, Sarah K. Lee, Catherine A. Radebaugh, and Laurie A. Stargell
! " !!!!# !!!!#$"%$!
Labeling Template
!
Mut
wt
Experimental Template
Mutant
Wild-type
Master Template
!
Mutant
(Red)
Wild-type
+,$!!$
'('#('(#'(!*)&+$!
#"%$
/0'$) *$
,-'$"+$+
, ., /, 0, 1, -,, # $ # $ # $ # $ # $ # $ # $ , ., /, 0, 1, -,, # $ # $ # $ # $ # $ # $ # $ #
" " #
$ #
"#%$(&%)
#" " #
0 !"0 1 !"1 !"2 3 5 !"6
$ $ $ $ $ $ $ $
% % % % % % % %
!" ' 22 18 4 3 23 11 * * * * * * * * * * * * * * * / 22 25
'"!! 0 11 33 / 01 37 * * * * * * * * * * * * * * * / 6 51
"' 47 7 0 02 28 7 * * * * * * * * * 04 3/ 7 / 26 22 / 24 23
"' 41 02 1 08 22 7 * * * * * * * * * 16 15 0/ 3 27 17 / 28 20
17 18 0/ 3 08 26 * * * * * * * * * * * * * * * / 14 33
/ 12 33 / 14 24 * * * * * * * * * * * * * * * / 02 45
"$" * * * * * * 26 05 5 5 21 23 3 27 21 * * * * * * * * *
!"$" * * * * * * 17 13 6 1 22 26 1 2/ 31 * * * * * * * * *
(' * * * * * * 27 07 2 0 24 25 0 21 30 0 14 26 / 06 42 * * *
#!" " * * * * * * 27 07 2 4 38 07 2 34 15 2 25 13 2 22 23 * * *
"" " 43 00 1 1 16 20 * * * * * * * * * * * * * * * * * *
!!$" " 45 8 1 3 2/ 15 * * * * * * * * * * * * * * * * * *
$ 1 10 33 2 04 31 * * * * * * * * * * * * * * * * * *
#" * * * * * * 0 01 35 0 1/ 40 / 03 5/ 1 04 35 / 01 47 * * *
" * * * * * * 6 06 24 1 14 34 0 12 4/ * * * * * * * * *
* * * * * * / 3 44 0 4 55 / 4 58 * * * * * * * * *
"!
" * * * * * * 5 11 20 / 07 43 * * * * * * * * * * * *
'! * * * * * * * * * * * * 2 27 22 * * * * * * * * *
&'! * * * * * * * * * * * * * * * 36 05 / 0/ 26 12 * * *
"' * * * * * * * * * * * * * * * 27 08 5 / 13 35 / 1/ 38
#"" * * * * * * * * * * * * * * * 0/ 1/ 22 1 08 38 / 06 41
,!'!" * * * * * * * * * * * * * * * 02 16 12 0 10 37 * * *
! ' ' ' ' ' ' ' ' ' ' ' ' ' ' ' ' ' ' ' ' ' + . -,
" %#&%&% $&' !$! $
"1 "
5 ",
6 !$'# ,
7 !+%"""'##'!!## "!"""'"%%""!'#"" ,
8 #!" &"' ,
9 %"#!"!,
: # ",
; $!"!""%" %! "#!"!,
< '#)
= +'# ",
54 """'#!#""!'#"!' ,
55 +#"#!"-" +" '-#"#)
56 !, &"' '##"!"%""""'!"('!%"# ",
57 "!! "!
58 +'# ,
59 +'##'! ",
5: "! ",
5; "%! '#,
5< +%#!" ")
5= +'# ",
64 '" '&"% '# !#!"" %$ '#!,
65 %# ! '# #",
66 %"'# $ """ $ !"'
67 #!"'#
68 ,#$ '" ",
"#"!% !"!# $'+.'#$'!#!"! #!*/ "'0# "!&"'0"!"#"!!'!% +. ,/% " !!! " "%"'0# !"#"!,