Effectiveness of Interpersonal Supervisor
Communications to Time Periodic
Performance through Delay Projects
(Case Study of PT X Projects)
Manlian Ronald A. Simanjuntak 1, Heni Gusfa2, Lutfi Nasution3
Professor of Construction Management, University of Pelita Harapan, Jakarta, Indonesia1 Dr. and Master of Science of Communication Studies, University of Mercubuana, Jakarta, Indonesia 2
Master Student, Department of Civil Engineering, University of Mercubuana, Jakarta, Indonesia 3
ABSTRACT:poor communication can not achieve the performance of time. researchers conducted studies on delayed aspects of communication, finding researchers who did not exist in any order of 15 large to 5 large factors in different factors to the delay in the study. The difference of this research with previous research 8 effectiveness of interpersonal communication dissected big influence if applied in making project delay and become guide of effectiveness which must be done to know what points become gap between supervisor and PT X craftsman by comparing result research and pre-research interviews. research conducted at PT X which has ISO 9001: 2008 and OHSAS 18001: 2007 certification which has been established for 33 years and has 1000 workers. the research method is done by spreading the questionnaire in PT X with sample of 20 Supervisor with minimum 3 years working period, the researcher uses Partial Least Square (PLS) to analyze the result of total influence value by summing the direct and indirect influence: openness (x1) -0,299 (x3) -0,265 have negative effect, equality (x5) 0,179 have positive effect, leadership (x6) 0,963 have positive influence, communication process (x7) has positive effect, ) 0,449 have a positive effect, motivation (x8) -0,157 have a negative effect where the negative influence become the gap between supervisor and daily repairman.
KEYWORDS : Effectiveness of interpersonal communication, contractor delays, time performance, supervisors. I. INTRODUCTION
Craftsman always feel uncomfortable in working when project is delayed (Source: Informant 4). When the project is delayed there is a gap between the builder and the supervisor (Source: Informant 5).
II. WHYINTERPERSONALCOMMUNICATIONISSOIMPORTANTTOSUPERVISOR
observing the background of the problem, can be identified from the pre-research interviews, if the project is delayed will have a significant impact on time performance and the significant influx of labour surrender in PT X. This allows the loss of qualified and non-qualified craftsman the completion of project completion time in PT X.
Researchers try to focus on the communication aspect, because the communication aspect always appears in the top 15 or even the top 10 of the factors causing delay in the project, along with the results of some previous researchers that have been collected:
Table 1: Project Results Delay Communication Aspects
No researchers Judul Year aspects of communication 1 Afshari,Khosravi,
Ghorbanali,Borzabadi, Valipour.
Identification of Causes of Non-excusable Delays of Construction Projects.
2011 20 causes of Unacceptable Delay, 12th Coordination. 2 Hamzah, Khoiry, Arshad,
Tawil, Che Ani.
Cause of Construction Delay - Theoretical Framework.
2011 poor
coordination, contractor communication is included in the list of
unacceptable delay sequences. 3 Muhwezi, J. Acai, G.
Otim.
An Assessment of the Factors Causing Delays on Building Construction Projects in Uganda.
2014 Poor
communication and
coordination, including the category of causes of delay by contractors, are in the order of 11 out of 27 major causes.
4 Mahamid. Common Risks Affecting
Time Overrun in Road Construction Projects in Palestine : Contractors Perspective.
2013 Poor
coordination and communication among
members, there are in the top 4 of 7 major factors delay project.
in Implementation of Building Construction Projects in Kupang City.
communication and coordination among parties involved 9 out of 10 major delays associated with contractors.
6 Divya, Ramya Causes, Effects and
Minimization of Delays in Construction Projects.
2015 Poor
communication and coordination in order of 2 of the 5 major causes of delay by contractors.
7 Agu, Ibe Assessment Of Factors
Causing Delay On Building Construction Projects in Enugu, Nigeria
2015 Poor
communication and
coordination, is in the order of 2 of the 12 main causes of contractor-related delay
8 Daba, Pitroda A Critical Literature
Review on Main Cause of Delay in Construction Projects
2018 Poor
communication and coordination among project members is a delay factor associated with the contractor 9 Kesavan, Gobidan,
Dissanaya
Planning & Mitigation Methods to Reduce the Project Delays in Sri Lankan Civil Engineering Construction Industries
2015 Poor
coordination and communication are listed in 10 out of 52 delay factors in Sri Lanka construction 10 Al-Emad1, Rahman,
Nagapan, Gamil
Ranking of Delay Factors for Makkah’s Construction Industry.
2017 Poor
coordination in rank 2 and poor communication in rank 8 out of 10 main factors causing delay
of communicating instructions, keep the atmosphere conducive and prevent the reduction of the daily worker to finish the project on time. This series of interpersonal communication models will suggest some ways on the supervisor in coordinating to the day-worker when the project is delayed.
III. SUPERVISORBASEDINTERPERSONALCOMMUNICATIONS Basic Communication Skill
A Supervisor in addition to being equipped with experience in the field and master the theory in interior work must also have [2] 3 important elements that must be developed in him which will affect the Supervisor's communication to the performance of artisans include: Ethos is the power of the speaker of his personal character, so his utterances can be trusted. Pathos is the power that a speaker has in controlling the emotions of his audience, while the Logos is the power that communicators have through their arguments.
Pattern of communication
[3] is a process designed to represent the reality of the interconnectedness of the elements covered and its sustainability, in order to facilitate systematic and logical thinking.[4] Communication Pattern consists of 3 kinds: 1. One way communication pattern, 2. Two way communication pattern or Two way traffic communication, 3. Multi-way Communication Pattern.
Interpersonal Communication
[5] Interpersonal Communication is the delivery of a message by one person and the receipt of a message by another person or a small group of people, with its effects and with the opportunity to provide immediate feedback.This type of communication is considered most effective in changing one's attitude, opinion or behavior, because of its dialogical nature of conversation. Reverse flow is straightforward, communicators know the response of communicants at once. [6] when communication is launched, the communicator knows for sure whether the communication is positive or negative, succeed or not. If he can give the opportunity to the communicant to ask as wide as possible.[7] that the Effectiveness of Interpersonal Communication begins with 1. Openness, 2. Empathy, 3. Supportiveness, 4. Positive attitude (Positiveness), 5. Equality (Equality)
Coordination
[8] Normatively, coordination is defined as the authority to mobilize, harmonize, align, and balance specific or different activities so that they are directed to a particular purpose. While functionally, coordination is done in order to reduce the negative impact of specialization and to streamline the division of labor. [9] Coordination is defined as a business cooperation between agencies, agencies, units in the implementation of certain tasks, so there is mutual filling, mutual help and complementary.
Form of Coordination In Organizations
Characteristics of Coordination in Organizations
[11] the characteristics of coordination are as follows: 1. Coordination responsibility lies in the leader, 2. Coordination is a joint venture, 3. Coordination is a continuous process, 4.Adanya regular group business arrangements, 5.Concept of unity of action is the core rather than coordination, 6.The purpose of coordination is common goals. From the above theory can be linked to this research that the implementation of good coordination required good communication in fulfilling all the characteristics of the coordination.
Interpersonal Communication Model
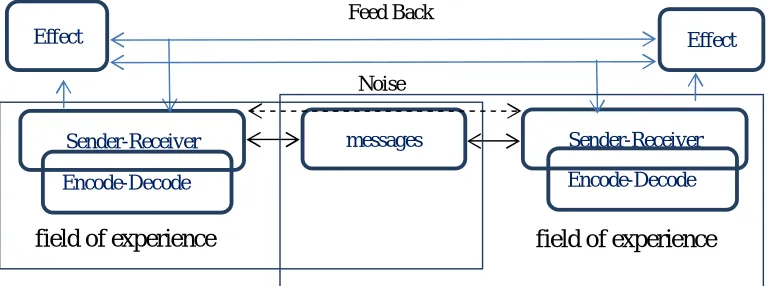
In the interpersonal communication of the current that occurs is two-way, even communicators can be communicant, likewise, the components of interpersonal communication can be explained through the following figure :
Fig 1: Devito Interpersonal Communication Model Chart
[12] Among other communication techniques, interpersonal communication is considered the most powerful in changing attitudes, behaviors and opinions, this is caused by face to face. From the picture above can be explained that the components of interpersonal communication are as follows : a. Receiver-Receiver, b. Encoding-Decoding, c. Messages, d. Channel, e. Disturb Or Noise, f. Physical disorders, g. Psychological disorders, h. Semantic disorder, i. Feedback, j. Effect. This research was done by distributing questionnaires / questionnaires to Supervisor PT X. Using Quantitative research of descriptive approach, by collecting data through questionnaire, the number of respondents is already known under 100 people for that researcher using Saturated Sampling (Census), then measured by Skalalinkert and analysed with PLS, and supported by the results of pre-research interviews with several day labourers to strengthen the results of this study.
IV.EXPERIMENTALRESULTS
After the analysis of Outer Model As the test Convergent validity, Construct Reliability, Average Variance Extracted-AVE, Discriminant validity, cross loading and model undimensionalitas.
Outter Models
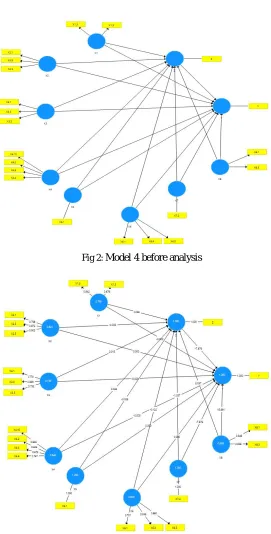
there are some indicators that have been removed so that the results obtained valid and feasible for the analysis, from 3 models that have been in get from result of analysis which have been done finally obtained by model 4 which all indicator have valid, following details:
Noise
Sender-Receiver
Encode-Decode
Sender-Receiver
Encode-Decode messages
Effect Effect
Feed Back
Fig 2: Model 4 before analysis
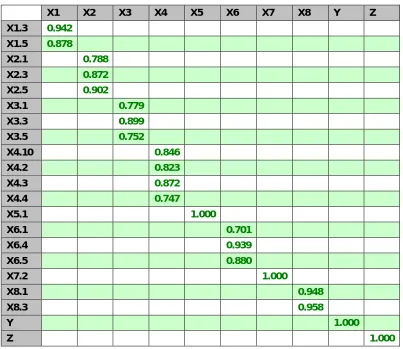
If described in more detail are as follows:
Table 2: Analysis Model 4
X1 X2 X3 X4 X5 X6 X7 X8 Y Z
X1.3 0.942
X1.5 0.878
X2.1 0.788
X2.3 0.872
X2.5 0.902
X3.1 0.779
X3.3 0.899
X3.5 0.752
X4.10 0.846
X4.2 0.823
X4.3 0.872
X4.4 0.747
X5.1 1.000
X6.1 0.701
X6.4 0.939
X6.5 0.880
X7.2 1.000
X8.1 0.948
X8.3 0.958
Y 1.000
Z 1.000
Table 3 : Discriminant validity test results
X1 X2 X3 X4 X5 X6 X7 X8 Y Z
X1 0.910
X2 0.848 0.855
X3 0.609 0.647 0.813
X4 0.657 0.711 0.554 0.823
X5 0.215 0.106 0.546 0.072 1.000
X6 0.719 0.641 0.567 0.790 0.349 0.846
X7 0.478 0.627 0.404 0.791 0.215 0.822 1.000
X8 0.509 0.593 0.453 0.722 0.353 0.893 0.948 0.953
Y 0.554 0.582 0.484 0.684 0.436 0.939 0.903 0.958 1.000
Z 0.478 0.496 0.450 0.578 0.441 0.860 0.798 0.948 0.903 1.000
Based on the above table, then all roots of the AVE each construct> correlation with other variables. For example X1: AVE value is 0.829 then AVE Root is 0.910. Value 0.910 is greater than the correlation with other constructs, ranging from X2 sd Z. For example korelasinya dg X2 is 0.848 where the root AVE X1 0.910> correlation X1 dg X2 is 0.848.So the requirement of discriminant validity in model 4 has been fulfilled because all AVE Root values of each construct> correlation with other variables, as listed in the above table.
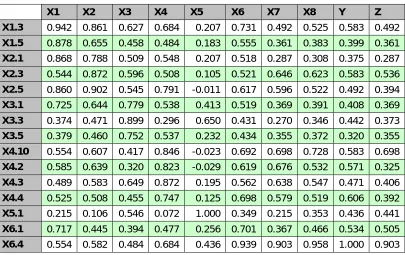
Cross-loading is another method for knowing discriminant validity, ie by looking at the value of cross loading. If the loading value of each item to its construct is greater than its cross loading value. Below is a table cross loading:
Table 4 : Cross-loading Test Results
X1 X2 X3 X4 X5 X6 X7 X8 Y Z
X1.3 0.942 0.861 0.627 0.684 0.207 0.731 0.492 0.525 0.583 0.492
X1.5 0.878 0.655 0.458 0.484 0.183 0.555 0.361 0.383 0.399 0.361
X2.1 0.868 0.788 0.509 0.548 0.207 0.518 0.287 0.308 0.375 0.287
X2.3 0.544 0.872 0.596 0.508 0.105 0.521 0.646 0.623 0.583 0.536
X2.5 0.860 0.902 0.545 0.791 -0.011 0.617 0.596 0.522 0.492 0.394
X3.1 0.725 0.644 0.779 0.538 0.413 0.519 0.369 0.391 0.408 0.369
X3.3 0.374 0.471 0.899 0.296 0.650 0.431 0.270 0.346 0.442 0.373
X3.5 0.379 0.460 0.752 0.537 0.232 0.434 0.355 0.372 0.320 0.355
X4.10 0.554 0.607 0.417 0.846 -0.023 0.692 0.698 0.728 0.583 0.698
X4.2 0.585 0.639 0.320 0.823 -0.029 0.619 0.676 0.532 0.571 0.325
X4.3 0.489 0.583 0.649 0.872 0.195 0.562 0.638 0.547 0.471 0.406
X4.4 0.525 0.508 0.455 0.747 0.125 0.698 0.579 0.519 0.606 0.392
X5.1 0.215 0.106 0.546 0.072 1.000 0.349 0.215 0.353 0.436 0.441
X6.1 0.717 0.445 0.394 0.477 0.256 0.701 0.367 0.466 0.534 0.505
X6.5 0.639 0.593 0.565 0.824 0.157 0.880 0.703 0.745 0.761 0.703
X7.2 0.478 0.627 0.404 0.791 0.215 0.822 1.000 0.948 0.903 0.798
X8.1 0.409 0.547 0.375 0.692 0.225 0.754 0.905 0.948 0.816 0.905
X8.3 0.554 0.582 0.484 0.684 0.436 0.939 0.903 0.958 1.000 0.903
Y 0.554 0.582 0.484 0.684 0.436 0.939 0.903 0.958 1.000 0.903
Z 0.478 0.496 0.450 0.578 0.441 0.860 0.798 0.948 0.903 1.000
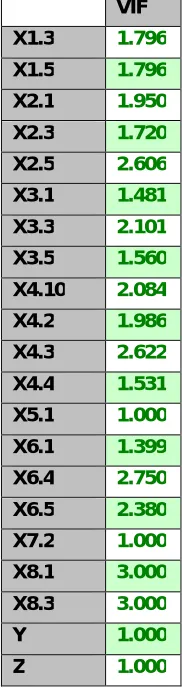
From the table above can be seen that all loading indicator to construct> cross loading. Suppose on X1.3, its loading value to its construct is X1 is 0.942 which is bigger than all cross loads both to X2, X3, X4 and so on Y. Because of all the loading value indicator to its construct> cross loading then this model has qualified discriminant validity Below is multicollinearity analysis by looking at VIF values between indicators:
Table 5 : 2nd Multicollinearity Test Results
VIF
X1.3 1.796
X1.5 1.796
X2.1 1.950
X2.3 1.720
X2.5 2.606
X3.1 1.481
X3.3 2.101
X3.5 1.560
X4.10 2.084
X4.2 1.986
X4.3 2.622
X4.4 1.531
X5.1 1.000
X6.1 1.399
X6.4 2.750
X6.5 2.380
X7.2 1.000
X8.1 3.000
X8.3 3.000
Y 1.000
Based on the above VIF outer table, there is no strong multicolinearity or intercorrelation between indicators because all VIF outer values <5. Conclusion on model 4: All items or indicators have met the validity and reliability requirements and there is no multicolinearity among indicators. Then the next step is the analysis of the inner model.
Inner Models
Path Coefficient or path analysis coefficient, Direct Effects, Below shows the direct effect or direct effect of each construct independent variable to the dependent variable:
Table 6 : Direct Impact Test Results
X1 X2 X3 X4 X5 X6 X7 X8 Y Z
X1 0.000 0.038
X2 0.000 -0.035
X3 0.000 0.015
X4 0.000 0.034
X5 0.000 -0.023
X6 0.000 -0.122
X7 -7.876 -1.057
X8 15.891 2.037
Y
Z -7.876
In the Output Path Coefficient as shown in the table above is to see the significance of each of each variable X to Z and also to Y. Suppose the magnitude of the parameter coefficient for variable X1 of 0.038 to Z which means there is a positive influence X1 to Z. Or it can be interpreted that the better the value of X1 then the Z will increase. For example magnitude coefficient parameter for variable X7 equal to -7,876 to Y which means there is negative influence X7 to Y. Or can be interpreted that the better value of X7 then Y will decrease.Indirect Effects: Below shows indirect effects or indirect effects of each construct independent variable to the dependent variable through an intermediate variable that is variable Z:
Table 7 : Indirect Impact Test Results
X1 X2 X3 X4 X5 X6 X7 X8 Y Z
X1 -0.299
X2 0.277
X3 -0.120
X4 -0.265
X5 0.179
X6 0.963
X7 8.325
X8 -16.048
Y 0.000
In Out put Path Coefficient as shown in the table above is to see the significance of each of each variable X to Y through Z. Suppose the magnitude of the parameter coefficient for the variable X1 to Y through Z is equal to -0.299 which means there is influence negative X1 to Y through Z .
Total Effects: Below shows the total effect or total effect which is the sum of indirect effects with immediate effect: Table 8 : Total Impact Test Results
X1 X2 X3 X4 X5 X6 X7 X8 Y Z
X1 -0.299 0.038
X2 0.277 -0.035
X3 -0.120 0.015
X4 -0.265 0.034
X5 0.179 -0.023
X6 0.963 -0.122
X7 0.449 -1.057
X8 -0.157 2.037
Y 0.000
Z -7.876
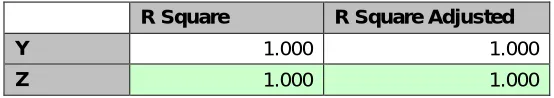
For example the effect of variable X8 to Y either directly or indirectly through Z is equal to -0.157 which means there is a negative influence of X8 to Y either through Z or directly. Output Another test of the model is done by looking at the R-Square value which is a goodness-fit-model test as shown below:
Table 9 : R-Square Result
R Square R Square Adjusted
Y 1.000 1.000
Z 1.000 1.000
R-Square value of 1, can be explained that all free variables affect the Z or Y perfectly because the value of r square 1 or which means the influence is 100%.
V. CONCLUSION
After data analysis, the researchers draw conclusions from the formulation of the problem which has been summarized : 1. There are 8 factors that enable a person to understand and apply good interpersonal communication, eight
factors that a supervisor must be able to apply, openness, empathy, support, Positive Felling, equality, leadership, communication process, motivation, where these eight factors can measured by using questionnaires as measuring tools and analysed with the help of Partial Least Square (PLS) program.
2. Message information submitted by the supervisor can be completed in accordance with the time specified by the amount of work planned.
negative output and can be observed from the results of interview pre-study with some daydreamer who researchers can draw conclusions of these points that become the gap between the Supervisor and the day-to-day where the supervisor feels already approach to the daily carpentry well but supervisor at pt x not understand which are lacking and missing from their actions in the project against the day labourer.
4. From this research the company needs to conduct training where its purpose is to give understanding to the application of interpersonal communication to Supervisor who do not yet know that interpersonal communication has eight indicators where the indicators are still there are missed like openness, support, positive feeling, and motivation, it can be few things that make the journeyman leave PT X, work only based on money but have not comfort in work so work only factor of money without any comfort, and become gap which make daily do not maximal run message or information submitted during briefing.
REFERENCES
1. Proboyo, Budiman. (1999). “Keterlambatan Waktu Pelaksanaan Proyek : Klasifikasi dan Peringkat 2. dari Penyebab-penyebabnya”, Dimensi Teknik Sipil, Vol. 1 no. 2, September, pp. 49-58.
3. Cangara, Hafied. 2003. “Pengantar Ilmu Komunikasi (Cetakan Keempat)”. Jakarta : PT. RajaGrafindo Persada. 4. Effendy, Onong Uchjana. 1989. KAMUS KOMUNIKASI. Bandung : PT. Mandar Maju.
5. Effendy, Onong Uchjana. (1989 : 32). KAMUS KOMUNIKASI. Bandung : PT. Mandar Maju. 6. De Vito, Joseph. 1989. The Interpersonal Communication Book. Harper and Row. New York.
7. Sunarto. 2003. “Manajemen, komunikasi antar pribadi dan gairah kerja karyawan”. Jakarta: Pusat Pendidikan dan Pelatihan Pegawai 8. Departemen Kehakiman dan HAM.
9. Devito, Joseph. 1997. Komunikasi Antarmanusia. Professional Books: Jakarta. 10. Ndraha, Taliziduhu, 2003. Kybernology (Ilmu Pemerintahan Baru) 1. RinekaCipta, Jakarta. 11. Hasibuan, Malayu S.P. 2011. MANAJEMEN: Dasar, Pengertian, dan Masalah.Jakarta: PT Aksara.
12. Manila, I.GK. 1996. Praktek Manajemen Pemerintahan Dalam Negeri. Jakarta:PT. Gramedia Pustaka Umum. 13. Handayaningrat. 1989. Manajemen Konflik. PT. Gramedia Pustaka Utama. Jakarta.