Conservation of Energy through Energy Audit
S.Balamurugan1, Aangeeras.N2, Andrews.R2, Bakthavachalam.D2, Mathiyazhagan3
Assistant Professor, Department of Electrical and Electronics, R.M.K Engineering College, Tamilnadu, India 1
UG Scholar, Department of Electrical and Electronics, R.M.K Engineering College, Tamilnadu, India 2
Project Manager, JLL, Tamilnadu, India3
Abstract: The energy demand for various industries and institutions is increasing at a rapid pace. To avoid loss of energy, proper energy conservation measures are required. This is made possible through an Energy Audit. An Energy Audit is a process through which we can determine why, where and how energy is being spent in an industry or a building. By collecting this information we can determine where energy efficiency needs to be improved and how production costs can be reduced. This project aims to carry out an audit of 4 systems of a beverage manufacturing plant namely its Diesel Generators, Low pressure Compressors, Chillers and Pumps. The objective of this project is to evaluate the energy used in these systems and identify areas where energy savings can be achieved –either through installment of new equipment or suggesting techniques the industry can implement to save energy.
KEYWORDS: Energy Audit, Diesel Generator, Chillers, Pumps, Energy Saving.
I. INTRODUCTION
Energy is a major factor that influences the development of any country. In developing countries, the demand for energy is higher. The first step towards energy conservation is an energy audit. An energy audit gives a clear picture of an industry’s energy utilization in different activities and the efficiencies of its various equipment. It acts like a compass, looking at which we can find out what to reduce, where to decrease energy, and also how to do it. We conducted an energy audit at a beverage manufacturing plant. The plant manufactures packaged juices and drinks and is involved in the selling of the same. The plant had a huge contract demand of 2000KVA of electricity. This encouraged us to conduct an energy audit and identify areas where energy can be more efficiently used.
1.1 Scope of Work
The manufacturing plant comprises of various sub systems. We have evaluated the performance of each sub system and compared them to set of guidelines given by the Indian Energy Conservation Act of 2001. Based on the findings, whether the system is being operated optimally or whether it requires some modification to achieve better utilization of energy have been found out. Thus these have been given in as the energy conservation measures that the plant can take up to reduce wastage of energy. The systems evaluated are Diesel Generators, Low pressure Compressors, Chillers and Pumps.
1.2 Methodology and Approach
were evaluated by performing calculations based on various formulas. After evaluating the performance, the values are compared with thumb rules and a detailed report containing the energy conservation measures were deduced
II. LITERATURE REVIEW
Audit is a systematic independent inspection of an industry or organization. As per Indian Energy Conservation Act-2001, Energy audit is defined as “the verification, monitoring and analysis of use of energy including submission of technical report containing recommendation for improving energy efficiency with cost benefit analysis and an action plan to reduce energy consumption”[1].
Energy audit is an analysis of energy consumption in building and reduces energy consumption without negatively affected outputs. Energy audit can be classified into i) Preliminary Audit ii) Detailed Audit. Preliminary energy audit is relatively quick exercise; it estimates the scope for saving using the existing or easily obtained data and helps identify the areas for more detailed study. The detailed energy audit is carried out in three phases: Phase I – Pre Audit Phase, Phase II – Audit Phase, Phase III – Post Audit Phase. This is a comprehensive audit which offers the most accurate estimate of energy saving and cost [2][3].
Energy audit can be one of the fastest and cheapest solutions, to mitigate gap between energy demand and supply. Every day the demand for electrical energy is increasing due to fast progress in industrialization, population growth and urbanization. The study also shows that energy audit can prove to be a cost effective and holistic approach for energy conservation and for sustainable environment [4][5].
In India, As per Indian Energy Act-2003, the energy audit should be carried out in all commercial industrial and institutional buildings that have connected loads of more than 500kW or 600kVA. Energy audit is first step towards understanding how energy is consumed in selected premises as it indicates where the potential lies for energy conservation and shows areas where energy management is required [6].
III. ELECTRICITY BILL ANALYSIS
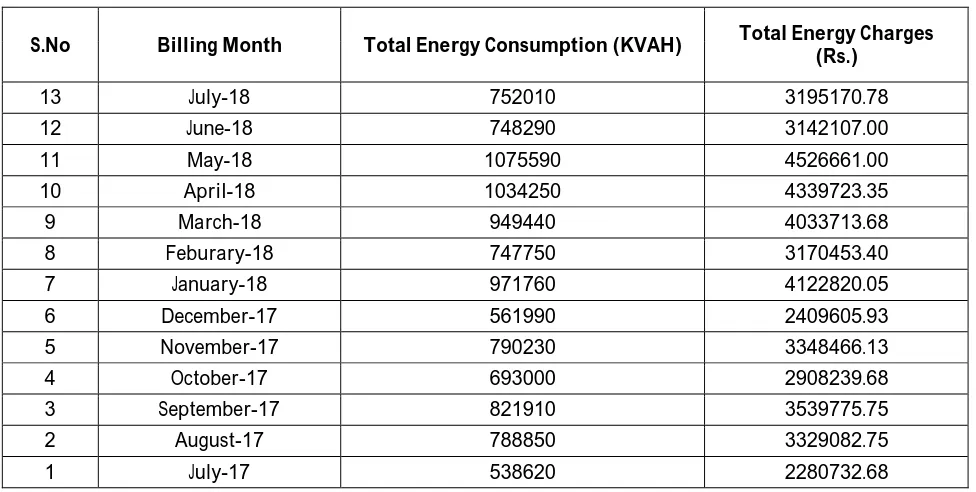
Table -1: Electricity Charges
S.No Billing Month Total Energy Consumption (KVAH) Total Energy Charges (Rs.)
13 July-18 752010 3195170.78
12 June-18 748290 3142107.00
11 May-18 1075590 4526661.00
10 April-18 1034250 4339723.35
9 March-18 949440 4033713.68
8 Feburary-18 747750 3170453.40
7 January-18 971760 4122820.05
6 December-17 561990 2409605.93
5 November-17 790230 3348466.13
4 October-17 693000 2908239.68
3 September-17 821910 3539775.75
2 August-17 788850 3329082.75
The power is drawn from the Electricity board at 33 KV and stepped down to 433 V through two number of transformers- one 1000KVA and one 1250 KVA transformer. The contract demand of facility is 2000 KVA.The month wise total Energy consumption and billable demand has been tabulated in Table 1. It is observed that from February to early June(Summer Season in Tamil Nadu) there is steady rise in the energy is consumption. During the other months there is considerable decrease in the energy consumption. As per the electricity bill, no details regarding the actual billable demand were given. Hence data has been analyzed only on the basis of contract demand.
IV. DIESEL GENERATOR AUDIT
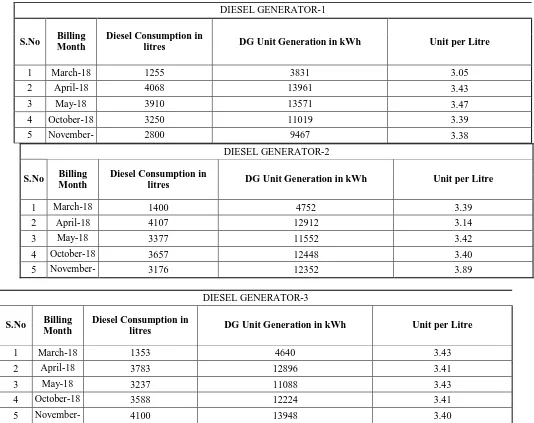
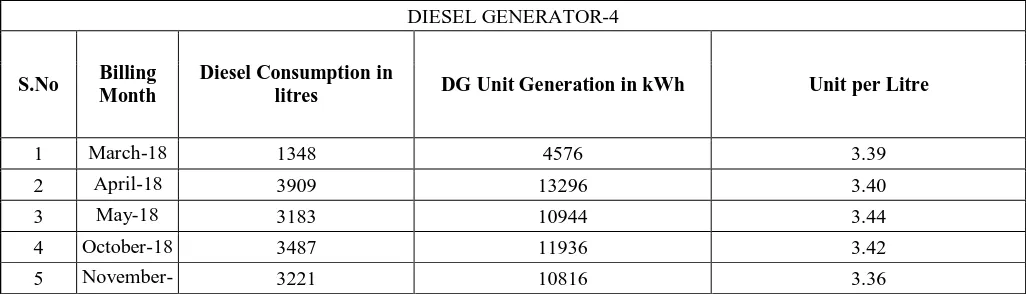
There are four number of diesel generators being used in the plant as a backup energy sources during the power failure. The month wise diesel consumption and unit generation of DG set has been mentioned as below along with unit per liter.
Table 2 : Diesel Generator Analysis
DIESEL GENERATOR-2
S.No Billing Month
Diesel Consumption in
litres DG Unit Generation in kWh Unit per Litre
1 March-18 1400 4752 3.39
2 April-18 4107 12912 3.14
3 May-18 3377 11552 3.42
4 October-18 3657 12448 3.40
5 November-18
3176 12352 3.89
DIESEL GENERATOR-3
S.No Billing Month
Diesel Consumption in
litres DG Unit Generation in kWh Unit per Litre
1 March-18 1353 4640 3.43
2 April-18 3783 12896 3.41
3 May-18 3237 11088 3.43
4 October-18 3588 12224 3.41
5 November-18
4100 13948 3.40
DIESEL GENERATOR-1
S.No Billing Month
Diesel Consumption in
litres DG Unit Generation in kWh Unit per Litre
1 March-18 1255 3831 3.05
2 April-18 4068 13961 3.43
3 May-18 3910 13571 3.47
4 October-18 3250 11019 3.39
5 November-18
DIESEL GENERATOR-4
S.No Billing Month
Diesel Consumption in
litres DG Unit Generation in kWh Unit per Litre
1 March-18 1348 4576 3.39
2 April-18 3909 13296 3.40
3 May-18 3183 10944 3.44
4 October-18 3487 11936 3.42
5 November-18
3221 10816 3.36
From the table it is observed that the performance of all 4 diesel generators are satisfactory as the unit/litre of each diesel generator is about 3kwh/L.
V. LOW PRESSURE COMPRESSOR AUDIT
There are three Low pressure compressors are being used in the facility as instrument air compressors and the rated parameter of the LP compressors has been mentioned as below:
Table 3 : Compressor Analysis
Description Unit LP Air Compressor 1 LP Air Compressor 2 LP Air Compressor 3
Rated Capacity CFM 189.00 283.00 400.00
Rated Power kW 30 55 90
Initial Pressure(g) Kg/cm2 0 0 0
Final Pressure(g) Kg/cm2 7.5 7.5 7.5
Atmospheric
Pressure Kg/cm
2
1.033 1.033 1.033
Loading time min 0.50 0.25 0.20
Volume of air
receiver m
3
0.2 0.2 0.2
Volume of pipe
line m
3
0.0015 0.0015 0.0015
Total Volume m3 0.20 0.20 0.20
Free Air Delivered CFM 103.25 206.50 258.12
Full Load Power
Consumption kW 28.00 53.00 84.00
Specific Power
Consumption kW/CFM 0.271 0.257 0.325
Volumetric
Efficiency % 54.63 72.97 64.53
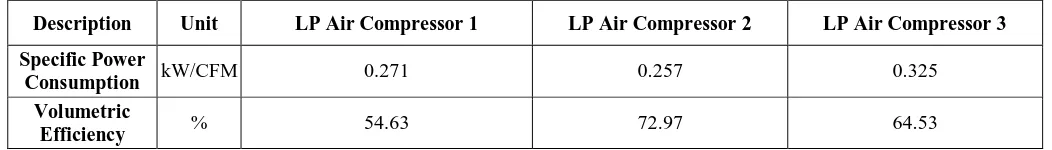
At the time of audit, compressor 2 & 3 were in line and the loading and unloading pressure of the compressors are 0 kg/cm2 and 7.5 kg/cm2 respectively. The header pressure is about 7.5 kg/cm2.The required parameters of the compressors have been captured in order to assess the volumetric efficiency of the Low Pressure compressors and the same has been mentioned as below:
Table 4 : Compressor Required data’s
Description Unit LP Air Compressor 1 LP Air Compressor 2 LP Air Compressor 3
Specific Power
Consumption kW/CFM 0.271 0.257 0.325
Volumetric
Efficiency % 54.63 72.97 64.53
The volumetric efficiency of the Compressor 1 is on the lower side as compared to other two compressors and the specific power consumption of the compressor 3 is on higher side.
VI. PUMPS AUDIT
Different types of pumps are being used in the facility, Namely, primary pump, secondary pump, and condenser pump. The parameters of the pump such as the pump flow, pump total head and pump power consumption were measured in order to assess the efficiency of the pump. The performance assessment of Pumps have been done and they have been tabulated as follows
Table 5 : Pump Analysis
Description Units Primary Pump Secondary Pump Condenser Pump
Suction Head m 0.000 0.000 1.000
Pump Discharge Pressure Kg/cm2 2.5 3.5 4.5
Flow Rate m3/hr 40 55 135
Motor Power Consumption kW 9.00 12.00 45.00
Specific Gravity - 1 1 1
Density Kg/m3 1000.00 1000.00 1000.00
Flow Rate T/hr 40.00 55.00 135.00
Head Developed MWC 25.00 35.00 44.00
Water Power kW 2.73 5.25 16.19
Motor Efficiency % 80.00% 80.00% 80.00%
Pump Input kW 7.20 9.60 36.00
Combined Efficiency % 30.28% 43.71% 35.97%
Pump Efficiency % 37.85% 54.64% 44.96%
Specific Power Consumption kW/TPH 0.23 0.22 0.33
The efficiency of Secondary pump and Condenser pump are in very good range.However, the specific power consumption of the condenser pump is on higher side as compared to the remaining pumps installed in the facility. It is due to throttling of the pumps. At the time of audit, it was observed that around 40% of valve closed on the discharge side of the pump. It is result in higher specific power consumption of the condenser. The efficiency of raw water pump and chiller condenser pump is in good range and specific power consumption of both pumps are satisfactory.Compressor cooling water circuit pump efficiency is on lower side and specific power consumption of the pump is on higher side. The efficiency is on lower side as compared to remaining pumps of the facility. It is suggested to replace this pump with new energy efficiency pump, it will result in considerable amount of energy savings.
VII. ENERGY CONSERVATION MEASURES
Based on the above analysis of the 4 systems of the manufacturing plant the following are the techniques through which energy conservation can be done :
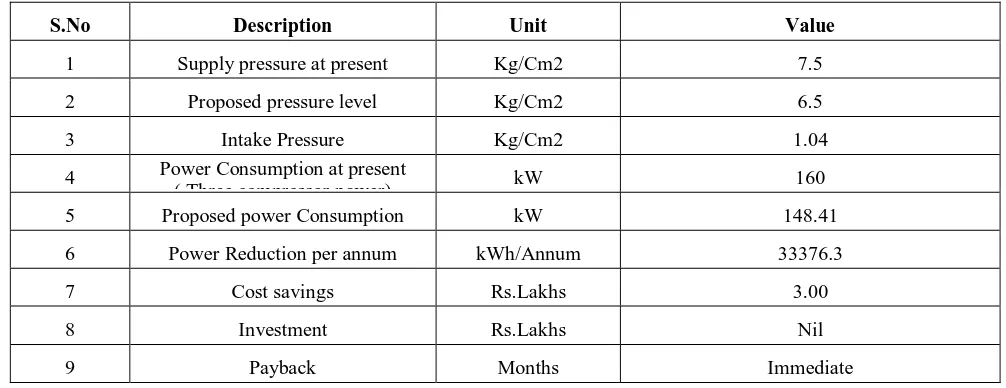
7.1 Pressure setting reduction in Low Pressure Compressors
In the present scenario, it is observed that the low-pressure compressors are being used for instrumentation control and it was noticed that cut in and cut off pressure of the compressor are 6 kg/cm2 and 7.5 Kg/cm2 respectively for all the compressors. It is recommended to set the cut in and cut off pressure at 6 kg/cm2 to 6.5 Kg/cm2. It will result in considerable amount of energy savings.
This pressure setting has been recommended after considering the pressure loss in the pipe line. A reduction in the delivery pressure by 1 bar in a compressor would reduce the power consumption by 6 to 10%. The energy savings quantification has been mentioned as below:
Table 6 : Pressure Setting
S.No Description Unit Value
1 Supply pressure at present Kg/Cm2 7.5
2 Proposed pressure level Kg/Cm2 6.5
3 Intake Pressure Kg/Cm2 1.04
4 Power Consumption at present
( Three compressor power) kW 160
5 Proposed power Consumption kW 148.41
6 Power Reduction per annum kWh/Annum 33376.3
7 Cost savings Rs.Lakhs 3.00
8 Investment Rs.Lakhs Nil
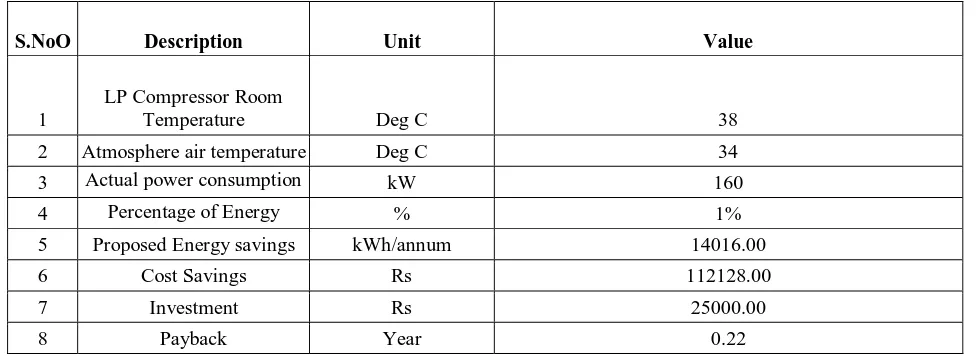
7.2 Room Temperature reduction in Low Pressure Compressors
During audit, it was observed that the LP compressor Room temperature was about 38℃ which is little bit on higher side as compared to the atmospheric temperature of 34℃. As a thumb rule “Every 4℃ rise in inlet air temperature results in a higher energy consumption by 1% to achieve equivalent output”. Hence cool air intake leads to a more efficient compression.
It is recommended to draw cool ambient air from outside, as the temperature of air in the compressor room is higher than the ambient temperature. It will result in considerable amount of energy savings during winter and rainy season. The energy saving quantification has been mentioned as below:
Table 7 : Room Temperature Reduction
S.NoO Description Unit Value
1
LP Compressor Room
Temperature Deg C 38
2 Atmosphere air temperature Deg C 34
3 Actual power consumption of three LP compressors
kW 160
4 Percentage of Energy savings based on thumb
% 1%
5 Proposed Energy savings kWh/annum 14016.00
6 Cost Savings Rs 112128.00
7 Investment Rs 25000.00
8 Payback Year 0.22
7.3 Installation of variable frequency drive in Secondary pump
At the time of audit, it was observed that secondary pump is being used at chiller plant. The throttling has been done at discharge side of the pump. The valve opening percentage was about 60%. It introduces an additional friction loss in the pumping system which result in additional energy consumption. It is recommended to install Variable frequency drive (VFD) in order to reduce the energy loss. It will result in considerable amount of energy savings and the energy saving quantification has been mentioned as below:
Table 8 :VFD Analysis
S.NO Description Unit Value
1 Actual Power consumption of the pump kW 12
2 Control valve opening percentage % 60%
3 Saving Percentage % 5%
4 Proposed Energy Consumption kw 11.40
5 Annual Energy savings kWh/annum 4380.00
6 Cost savings Rs 35040.00
7 Investment Rs 10000.00
VIII. CONCLUSION
The performance of 4 crucial systems of the manufacturing plant namely the diesel generators, low pressure Compressors, chillers and pumps were analyzed. Based on the findings, recommendations were given to systems which on implementation would yield significant energy savings and also aid in lowering production costs. The recommendations given are as per the Indian Energy Conservation Act of 2003. Implementation of the recommendation in the low pressure compressors alone leads to a saving of about 3 lakh rupees and reducing the room temperature to the suggested level leads to energy savings of more than 14,000 kWh/annum. Installation of the variable frequency drive in the secondary pump leads to a saving of more than 4000kWh/annum. Thus with the suggested improvements both energy and considerable amount of capital can be saved.
REFERENCES
[1] Bureau of energy efficiency guide books, book 1, chapter 03 "Energy Management and Audit", page no. 54-78.
[2] Sandip Ballal, “Energy Performance Important and Energy Cost Reductions at Baltic Place Commercial Office Complex”, thesis published in
STAFFORDSHIRE University, February 2016, page no.164.
[3] Rakiba Rayhana, “Electric and Lighting Energy Audit: A Case Study of Selective Commercial Buildings in Dhaka”, 2015 IEEE international
WIE conference on 20 December 2015, page no 1-4.
[4] Barney L. Capehart, “Guide to Energy Management”, Book published by The Fairmont Press, Inc 2003, Chapter no 5.
[5] Rajesh Tilwani, “Energy saving potentials in building through energy audit – A case study in an Indian building”, published in 2015 IEEE International Conference on Technological Advancement in Power & Energy, June 2015, page no 289-293.
[6] Sonal Desai, “Handbook of Energy Audit”, Book published by McGraw Hill (India) Private Limited, 2015, chapter 1 & 2.
[7] Shailesh K. R., “Energy consumption optimization in classrooms using lighting energy audit”, Research and technology in coming decades
(CRT 2013), IEEE National Conference, 27-28 Sept. 2013, page no.1-5.
[8] Muhammad Usman Khalid, “Energy Conservation through Lighting Audit”, 2012 IEEE International Conference on Power and Energy, 2-5
December 2012, page no.840-845.
[9] G. Paris, “Combined electric light and day light systems Ecodesign”, IEEE Industry Applications Society Annual Meeting (IAS), 2011, page no.