Forest Decline Model Development With Landsat TM, SPOT, and DEM DATA
John A. Brockhaus Michael V. Campbell
Siamak Khorram Robert I. Bruck Casson Stallings
Forestry Department, Computer Graphics Center, and Department of Plant Pathology
North Carolina State University Raleigh, NC 27695-7106
ABSTRACT
The relationships between percent defoliation and digital near infrared reflectance data detected by the Landsat Thematic Mapper and SPOT sensors were investigated. These data were both found to be negatively correlated with defoliation data collected within the boreal montane spruce-fir ecosystem of the Black Mountains, North Carolina. Correlation coefficients were significant at the 0.05 level. Linear regression analysis demonstrated that neither source of satellite based remotely sensed data to be accurate predictors of defoliation. The addition of digital elevation data, however, as an independent variable to the regression equations significantly improved the predictive reliability of the models.
1. INTRODUCTION
Forest decline syndrome is generally defined as a chronic demise in the overall health of a forest ecosystem and has been observed in the temperate forests of North America and Europe (Schutt and Cowling, 1985; Bruck, 1984; Johnson, 1983). Visual signs of forest decline include crown defoliation, foliar discoloration, significant reductions in radial increment, and rapid mortality (Bruck and Robarge, 1988; McLaughlin, 1985; Johnson and Siccama, 1983). Biotic and abiotic factors have been identified as stress agents involved in the development of this phenomena (Bruck, 1988; Schutt and Cowling, 1985).
A significant amount of research has been conducted to assess the dynamic cause and effect relationships at work between both biotic and abiotic agents and vegetative stress (McLaughlin, 1985). Efforts have also been concentrated in quantifying and mapping the spatial extent of the syndrome (Electric Power Research Institute, 1988). Given the broad geographic distribution of the forest decline syndrome the use of remotely sensed data has become a vital component in regional long term monitoring efforts.
Forest decline conditions within the spruce-fir ecosystem of the southern Appalachian Mountains of the United States have been mapped using color-infrared (CIR) aerial photography. Maps depicting classes of forest damage, based on the number of standing dead stems, were produced from 1984 CIR photography. A repeat interpretation is currently underway using 1988 CIR photography (Dull et al., 1988).
In addition to the use of aerial photography, Landsat TM digital data have been used to delineate the spatial distribution of discrete levels of forest damage within the spruce-fir ecosystem of the southern Appalachians. Investigators found field estimates of defoliation to be significanntly correlated with the MR waveband (Band 4) of the TM. A model quantifying this relationship was developed which predicted the level of defoliation (%)based upon the TM band 4 digital number and topographic position (Brockhaus et al., 1989). This model was then applied to digital TM and digital elevation model (DEM) data to produce a spatial data set describing the distribution of defoliation conditions throughout the ecosystem.
The spectral resolution of the TM MR waveband (Band 4) is very similar to that of the SPOT multispectral MR band 3, 0.76-0.90 um and 0.79-0.89 um respectively . Thus it is likely that the SPOT band 3 data could be utilized to model and map the distribution of defoliation within the spruce-fir ecosystem with the added benefit of improved spatial resolution over the Landsat TM. The objectives of the research presented in this paper were to: 1) develop a defoliation model from SPOT NIR digital data and DEM data, and 2) to compare the performance of this model to that of a Landsat TM based model.
2. STUDY SITE DESCRIPTION
peaks exceeding 1900 meters (m) in elevation, cut by steep gorges and saddles. Mt. Mitchell, the highest point east of the Front Range of the Rocky Mountains, is situated in the southern half of the range and with an elevation of 2037 m.
ins__
Figure 1 : Location and extent of
_________
______V
Mt. Mitchell State Park, North Carolina.
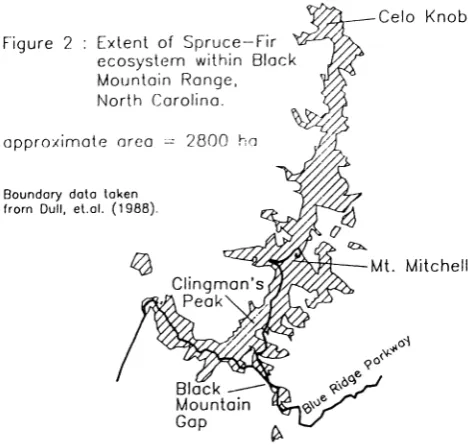
Theexisting boreal montane forests are distributed over approximately 2800 hectares (ha) (Figure 2). These forests are characterized by the presence of a disjunct, remnant community of red spruce rubens, Sarg.) and Fraser fir (Abies fraseri, Parsh). Distribution of these species is primarily controlled by elevation. Above 1800 m the forest is dominated by fir, with spruce generally comprising less than 25% of the overstory canopy. Pure even aged spruce stands dominate the canopy from approximately 1370 m to 1800 m.
Boundarydata token from Dull, et,ol. (1988).
Mt. Mitchell
Theclimate in the Black Mountains is atypical of its southern latitude. Severe changes in elevation from surrounding terrain provides for extreme weather conditions. Annual rainfall can exceed 250 cm. Inputs from cloud interception represent a significant source of moisture for the ecosytem. Violent weather extremes such as severe winter storms with
Celo Knob Figure 2 : Extent of Spruce—Fir
ecosystem within Black
Mountain Range,
North Carolina.
snow, rime ice, high winds, and thick ice accumulations are not uncommon at these elevations. Equally volatile summer storms bring damaging winds, torrential rains and severe lightning.
Atmospheric monitoring at the site has recorded the deposition of a variety of anthropogenic air pollutants. While rain samples have not been found to be especially acidic, cloud moisture samples have recorded values below pH 3.0. Episodic ozone concentrations near 120 ppb have been recorded, with daily mean concentrations frequently exceeding 60 ppb (Bruck et al., 1987).
Field surveys characterizing the forest condition from 1983 through 1987 (Bruck et al., 1989; Bruck and Robarge, 1988) have reported the following conclusions: 1) the balsam wooly adelgid is a major factor in the rapid decline and mortality of Fraser fir; 2) significant red spruce defoliation has occurred in the Black Mountains between 1984 and 1987; 3) levels of defoliation are positively correlated with elevation; 4) data suggest that west aspect slopes suffer greater damage than east aspect stands; 5) significant reductions in radial increment began around 1960 and continue through the present; and 6) elevated levels of anthropogenic air pollutant deposition may have a role in the observed decline phenomenon.
3. METHODS
3.1 Acquisition of decline characterization data
Field data characterizing the forest decline conditions within the spruce-fir ecosystem of the Black Mountains were collected between the months of May and August 1988. A total of 21 field plots were sampled (Figure 3). Sites were stratified by high (> 1830 m) versus low elevations (< 1830 m), east versus west exposures, and high versus low damage levels. Selected sample sites were required to support a spruce-fir dominated overstory canopy exhibiting homogenous defoliation levels within a minimum stand size of one hectare. Two of the 21 field plots were improperly established and were discarded from subsequent analysis leaving a sample size of 19.
Figure 3: Approximate locations of
21 field plots.
Horse Trail
(See Appendix A for plot
UTM coordinates.)
Selected plots were permanently established as a one hectare (100 m x 100 m) square, divided into 9 equal subplots (Figure 4). Occular estimates of defoliation were collected within a 9 m x 33.3 m transect bisecting each of the nine subplots. Only overstory conifer stems having a diameter-at-breastheight (DBH) >10cm were visually rated for percent defoliation. Information recorded on all trees, both conifer and deciduous, included species, DBH (in 10 cm classes), and crown class (dominant, codominant, intermediate, or suppressed). Several measures of forest decline were derived from these data describing average damage conditions on a plot basis including percent standing dead stems, dieback, and percent defoliation. Field plot locations were also carefully recorded on 1:12000 color aerial photographs.
-camp Alice Rood
3.2 Acquisition
of digital TM and SPOT data
3.3 Forest defoliation model development
I
100 m
I
______ lOOm ______
I
—
—
---—
—
—
9 ml
____
____
Figure 4a: Design of fietd plot and inventory transects. (9m x 33.3m)
Decline levels estimoted from
visually rating the crown defoliation on all overstory stems within inventory transects.
Imagery (TM and SPOT) with acquisition dates as close to one another as possible were needed so that differences
in sun angles and vegetative growth conditions would not complicate the comparison between the two data sets. Previous forest decline modeling efforts within the Black Mountains had utilized a Landsat TM scene acquired on September 28, 1988. A search of available SPOT imagery acquired near this date indicated that cloud coverage precluded their use in this research.
Near simultaneous cloud free TM and SPOT data over the study site were not available during the spring or summer of 1988. Winter TM and SPOT imagery, however, were identified which met the temporal and cloud coverage constraints required for the completion of this work. The TM scene selected was acquired on January 18, 1989 while the SPOT data was collected on February 12, 1989. A window of data defining the study site within the TM and SPOT data was extracted and registered to a Universal Transverse Mercator projection system. DEM data was also acquired, registered, and resampled to correspond to each of the two satellite data sets.
Previous research had shown that defoliation levels were highly correlated with elevation and the MR waveband (Band 4) of the Landsat TM (Khorram, 1990). Thus, investigation of the 1989 winter imagery focused on the analysis of the MR wavebands of the TM and SPOT sensors. Digital elevation data were also included in the analysis due to the a knowledge regarding the relationship between defoliation and elevation.
Aerial photography and the UTM coordinates defining the center of each of the field plots were used to locate these sites within the digital TM and SPOT data. A 3 x 3 kernal of pixels surrounding the center of each plot was extracted from the TM band 4 data. Digital numbers for these nine pixels were used to derive an average value for each plot. A similar approach was taken with the SPOT band 3 data. However, a 5 x 5kernalof pixels was used to characterize each plot as opposed to the 3 x 3 kernal utilized with the TM data. The difference in kernal sizes is directly related to the spatial resolution of the two sensors and the number of pixels required to encompass a one ha sized field plot.
TM Band 4 50
40
-H--30
4-20
4-10
0
0 20 40 60 80 100
Percent Defoliation
Figure 5a. Defoliation (%) vs. TM D4
Spot Band 3 50
40- 44
4- 4-
4-4-
4-t4-
4-4-30 4-
4-20
4-10
C •
-0 20 40 60 80 100
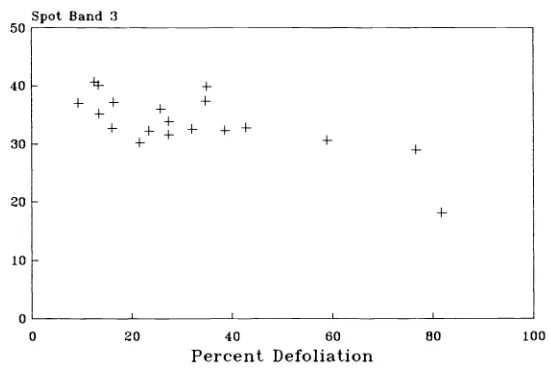
Percent Defoliation
Figure 5b Defoliation (%) vs. SPOT 83.
Preliminary regression analysis began with the evaluation of the use of TM band 4 or SPOT band 3 as single independent variables within a model predicting percent defoliation. Both the intercept and slope parameter coefficients were significant to the models at the 0.05 level. Model R2 for the TM band 4 regression equation was 0.75 and 0.55 for the SPOT band 3 equation. The form of the models were as follows:
Defoliation = 112.75 - 2.46 * (TM band 4) (1) Defoliation = 132.64 -2.99 * (SPOT band 3) (2)
Earlier research had demonstrated the importance of topographic position as an independent variable in modeling defoliation within this ecosystem. Model R2 increased from 0.75 to 0.87 when elevation was added as an independent variable to the model along with TM band 4, while RMSE decreased to 7.77 from 10.46. A larger increase in R was observed in the SPOT defoliation regression equation when elevation was added to the model than was seen in the TM
analysis, 0.55 to 0.80. RMSE was reduced from 14.29 to 9.90. Both slope parameter coefficients (TM or SPOT
waveband and elevation) as well as the intercepts were significant to the models at the 0.05 level. The form of the models were as follows:
Defoliation = 39.42 - 2.09 *
('fl
band 4) +0.28 *(elev.) (3) Defoliation = 34.51
-
2.60 * (SPOT band 3) +0.39 * (elev.) (4)4. Summary
SPOT NIR digital data have been shown to be significantly correlated with percent defoliation in the spruce-fir ecosystem of the Black Mountain Range of the southern Appalachians. The relationship between these variables, as defoliation increases MR reflectance decreases, is very similar to that observed between TM NIR data and defoliation for the same time of year. However, neither SPOT or TM MR wáveband data were found to reliable indicators of defoliation by themselves. The addition of a topographic position variable, in this case elevation, in such a model significantly
improved the predictive reliability of the model.
Linear regression parameter coefficients were found to be very similar between the TM and SPOT based models. This indicates that the two models are behaving in a similar manner. Model R2's were higher for the TM based regression equations than for the SPOT equations, 0.87 and 0.75 respectively. The small sample size (19) of this study did not, however, allow the investigators to conclude that TM data are significantly better for assessing defoliation conditions within
this ecosystem than SPOT data.
5. REFERENCES
1. J. A. Brockhaus, M. Campbell, R. Bruck and S. Khorram, "Analysis of Forest Decline in the Southern Appalachians With TM Data," Proceedings Of The 1989 ACSM-ASPRS Annual Convention, vol. 1, pp. 227-236, Baltimore, Maryland, April, 1989.
2. R. I. Bruck, "Decline of Montane Boreal Ecosystems in Central Europe and the Southern Appalachian Mountains," Proceedings Q.[ TAPPI Research Development Conference, pp. 159-163, Atlanta, Georgia, September, 1984.
3. R. I. Bruck, W. P. Robarge, S. Khorram, R. Bradow, W. Cure, S. Modema, J. A. Brockhaus, A. H. McDaniel, P. Smithson, "Observations of Forest Decline in the Boreal Montane Ecosystem of Mt. Mitchell, North Caroline -An
Integrated Forest Response Approach," Proceedings Qf
[ US-FRG
Symposium Q
Forest Decline, pp. 176-203,Burlington, Vermont, October, 1987.
4. R. I. Bruck and W. P. Robarge, "Change in Forest Structure in the Boreal Montane Ecosystem of Mount Mitchell, North Carolina," European Journal of Forest Pathology, vol. 18, pp. 357-366, 1988.
5. R. I. Bruck, "Survey of Diseases and Insects of Fraser Fir and Red Spruce in the Southern Appalachian Mountains," European Journal of Forest Pathology, vol. 19, pp. 389-398, 1988.
6. R. I. Bruck, W. P. Robarge, and A. H. McDaniel, "Forest Decline in the Boreal Montane Ecosytems of the Southern Appalachian Mountains," Water, Air, and Soil Pollution, vol. 48, pp. 161-180, 1989.
7. C. W. Dull, J. D. Ward, H. D. Brown, G. W. Ryan, W. H. Clerke, and R. J. Uhler, "Evaluation of Spruce and Fir Mortality in the southern Appalachian Mountains," Project Report R8-PR, USDA Forest Service, Southern Region, Atlanta, Georgia, 92 p., 1988.
8. P. Duinker and S. Nilsson, "Summary of the Seminar on Remote Sensing and Forest Decline," Proceedings: Seminar QflRemote Sensing QfForest
Decline Attributed [ Pollution, pp. 1-13, Laxenburg, Austria, 1988.
9. A. H. Johnson, "Red Spruce Decline in the Northeastern U.S.: Hypotheses Regarding the Role of Acid Rain," Journal of the Air Pollution Cøntrol Association, vol. 33, no. 11, pp 1049-1054, 1983.
10. A. H. Johnson and T. G. Siccama, "Acid Deposition and Forest Decline," Environmental Science and Technology, vol. 17, no. 7, pp. 294-305, 1983.
11. S. Khorram, J. A. Brockhaus, R. I. Bruck, and M. V. Campbell, "Modelling and Multitemporal Evaluation of Forest Decline with Landsat TM Digital Data," IEEE Transactions on Geoscience and Remote Sensing, vol. GE-28, no. 4, pp. 746-748, 1990.
12. S. McLaughlin, "Effects of Air Pollution on Forests: A Critical Review," Journal of the Air Pollution Control Association, vol. 35, no. 5, pp. 512-534, 1985.