Effect of Local Aggregate and Silica Fume on the Creep of High Performance
Concrete – A Comparison with ACI and LRFD Models
Ahmed B. Shuraim1, Raja Rizwan Hussain2, Fahid Aslam3, Abdulrahman Alhozaimy4 and
Mohammad Mousa Al-humaiqani5
1 Professor, Department of Civil Engineering, King Saud University, Riyadh, Saudi Arabia
2 Assistant Professor, CoE-CRT, Department of Civil Engineering, King Saud University, Riyadh, Saudi
Arabia, e-mail: raja386@hotmail.com, Tel: +966590011078.
3 Ph.D Candidate, Dept. of Civil Engineering, King Saud University, Riyadh, Saudi Arabia 4 Professor, Dept. of Civil Engineering, King Saud University, Riyadh, Saudi Arabia 5 Graduate Student, Dept. of Civil Engineering, King Saud University, Riyadh, Saudi Arabia
ABSTRACT
This paper presents an investigation on the creep of high performance and high strength concrete (HPC) for three types of locally available aggregate sources with and without the effect of silica fume as a supplementary cementitious material. Experiments were carried out under controlled laboratory conditions and all other parameters were kept constant in all the mixtures except the coarse aggregate type with and without silica fume as partial cement replacement. Through this investigation, it was observed that it is desirable to determine experimentally the creep coefficient of HPC when local aggregates are used for a specified HPC mixture with a corresponding supplementary cementitious material. The experiment results were compared with LRFD (2002, 2007) and ACI 209 prediction models. The comparison showed that the above mentioned models should be enhanced for accurate prediction of the creep of high performance concrete for the effect of local Saudi Arabian aggregate with and without the use of silica fume as supplementary cementitious material. This investigation was prompted by concern because of the ever demanding requirement of the construction projects to use the locally available aggregate for economic reasons and supplementary cementitious materials to enhance specific properties of HPC mixtures. An assessment of the need for an aggregate based modification to the models for creep coefficient of HPC incorporating the effect of local aggregate with and without the use of silica fume is also proposed. Experiments performed in this research demonstrated that the type of aggregate and its combination with a supplementary cementitious material would have significant influence on the time-dependent characteristics of HPC. It is therefore recommended to use the appropriate values for creep coefficient of a particular HPC mixture based on the locally available aggregates in a particular specific area. In the absence of such values, however, the creep coefficient may be calculated using the experimental curves presented in this paper.
Key words: Creep; high performance concrete; local aggregate; silica fume; experimentation; prediction models
INTRODUCTION
of concrete. Creep is defined as deformation of a structure under sustained load. A long term pressure or stress on concrete can make it change shape. This deformation usually occurs in the direction the force is being applied. Creep coefficient, the ratio of the creep strain to the initial elastic (instantaneous) strain due to a sustained stress, is commonly used as a measurement for creep deformation (Xiaoming et. al., 2001).
As the properties of aggregate materials change from one location to another, it would be desirable to experimentally determine the material properties of high performance concrete with a specified mix design incorporating local aggregates and supplementary cementitious materials. It has been recognized that the mechanical properties of HPC are not only a function of compressive strength of concrete, but also of the type of coarse aggregates and the content percentage of coarse aggregate in the mixture (Mehmet et. al., 2004; Wegen and Bijen, 1985). It is observed from the past research (Gholamreza et. al., 2011; Domingo et. al., 2009; Andrzej and Alina, 2002; Xiaoming et. al., 2001; Ballim, 2000; Ben and Rasiah, 1997; Alexander, 1996; Davis and Alexander, 1992; Wegen and Bijen, 1985; Jaroslav, 1979) that nature of coarse aggregate can influence the creep of concrete. However, so far this effect is only partially and indirectly accounted for in commonly used design methods for creep of HPC. Also, no research was found pertaining to the effect of local naturally available aggregates under consideration for this research with and without their interaction with silica fume (micro-silica) as a supplementary cementitious material. This investigation was prompted by concern because of the ever demanding requirement of the construction projects to use the locally available aggregate for economic reasons and supplementary cementitious materials to improve specific properties of HPC. Generally HPC mixes contains lower water-binder ratio ranging 0.25-0.40 and super plasticizers are used to achieve good workability. Moreover, supplementary cementitious materials are integral part of high strength and high performance concrete (Aïtcin, 2007). Mazloom and Brooks (2005) derived that the total and basic creep decreased with the increase of silica fume content. It is also known that the creep for high strength concrete is much lesser than that of normal strength concrete. Therefore, the objective of this investigation is to determine the influence of coarse aggregate type with and without the presence of silica fume on the creep of HPC by laboratory controlled experimentation and to investigate the authenticity of prediction equations and procedures involved therein. The research approach of this paper comprises of: 1) to select the HPC mixtures using local natural materials; 2) to perform experiments on the creep of HPC; 3) to check the authenticity of the prediction equations for creep; and 4) to propose the recommendations for the enhancement of prediction models. The nature of results generated in this investigation has presented an opportunity to assess the effects of coarse aggregate type on the estimation of creep of HPC.
EXPERIMENTAL PROGRAM
Materials and Mix Proportions
This section contains the material properties of HPC ingredients, mix design as per ACI 211.4 and procedures for creep testing of high performance concrete. Type I ordinary Portland cement in compliance with the requirements of ASTM C150 has been used. Table 1 shows the chemical composition and physical characteristics of the cement. The water-to-cement ratio (w/c) of 0.30 was held constant throughout the experimental program so that the effect of local aggregate with and without silica fume can be revealed. Standard laboratory curing conditions were used where the standard cylindrical specimens in the molds were stored in the laboratory environment at standard room temperature for the first 24 h followed by de-molding and then moist cured under standard conditions until the age of testing.
some Biotite contamination and Schist layers, especially in the cracks. Aggregate ‘MK’ is also Quartz but with the additions of Plagioclase and chlorite minerals. It also contains chunks of feldspar here and there in its geometrical formation. The third type of aggregate named ‘RY’ in this paper is the most commonly used local aggregate, primarily used in the central region of Saudi Arabia and is composed of limestone, also known as calcium carbonate. Silica fume (micro silica) used in this study as 10% cement replacement complies with the requirement of ASTM C 1240-05. Chemical composition and physical characteristics of micro silica are listed in Table 2. A super plasticizer (Glenium 51, a product of the BASF company) made of polycarboxylic ether was employed as chemical admixture to achieve slump of 175 ± 25 mm, measured according to ASTM C 143/C 143M. Glenium is an innovative admixture based on modified polycarboxylic ether (PCE) polymers. It complies with EN 934 part 2 and is compatible with all types of cement. The relative specific gravity of this admixture was almost 1.1.
Table 1 Chemical composition and physical characteristics of cement (OPC type-I)
Chemical
Composition (mass %) Physical characteristics
SiO2 19.96 Specific gravity 3.15
Al2O3 5.99 Consistency 23.7%
Fe2O3 3.59 Initial setting time 50 mins
CaO 62.75 Final setting time 350 mins
MgO 0.59
SO3 2.73
Alkalies 0.2
C3S 50.6
C2S 19.1
C3A 9.8
C4AF 10.9
Table 2 Chemical composition and physical characteristics of micro silica
Chemical
Composition (mass %) Physical characteristics
(SiO2) 93.2 Specific gravity 2.27
(Al2O3) <0.01 Density (mg/m3) 2.13
(Fe2O3) 0.05 Moisture content % 0.20
(CaO) 0.72
(MgO) 0.14
(SO3) <0.01
(Cl) 0.03
(Na2O) 0.07
(K2O) 0.15
Loss on Ignition @ 950 oC 5.4
17 . 0 ) 0658 (
&
2 2
= + k o O
Na Alkalies Available
others compounds
Fig. 1 Gradation of CR sand
Fig. 2 Gradation of RN sand
Fig. 4 Gradation of RY aggregate
Fig. 5 Gradation of MK aggregate
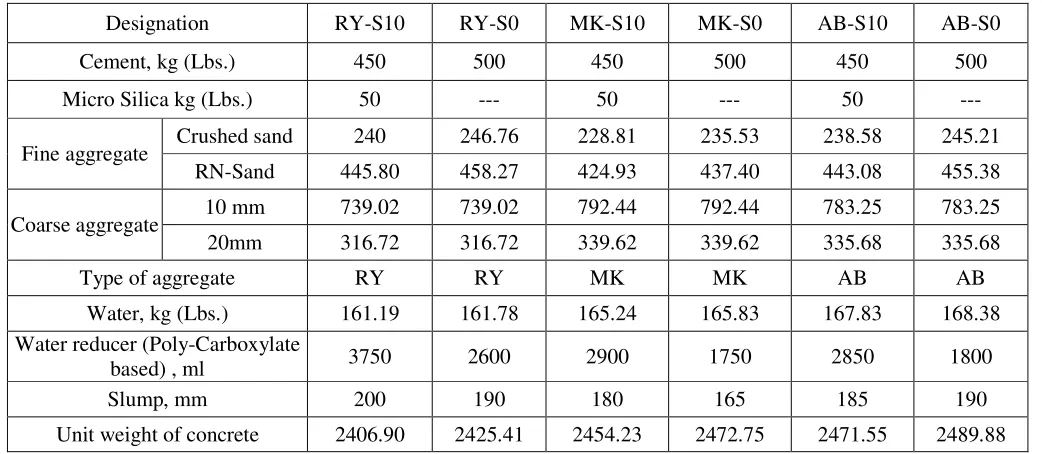
Table 3 contains the material properties of HPC ingredients used in this research. The gradation of each type of fine aggregate is shown in Fig. 1 & 2. The gradation of the combination of CR and RN sand with a ratio of 35%-65% respectively which gave a fineness modulus of 2.74 in compliance with the ASTM C 136 is shown in Table 4 and Fig. 3. The gradation of coarse aggregate is shown in Figs. 4 through 6 respectively. Table 5 shows concrete mix proportions for HPC used in this research.
Table 3 Aggregate Material Properties
Tests AB
20mm AB 10mm RY 20mm RY 10mm MK 20mm MK 10mm CR Sand RN Sand Oven dry SP. gravity 2.74 2.72 2.58 2.58 2.67 2.68 2.60 2.61 SSD SP. Gravity 2.77 2.76 2.61 2.62 2.70 2.73 2.63 2.63 Apparent sp. gravity 2.81 2.86 2.66 2.67 2.75 2.80 2.67 2.67 Absorption 0.85 1.82 1.10 1.30 1.15 1.55 1.43 0.93 Moisture content 0.17 0.32 0.32 0.59 0.49 0.36 0.55 0.15 Unit weight (Loose) 1477.54 1539.09 1419.32 1430.71 1528.49 1539.57 1438.38 1611.85 Unit weight (Dense) 1623.11 1683.61 1550.33 1575.22 1681.34 1683.61 1604.63 1720.27 %voids (Loose) 45.05 43.20 44.91 44.48 42.60 42.53 44.48 38.06 %voids (Dense) 40.74 37.87 39.83 38.87 36.86 37.13 38.06 33.89 Fineness modulus
35%CR+65%RN --- --- --- ---- --- --- 2.74
Chemical Composition 1. Quartz 2. Biotite 3. Schist 4. Metasediment Lime stone CaCO3
5. 1. Quartz 2. Plagioclase
3. Chlorite 4. feldspar
----
Table 4 Sieve analysis of combination of CR & RN Sand based on ASTM C 136
Sieve Size No. (mm)
Weight Retained (gm) Amount Retained (%) Cumulative Amount Retained (%) Cumulative Amount Passing (%) ASTM Grading limits Passing
3/8” 9.5 0 0 0 100 100
# 4 4.75 5.8 1.16 1.16 98.84 95-100
# 8 2.36 98 19.6 20.76 79.24 80-100
# 16 1.18 73.7 14.74 35.5 64.5 50-85
# 30 0.6 52 10.4 45.9 54.1 25-60
# 50 0.3 139.4 27.88 73.78 26.22 10--30
# 100 0.15 114.5 22.9 96.68 3.32 2--10
#200 0.08 15 3 99.68 0.32 -
Table 5 HPC Mixture Proportions
Designation RY-S10 RY-S0 MK-S10 MK-S0 AB-S10 AB-S0
Cement, kg (Lbs.) 450 500 450 500 450 500
Micro Silica kg (Lbs.) 50 --- 50 --- 50 ---
Fine aggregate Crushed sand 240 246.76 228.81 235.53 238.58 245.21 RN-Sand 445.80 458.27 424.93 437.40 443.08 455.38
Coarse aggregate 10 mm 739.02 739.02 792.44 792.44 783.25 783.25 20mm 316.72 316.72 339.62 339.62 335.68 335.68
Type of aggregate RY RY MK MK AB AB
Water, kg (Lbs.) 161.19 161.78 165.24 165.83 167.83 168.38 Water reducer (Poly-Carboxylate
based) , ml 3750 2600 2900 1750 2850 1800
Slump, mm 200 190 180 165 185 190
Unit weight of concrete 2406.90 2425.41 2454.23 2472.75 2471.55 2489.88
Hardened Concrete Test Setup
The test procedure followed the guidelines of the ASTM Standard C 512. The rigid frames with a capacity to withstand the applied load were designed. It consisted of the header plates bearing on the ends of the loaded specimens, a hydraulic ram for applying the load and threaded rods to equilibrate the compression applied to the creep specimens The frames made it possible to test simultaneously three cylindrical specimens arranged in series. The creep specimens were 150 φ x 300 mm (6 φ x 12 in.) cylinders.
All creep testing frames were placed in an isolated environmental chamber, with an average room temperature of 25+5 °C and an average relative humidity of 38+10 %. For creep testing the specimens were loaded at the age of 14 days under constant load corresponding to 40% of ultimate compressive strength of each specimen. To have constant loading six hydraulic jacks were used. Each hydraulic jack was fixed with every single creep setup. The load was frequently monitored and it was made sure that it did not fall more than 2% below its initial value. Since the specimens were not sealed, the deformations measured were shrinkage (autogenous and dried) and creep (basic and dried), in addition to the elastic strain. In order to compensate for that, shrinkage specimens were also cast using the identical cylindrical specimen molds and cured under the same laboratory conditions as corresponding to the creep specimens. The creep and shrinkage specimens were place under same laboratory conditions so that the creep strains can be calculated as equal to the total time-effect strain obtained under sustained load minus the average strain of shrinkage specimens.
Tests for the compressive strength of concrete were also carried out as per ASTM C39. This was needed for the creep evaluation of concrete. The specimens for the compressive strength of concrete were also 150 φ x 300 mm (6 φ x 12 in.) cylinders. The specimens were water cured throughout the age of
Fig. 7 Loaded Specimens in Creep Setup
Fig. 8 Cylindrical Specimens of 150 φ x 300 mm (6 φ x 12 in.) and the Demec gauge
Table 6 Compressive Strength Test Results
Specimen age (days)
RY-S10 MPa (ksi)
RY-S0 MPa (ksi)
MK-S10 MPa (ksi)
MK-S0 MPa (ksi)
AB-S10 MPa (ksi)
Test Measurement System
The measurement system was made up of electronic and manual devices that measured and registered the deformation, load, temperature and humidity values. The electronic deformation measurement due to creep and shrinkage was made by means of strain gauges, arranged in equidistant generatrix. All the instruments were connected to data acquisition modules, with multiple channels per module, so as to periodically register the measurements in real time. In addition to that, manual checks were also conducted to ensure accurate measurement of the strains involving the use of demec gauge and demec points system. This was done to ensure the reliability and reproducibility of strain measurements. To measure the strain manually, the demountable mechanical Demec gauge points were attached on each cylinder 120 degree apart from each other at a fixed gauge length of 250mm. The manual readings were taken at 7 days interval. Automatic continuous measurements were taken with the use of electrical strain gauges connected to the concrete cylinders and electronic digital data logger at a regular interval of 1 hour for first week and 8 hours interval for the remaining loading period.
RESULTS AND DISCUSSIONS
Test results for the average creep coefficient for the six HPC mix specimens are presented in Fig. 9 (a)-(f). The measured creep coefficients for HPC developed rapidly at an early age with approximately 80% of maximum creep coefficient coming during the first two months and became less varying after a period of about 3 months. The test data in each of the six groups is discussed in detail in this section. HPC creep specimens in these six groups were loaded in creep frames after being moist cured for 14 days with 3 aggregate sources with and without 10% silica fume cement replacement as supplementary cementitious material. The creep coefficients were determined by dividing the net measured creep strains by measured elastic strains. It can be seen from the test data that the shrinkage strains and creep coefficients vary nonlinearly with time.
Fig. 9 (a) Aggregate RY Fig. 9 (b) Aggregate MK
0.0 0.2 0.4 0.6 0.8 1.0 1.2
0 25 50 75 100 125 150
C
re
ep
C
oe
ff
ic
ie
nt
Time (Days)
RY-S10 RY-S0
0.0 0.2 0.4 0.6 0.8 1.0 1.2
0 25 50 75 100 125 150
C
re
ep
C
oe
ff
ic
ie
nt
Time (Days)
Fig. 9 (c) Aggregate AB Fig.9 (d) Comparison of RY, MK and AB without S
Fig. 9(e) Comparison of RY, MK, AB with S Fig. 9 (f) Comparison of all mixes
Fig. 9 Creep Test Experiment Results
It can be seen from the experiment results in Fig. 9 (a), (b) and (c) that 10% silica fume cement replacement reduces the creep of concrete in general. However, the decrease in the creep of concrete is not uniform for all the three types of coarse aggregate. Aggregate ‘AB’ shows the maximum reduction in creep by the use of silica fume which is more than one 100 percent. The amount of creep in case of aggregate ‘AB’ without silica fume is almost double the amount of creep observed in case of this type of coarse aggregate with silica fume. It is uncommon and interesting to observe this much decrease in creep by the use of a supplementary cementitious material such as silica fume and should be further investigated by varying the amount of silica fume in HPC mixtures as scope for future research. Aggregate ‘RY’ also shows a similar decrease in the creep with the use of silica fume as 10% cement replacement by lags behind ‘AB’
0.0 0.2 0.4 0.6 0.8 1.0 1.2 1.4
0 25 50 75 100 125 150
C re ep C oe ff ic ie nt Time (Days) AB-S10 AB-S0 0.0 0.2 0.4 0.6 0.8 1.0 1.2 1.4
0 25 50 75 100 125
C re ep C oe ff ic ie nt Time (days) RY-S0 MK-S0 AB-S0 0.0 0.2 0.4 0.6 0.8 1.0 1.2 1.4
0 25 50 75 100 125 150
C re ep C oe ff ic ie nt Time (days) RY-S10 MK-S10 AB-S10 0 0.2 0.4 0.6 0.8 1 1.2 1.4
0 25 50 75 100 125 150
aggregate. The aggregate ‘MK’ shows the lowest benefit from silica fume with least reduction in the creep coefficient of the order of 30%. Therefore, it can be concluded that the beneficial effect of silica fume cement replacement as supplementary cementitious material on the creep of HPC varies non-linearly with the coarse aggregate type.
The experiment data in Fig. 9 (d) shows that the effect of coarse aggregate source and type on the magnitude of creep coefficient is not constant. The aggregate ‘AB’ shows the highest creep coefficient followed by the aggregate type ‘RY’ and ‘MK’. However, the trend is different when silica fume is used as shown in Fig. 9 (e). In this case, the aggregate source ‘MK’ is showing the highest creep coefficient followed by the aggregate ‘RY’ and ‘AB’ which seem to be closely following each other. Also, it can be noticed from the comparison graph in Fig. 9 (f) that the range of creep coefficient variation with respect to the coarse aggregate type is more when silica fume is not used. This means that the addition of supplementary cementitious materials has a confining effect on the variation in creep coefficient originating from the variation in coarse aggregate properties.
Aggregate affects the creep of concrete indirectly as it undergoes little creep itself. It is actually the paste which is responsible for the creep. However, the aggregate influences the creep of concrete through a restraining effect on the magnitude of creep. The paste which is creeping under load is restrained by aggregate which does not creep. The stronger the aggregate the more is the restraining effect and hence the less is the magnitude of creep and vice versa. The shape, texture, modulus of elasticity, strength, gradation, chemical composition and absorption characteristics of coarse aggregates result in the variation of creep coefficient for HPC. Therefore, based on the experimental tests carried out in this paper, it is possible to conclude that the properties of coarse aggregate and supplementary cementitious material used in this study does affect the creep of HPC to an appreciable extent. Experiments performed in this research demonstrated that the type of aggregate with and without silica fume would have significant influence on the time-dependent characteristics of HPC.
COMPARISON OF EXPERIMENT RESULTS WITH MODEL ANALYSIS (ACI209R-92 AND AASHTO LRFD SPECIFICATIONS 2002 AND 2007)
The experiment results were compared with the values obtained analytically by using prediction models of ACI and LRFD. Summary of these prediction models is presented in this paper for the ready reference and understanding of the reader. For details, refer to the corresponding references of ACI209R-92 and LRFD specifications 2002, 2007. The variables used in the models are those related to the control mixtures and the parameters of each model are those recommended by their authorities. The prediction equations for creep coefficient as per ACI 209R-92 are given Table 7.
Table 7 ACI and AASHTO prediction Equations (SI units, MPa, mm)
ACI 209R-92
(2005) , = 2.35. − .
10 + − .
= . . .
Eq. 1
= 1.25. .; = 1.27 − 0.0067 !"; = 0.82 + 0.00264 %, % is slump in mm; = 0.88 + 0.0024 &, & is fine to total aggregate ratio; = 0.46 + 0.09(, concrete air content ratio; =)*. +1 + 1.13. ,.)* ⁄ . AASHTO
LRFD 2002 , = 3.5//011.58 −1202 !" . − .
10 + − .
/0= 1
0.6 + 134 632
/ = 5
26. ,.6) ⁄ +
45 +
7. 81.80 + 1.77,2.587.)* ⁄ 9
Eq. 2
AASHTO
LRFD 2007 , = 1.9///0/:; . / = 1.45 − 0.0051< =⁄ ≥ 1.0
/ = 1.56 − 0.008 !"
/0 = 5
1 + 3?4 7 @ /:;= A61 − 0.583 − B
?4 + − C
Eq. 3
= loading age, days; </= = volume to surface area ratio, mm
3?4 is the specified compressive strength (MPa) of concrete at the age of loading.; !"= relative humidity (%)
It should be noted that although the LRFD 2007 does not take into account the effect of silica fume in the model, it provides a better match with the experiment results incorporating silica fume as the HPC specimens with silica fume have higher compressive strengths. Therefore, it can be said that even though the compressive strength of concrete is taken into considerations in these formulas, the adopted relation may not be appropriate for all ranges of concrete strengths and varies with the specification of HPC mixtures.
Fig. 10 (a) Comparison for Aggregate RY with silica fume
Fig. 10 (b) Comparison for Aggregate RY without silica fume 0.0
0.2 0.4 0.6 0.8 1.0 1.2 1.4
0 25 50 75 100 125 150
C
re
ep
C
oe
ff
ic
ie
nt
Time (Days)
Exp. ACI 209
LRFD 2002 LRFD 2007
0.0 0.2 0.4 0.6 0.8 1.0 1.2 1.4
0 25 50 75 100 125 150
C
re
ep
C
oe
ff
ic
ie
nt
Time (Days)
Exp. ACI 209
Fig. 10 (c) Comparison for Aggregate MK with silica fume
Fig. 10 (d) Comparison for Aggregate MK without silica fume 0.0
0.2 0.4 0.6 0.8 1.0 1.2 1.4 1.6
0 25 50 75 100 125 150
C
re
ep
C
oe
ff
ic
ie
nt
Time (Days)
Exp. ACI 209
LRFD 2002 LRFD 2007
0.0 0.2 0.4 0.6 0.8 1.0 1.2 1.4 1.6
0 25 50 75 100 125 150
C
re
ep
C
o-ef
fi
ci
en
t
Time (Days)
Exp. ACI
Fig. 10 (e) Comparison for Aggregate AB with silica fume
Fig. 10 (f) Comparison for Aggregate AB without silica fume 0.0
0.2 0.4 0.6 0.8 1.0 1.2 1.4 1.6
0 25 50 75 100 125 150
C
re
ep
C
o-ef
fi
ci
en
t
Time (Days)
ACI 209 Exp.
LRFD 2002 LRFD 2007
0.0 0.2 0.4 0.6 0.8 1.0 1.2 1.4 1.6
0 25 50 75 100 125 150
C
re
ep
C
oe
ff
ic
ie
nt
Time (Days)
Exp. ACI 209
Fig. 10 (g) Comparison for all the mixes with silica fume
Fig. 10 (h) Comparison for all the mixes without silica fume
Figure 10 Comparison of Experiment Results with ACI 209 and LRFD Model Analyses 0.0
0.2 0.4 0.6 0.8 1.0 1.2 1.4 1.6
0 25 50 75 100 125 150
C
re
ep
C
oe
ff
ic
ie
nt
Time (Days)
AB Exp. MK Exp. RY Exp.
ACI RY ACI MK ACI AB
LRFD 2002 RY LRFD 2002 MK LRFD 2002 AB
LRFD 2007 RY LRFD 2007 MK LRFD 2007 AB
0.0 0.2 0.4 0.6 0.8 1.0 1.2 1.4 1.6
0 25 50 75 100 125 150
C
re
ep
C
oe
ff
ic
ie
nt
Time (Days)
AB Exp. MK Exp. RY Exp.
ACI RY ACI MK ACI AB
LRFD 2002 RY LRFD 2002 MK LRFD 2002 AB
Enhanced equations of creep coefficients modified from the ACI 209 and LRFD equations for varying coarse aggregate type with and without silica fume are needed. The modified equations should take into account the effects of the nature of coarse aggregate that would allow designers to conveniently get reliable information on the creep of HPC developed by the use of local aggregate in a specific area and a specific supplementary cementitious material. It can be seen from Fig. 10 (a) that the model predictions from ACI 209 and LRFD under estimate during the initial age of HPC specimen. Afterwards, the trend becomes opposite and the models start over estimating the creep coefficient of HPC with the increase in the age of concrete. However, LRFD 2007 better predicts the experiment results in comparison to LRFD 2002 and ACI 209 models due to the above said reasons. Similar trend can be seen in Fig. 10 (b) for aggregate ‘RY’ without incorporating silica fume. However, the under estimation in the ACI 209 and LRFD 2002 models during the initial age of testing extends to almost two times the time duration compared to the trend in Fig. 10 (a) and the LRFD 2007 model shows under estimation throughout the age of testing for HPC specimens without silica fume replacement, probably due to the relatively lower compressive strength of concrete under consideration in Fig. 10 (b). This means that the ACI 209 and LRFD 2002 model prediction follows closer to the experiments results of mixtures without silica fume replacement and lags farther apart from the experiment results of HPC mixtures for LRFD 2007. The effect of silica fume adds on top of the effect of coarse aggregate in comparison to the model analysis. A similar observation can be seen in case of aggregate ‘MK’ in Fig. 10 (c)-(d) and aggregate ‘AB’ in Fig. 10 (e)-(f). It is interesting to note that in case of Fig. 10(f) presenting the experiment results of aggregate ‘AB’ without silica fume, the ACI 209 and LRFD 2007 models do not seem to overestimate the experiment results at the later age of testing in comparison to LRFD 2002 model which still shows overestimation at the later age even for this case of aggregate source. In general, it is clear from the experiment results that the prediction models should account for the effect of aggregate source and supplementary cementitious materials for HPC creep estimation.
Fig. 10 (g) shows the comparison of model analysis and experiment results for all aggregate mixes incorporating silica fume. It can be seen that the highest creep coefficient is given by the LRFD 2002 model for ‘AB’ aggregate. On the other hand, the highest creep coefficient given by the experiment results is from aggregate ‘MK’. Similarly the lowest creep coefficient obtained through the experiment results is from the aggregate ‘AB’. While, the lowest predicted creep coefficient is from the LRFD 2007 model for aggregate ‘MK’. Similar trends can be observed from Fig. 10 (h) for all aggregate sources without silica fume. Overall, the highest creep coefficient of 1.52 given by the model prediction is almost 3 times higher than the lowest creep coefficient of 0.58 given by the experiment results. This clearly gives an assessment for the need for an aggregate and supplementary cementitious material based modification to the models for creep coefficient of HPC incorporating the effect of local aggregate variations with and without the use of supplementary cementitious materials.
CONCLUSIONS
coefficient variation with respect to the coarse aggregate type is less when silica fume is used as a supplementary cementitious material. It is speculated that the shape, texture, modulus of elasticity, strength, surface area, gradation, chemical composition, absorption characteristics of coarse aggregates and the use of supplementary cementitious materials result in the variation of creep coefficient for HPC. Based on the experimental tests carried out in this paper, it is possible to conclude that the properties of coarse aggregate used in this study with and without the use of supplementary cementitious materials do affect the creep of HPC to an appreciable extent.
New equations of creep coefficients modified from the ACI 209 and LRFD equations for varying coarse aggregate type with and without the use of silica fume are needed. The improved equations should take into account the effects of the nature of coarse aggregate and supplementary cementitious materials that would allow designers to conveniently get reliable information on the creep of HPC developed by the use of mixture specific materials. The values of creep coefficients of HPC were based on the use of local materials. Experiments performed in this research demonstrated that the type of coarse aggregate would have significant influence on the time dependent characteristics of HPC. It is therefore recommended to use the appropriate values for creep coefficient of HPC that are based on the locally available aggregates and supplementary cementitious materials in a particular specific area. In the absence of such values or corresponding enhanced prediction models, however, the creep coefficient may be calculated using the experimental curves presented in this paper.
ACKNOWLEDGEMENT
This research is supported by the National Plan for Science and Technology at King Saud University, Project No. 08-ADV208-02.
References
AASHTO LRFD Bridge Design Specifications, American Association of State Highway and Transportation Officials, Load and Resistance Factor Design, 4th Edition 2007, Washington D.C, USA.
AASHTO LRFD Bridge Construction Specifications, American Association of State Highway and Transportation Officials, Load and Resistance Factor Design, 2002, Washington D.C, USA.
ACI Committee 209, “Prediction of Creep, Shrinkage, and Temperature Effects in Concrete Structures (ACI 209R-92),” ACI Manual of Concrete Practice, American Concrete Institute, Farmington Hills, Mich., 1992.
A. Domingo-Cabo, C. Lázaro, F. López-Gayarre, M.A. Serrano-López, P. Serna, J.O. Castaño-Tabares, “Creep and shrinkage of recycled aggregate concrete”, Construction and Building Materials, Vol. 23 (2009) pp. 2545–2553.
Andrzej Ajdukiewicz and Alina Kliszczewicz, “Influence of recycled aggregates on mechanical properties of HS/HPC”, Cement and Concrete Composites, Vol. 24, Issue 2, April 2002, pp. 269-279.
ACI 211.4, “Guide for Selecting Proportions for High-Strength Concrete Using Portland Cement and Other Cementitious Materials”, 2008, ACI Committee 211, USA.
ASTM C150 / C150M - 12 “Standard Specification for Portland Cement”, American Society for Testing and Materials, USA.
ASTM C 1240-05 “Standard Specification for Silica Fumes”, American Society for Testing and Materials, USA.
ASTM C512-87 / C512M – 10, “Standard Test Method for Creep of Concrete in Compression”, American Society for Testing and Materials, 2002, USA.
ASTM C136 – 06, “Standard Test Method for Sieve Analysis of Fine and Coarse Aggregates” American Society for Testing and Materials, USA.
ASTM C143 / C143M – 12, “Standard Test Method for Slump of Hydraulic-Cement Concrete” American Society for Testing and Materials, USA.
ACI Committee 318, “Building Code Requirements for Reinforced Concrete (ACI 318-89) and Commentary (318R-89),” American Concrete Institute, Farmington Hills, Mich., 1989, 353 pp.
ACI Committee 363, “State-of-the-Art Report on High-Strength Concrete (ACI 363R-92),” American Concrete Institute, Farmington Hills, Mich., 1992, 55 pp.
Aïtcin P. C., “High-Performance Concrete (Modern Concrete Technology)”, Taylor and Francis, 2007.
Aïtcin P.C. and Neville A. M, “High-performance concrete demystified”, Concrete International, Vol. 15, Issue 1, 1993, pp. 21–26.
Benson Shing, P., and Alexandra Kottari, Evaluation of Long-Term Prestress Losses in Post-Tensioned Box-Girder Bridges, Final Report submitted to the California Department of Transportation under Contract No. 59A0420, Department of Structural Engineering, University of California, San Diego, La Jolla, California 92093-0085, USA, Report No. SSRP–11/02, March, 2011.
Ballim, Y., “The effect of shale in quartzite aggregate on the creep and shrinkage of concrete – A Comparison with RILEM model B3”, Materials and Structures, Vol. 33, May 2000, pp. 235-242.
Ben Sabaa and Rasiah Sri Ravindrarajah, “Engineering properties of lightweight concrete containing crushed Expanded Polystyrene Waste”, Materials Research Society, 1997 Fall Meeting Symposium MM: Advances in Materials for Cementitious Composites December 1-3, 1997, Boston, USA.
Davis, D.E and Alexander, M.G., “Properties of Aggregates in Concrete (part 2)”, Hippo Quarries Technical Publication, Hippo Quarries, Sandton, South Africa, 1992.
Design Codes or Recommendations,” Materials and Structures, V. 28, No. 175, 1995, pp. 52-55.
EN 934-2, Admixtures for concrete, mortar and grout - Part 2: Concrete admixtures - Definitions, requirements, conformity, marking and labeling, European Standards, 2009.
Gardner, N. J., and Zhao, J. W., “Creep and Shrinkage Revisited,” ACI Materials Journal, V. 90, No. 3, May-June 1993, pp. 236-246.
Gholamreza Fathifazl, A. Ghani Razaqpur, O. Burkan Isgor, Abdelgadir Abbas, Benoit Fournier, Simon Foo, “Creep and drying shrinkage characteristics of concrete produced with coarse recycled concrete aggregate”, Cement & Concrete Composites, Vol. 33 (2011) pp. 1026–1037.
G.J.L. van der Wegen, J.M.J.M. Bijen, “Properties of concrete made with three types of artificial PFA coarse aggregates”, International Journal of Cement Composites and Lightweight Concrete, Vol. 7, Issue 3, August 1985, pp. 159-167.
Jaroslav Bednář, “Aggregate rebound effect on elastic and creep recovery of lightweight concrete”, Cement
and Concrete Research, Vol. 9, Issue 1, January 1979, pp. 45-50.
Mazloom M. Ramezanianpour and A.A Brooks J.J. “Effect of silica fume on mechanical properties of high-strength concrete”. Cement & Concrete Composites, Vol. 26 (2004), pp. 347–357.
Mehmet Gesoğlu, Turan Özturan and Erhan Güneyisi, “Shrinkage cracking of lightweight concrete made
with cold-bonded fly ash aggregates”, Cement and Concrete Research, Vol. 34, Issue 7, July 2004, pp. 1121-1130.
Muller, H. S., and Kuttner, C. H., “Creep of High-Performance Concrete Characteristics and Code-Type Prediction Model,” Proceedings of the 4th International Symposium on Utilization of High-Strength/High Performance Concrete, Paris, 1996, pp. 377-385.
Neville, A., and Aïtcin, P.-C., “High-Performance Concrete An Overview,” Materials and Structures, V. 31, No. 206, Mar. 1998, pp. 111-117.