Cluster Data using Various Clustering
Algorithms
Mayuri K. Botre1, Dr.Kailash Shaw2
ME Student, Department of Computer Engineering, DYPCOE, Akurdi, SPPU, Pune, India1 Associate Professor, Department of Computer Engineering, DPCOE, Akurdi, SPPU, Pune, India2
ABSTRACT:.In the recent study, an enormous quantity of data is generated each day. Data mining is used to determine an outline from that raw data and produces new information. Clustering analysis is emerging as a exploration issue in data mining due to the absence of a class label. Clustering collects the items of similar type in one group and items which are dissimilar are placed in other groups. Clustering divides the data into multiple groups having similar types. It is an unsupervised learning technique. The drawback of data clustering algorithm is that it is not stable. Many works of literature have addressed the problem in existing clustering algorithm to improve the performance of existing clustering algorithm. In this paper, we have done the survey on existing literature about improving the performance of existing clustering algorithm to cluster data.
KEYWORDS: Clustering analysis, Data mining, Unsupervised learning technique
I. INTRODUCTION
Data mining is the process of sorting the large heterogeneous data to identify patterns and the relationship between those patterns is established. Clustering analysis divides the data into the group of similar pattern based on similarity. The pattern in one cluster is more similar to each other and dissimilar to the pattern in another cluster. Clustering example is given in Figure 1. The input is shown in Figure 1(a) and a preferred cluster is shown in Figure 1(b). In this figure, plotted points having the same pattern are labeled with the same number.
Figure 1: Data Cluster [1].
In the clustering, data is represented in form of a fewer cluster having similar data may lose certain reasonable information but it achieves the simplification of data. For machine learning, clustering is related to the hidden patterns. In this, the cluster form is unsupervised learning and the machine learning system results in data perception. For practical, clustering plays an important role in data mining applications such as scientific data exploration, information retrieval and text mining, spatial database applications, Web analysis, CRM, marketing, medical diagnostics, computational biology, and many others [2].
Clustering algorithms can be classified into two main categories Unsupervised Linear clustering algorithms and Unsupervised Non-linear clustering algorithms.
1. Unsupervised Linear clustering algorithm
k-means clustering algorithm
Fuzzy c-means clustering algorithm
Hierarchical clustering algorithm
Quality threshold clustering algorithm
2. Unsupervised Non-linear clustering algorithm
MST based clustering algorithm
Kernel k-means clustering algorithm
Density-based clustering algorithm
The rest of the paper is organized as follows: Section II provides Literature Review. Section III provides unsupervised linear clustering algorithm used in various papers in the literature. Section IV provides unsupervised non-linear clustering algorithm used in various papers in the literature. Section V gives the result analysis of the clustering algorithms. Section VI provides details of performance evaluation metrics which are widely used for clustering.
II. LITERATURE REVIEW
In the big data era, the huge data is generated from multiple platforms or observed from different views. These data are known as multi-view data. These data are very important in data mining and analysis. Yan Yang and Hao Wang have summarized various multi-view clustering algorithms. It provides classification according to the mechanisms and principle involved. These algorithms are classified into five categories such as co-training style algorithms, multi-kernel learning, multi-view graph clustering, multi-view subspace clustering, and multi-task multi-view clustering. The authors also gave examples of these techniques [3].
AkankshaKapoor and AbhishekSinghal [4] have presented partition-predicated clustering techniques, such as K-Means, K-Means++ and object predicated Fuzzy C-Means clustering algorithm. The authors have proposed the system to get better results of clustering by using the sorted and unsorted data into the algorithms. The behavior of patterns is analyzed on the factors such as elapsed time and the total number of iterations. The results show that the sorted data reduces the time complexity as well as improve the performance of these clustering techniques in comparison with unsorted data.
Tapas Kanungo et al. have presented a simple and efficient implementation of Lloyd's k-means clustering algorithm. It is also known as filtering algorithm. This algorithm requires a kd-tree as the major data structure which is easy to implement. The authors have established the practical efficiency of the filtering algorithm in two ways. In first, it presents the running time of algorithms for a data-sensitive analysis. The results show that as the separation between the clusters increases, faster the implementation of the algorithm. Second, it present falsely generated data and on real data sets from applications in color quantization, data compression, and image segmentation for a number of empirical studied [6].
Tian Zhang et al. [7] presents a data clustering method known as Balanced Iterative Reducing and Clustering using Hierarchies (BIRCH). It is mainly used for a huge dataset. BIRCH can cluster input multi-dimensional metric dynamically and try to create the best quality cluster using the available resources such as memory and time constraints. It can create a good cluster with a single scan of the data. To improve the quality of cluster few additional scans are done. BIRCH is the first algorithm which is used to handle the noise. The authors have evaluated the time and space efficiently for BIRCH and analyze the clustering quality through many experiments. They also perform a comparison between BIRCH and CLARANS which result in that BIRCH is consistently superior to CLARANS.
The minimum spanning tree (MST) clustering algorithm is capable of detecting clusters with irregular boundaries. OleksandrGrygorash et al [8]. have proposed two minimum spanning tree based clustering algorithms. In the first algorithm, k-partition of a set of points is produced. By using the point set, this algorithm constructs MST and edges are removed which satisfy a predefined criterion. Repeat the process until the k-clusters is formed. In the second algorithm, without a given k value, partitions a point set into a group of clusters by maximizing the overall standard deviation reduction. Experimental results show the comparison of the proposed algorithm to the k-means and Expectation Maximization (EM). They also apply the proposed algorithm on image color clustering and compare the proposed algorithm with the standard MST clustering algorithm.
III. UNSUPERVISED LINEAR CLUSTERING ALGORITHM
The unsupervised linear clustering algorithm as follows: A. K-mean clustering algorithm
K-means cluster algorithm [6][9] is one of the simplest unsupervised learning algorithms that solve the clustering problem. The problem is solved by forming clusters iteratively. K-means clustering is based on K centroids. In this, first, define the number of clusters needed i.e. k-cluster. Select any k number of points from the dataset as a centroid. Then calculate the distance between the centroid and data points. Each point is associated with the nearest centroids. As a result, all the points are group into a different cluster based on their distance from the centroid of each cluster. There are many ways to calculate the distance between the centroid and each point in the dataset such as Manhattan distance, Euclidean distance, cosine similarity etc. Once all the data points are divided into a cluster, all K centroids are calculated again. Mean of all point in the cluster will be the new centroid. Then again divide all data points into the cluster based on new centroid. Repeat the process until a certain criterion is satisfied.At the initial stage, centroids are selected randomly, so the results of clusters depend on initial centroids. The complexity of k-means is O(n).
B. Fuzzy c-means clustering algorithm
Fuzzy c-means (FCM) [11][12] clustering algorithm is used when the number of clusters is already defined. This algorithm will place each data points into one of the clusters. FCM is different from other clustering algorithms because it does not decide the absolute membership of a data points to a given cluster. Instead of that, it calculates the degree of membership of each data point to that cluster. For a given data point di, the degree of membership ik to cluster j is
calculated as follows:
=
(ǁ ǁ
ǁ ǁ)
(1)
where C is the number of clusters, cj is the center vector for cluster j, m is the fuzziness coefficient and ‖xi−cj‖ measures
the closeness of the data point xi to the center vector cj of cluster j.The center vector, cjis calculated as follows:
= (2)
To increase the speed of image processing system, image segmentation is done. The fuzzy c-mean clustering algorithm is an iterative algorithm. It creates final groups of large data set such as an image. The drawback of this algorithm is that it will take more time for implementation. The improved fuzzy c-mean algorithm [13] is proposed to takes less time in creating a cluster which is used in image segmentation. In improved fuzzy c-mean, it uses frequency value of items instead of original values. In gray images, the number of values of it may be reached to 256*256=65,536 and will take more time in image processing, but in the improved algorithm will take 256 items to process it. The proposed algorithm does not depend on entire data of an image. Instead, it actually depends on data that represent the frequency of each data item in original image’s data. A number of frequencies at most is 256.
C. Hierarchical clustering algorithm
Hierarchical clustering algorithm, clusters are built in a hierarchical manner. So, that hierarchy of data points is produced. This hierarchy may be created by splitting the clusters or by merging the clusters repeatedly. In the hierarchy model, the top level is defined as the coarse grain effects and the bottom level is defined as the fine grain effects. The cluster on the top of the hierarchy contains all the data points in the datasets while the cluster at the bottom has only one data points in each cluster. The clustering of data points in the datasets is represented by dendrogram where each data points are represented by a leaf node. Hierarchical clustering is of two types i.e. Agglomerative and Divisive [5].
Agglomerative: It is a bottom-up approach. At first stage, the number of clusters is equal to the number of data points in the dataset which means that in each cluster only one data point is present. Based on some criteria, two or more clusters start to merge repeatedly to form the new cluster. This process continues until a single cluster is formed.
Divisive: This is a top-down approach. It has a single cluster which contains the entire dataset. Then this cluster starts splitting into two or more sub-clusters. These sub-clusters are divided further and this process continues recursively. The process is continued until a criterion is formed for example desired number of clusters.
D. Quality Threshold clustering algorithm
IV.UNSUPERVISED NON-LINEAR CLUSTERING ALGORITHM
The unsupervised non-linear clustering algorithm as follows: A. MST based clustering algorithm
In minimum spanning tree (MST) based clustering algorithm [8][14][15], construct the minimum spanning tree using Kruskal algorithm. Then set the value of threshold and size of the step. Remove the edges from minimum spanning tree which is having a length greater than the set threshold value. Then calculate the ratio of intra-cluster distance and inter-cluster distance. Record the value of ratio as well as the threshold. By increasing the step size, the threshold value is updated. For every iteration, the new updated value of the threshold is obtained. Repeat the process until certain criteria are encountered such as maximum threshold value is obtained and no more edges can be removed from the MST. At this point, all data points belong to a single cluster. Finally, the minimum value of the recorded ration is obtained and clusters are formed according to the stored threshold value.
V. M. K. Prasad Goura et al. [16] have proposed clustering algorithm that is based on minimum spanning tree. This algorithm is comprises of two algorithms such as the main and the core. In the core algorithm, sorted array of the MST edges are provided as input of the given data points. At a time, only one edge is picked up from that sorted array and then calculates the coefficient of variation. Add the edge to edge select or edge reject, if the coefficient of variation is less than the given threshold value. Repeat the process until the coefficient of variation is greater than the threshold value for the edge is get. In the main algorithm, create the minimum spanning tree of the given data set. Then sort the edges of the MST in increasing order and store it in edge list. The core algorithm work on this sorted edge list. Add or remove the edges during the formation of cluster which is based on the criterion over the threshold value. Then the edge list is updated and again run the core algorithm on the updated list. Repeat the process until there is a change in the edge and all the clusters are formed.
B. Kernel k-means clustering algorithm
Kernel k-means [17][18] is an extension of the standard k-means algorithm. The data points in the dataset are mapped from the input space to a higher dimensional feature space through a non-linear transformation. Then minimize the clustering error in feature space. Results show the linear separation in feature space which corresponds to non-linear separations in input space. The k-means suffers from the problem of linearly separable clusters in the input space which is avoided in kernel k-means.
C. Density-based clustering algorithm
In Density based clustering, grouping those points together which are closely packed. These points are having many nearest neighbors. The points which are too far away having low density, makes as outlier. It finds non-linear shape structure based on the density. Density-Based Spatial Clustering of Applications with Noise (DBSCAN) is most widely used density based algorithm. It uses the concept of density reachability and density connectivity.
Density Reachability - A point ‘a’ is density reachable from a point ‘b’, if the distance between point ‘a’ and ‘b’ is
within ε distance and point ‘b’ has sufficient number of points in its neighbors which are within distance. ε.
Density Connectivity - A point ‘a’ and ‘b’ are said to be density connected if there exist a point ‘c’ which has sufficient
number of points in its neighbors and both the points ‘a’ and ‘b’ are within the ε distance. This is chaining process. So,
if ‘b’ is neighbor of ‘c’, ‘c’ is neighbor of ‘d’, ‘d’ is neighbor of e which in turn is neighbor of ‘a’ implies that ‘b’ is neighbor of ‘a’.
The objective of DBSCAN is to create clusters and noise in a spatial database. The two parameters are required such as ε distance and the minimum number of points for each cluster. By using the parameters, find all the
call to the DBSCAN is necessary with the highest value of the minimum number of points for each cluster. The cluster is formed step by step. The difficulty is in the size of area extension i.e. radius of the sphere [19].
In the recent study, a new improved density-based algorithm is introduced known as Different Densities-Based Spatial Clustering of Applications with Noise (DDBSCAN) [20]. This improved algorithm tries to address all problems in DBSCAN. The objective of this algorithm is to define a density factor to the cluster and the object. Then for decision criterion defines a threshold parameter. The threshold parameter will determine to cluster the point or not. On the basis of this, all cluster will contain similar density nodes only. The process starts by computing density for each object. This density is used to determine which object will be the first to expand. Then select the object with highest density value and pass it to expand method. In the first step of expand process, select all the points that are within the ε distance. The
point is marked as noise if it is not place in any cluster. The criteria of merging points with clusters are changed in DDBSCAN. The density must be less than threshold value to merge the point to the cluster. It defines the maximum ε distance that holds the distance between the current point and the outermost point in the cluster as well as given local ε
distance. Now compute the density. Then divide the current point region by local density and divide cluster size by global density. At last, use MinMax to determine whether to merge current point or not. The MinMax is calculated as follows:
( , ) = ( )
( , ) (3)
V. RESULTS AND ANALYSIS
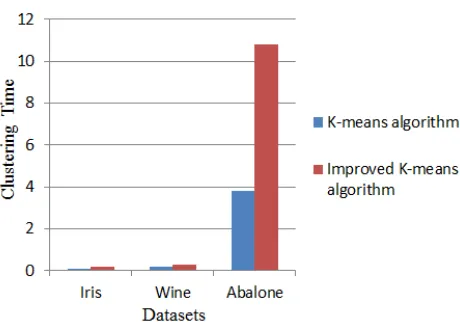
Juntao Wang et al. [10] have proposed an improved K-means algorithm using noise data filter. To test the accuracy and time of proposed clustering algorithm, datasets such as Iris, Wine, and Abalone are used which is provided by machine learning database UCI. The dataset is described in table 1. Figure show that proposed algorithm has a higher accuracy. The figure shows that time required for small datasets in less in comparison with large size datasets.
Table 1: Description of datasets used in K-means clustering algorithm
Dataset Number of Instances
Number of Attributes
Number of Classes Iris 150 4 3 Wine 178 13 3 Abalone 4177 8 29
Figure 3: Comparison of K-mean and Improved K-means clustering time
Hind Rustum Mohammed et al.[13] have produced an improved fuzzy c-mean algorithm that takes less time in finding cluster and used in image segmentation. Improved fuzzy c-mean is implemented by using MATLAB and compared it with implementation of fuzzy c-mean algorithm by using MATLAB. The algorithm uses database of images that contains 100 images. The comparison of time required by fuzzy c-.means and improved fuzzy c-means is given in table 2.
Table 2: Time comparison between existing FCM and proposed FCM
Image name Segmentation time by FCM (sec)
Segmentation time by proposed FCM (sec) Football 3.828125 0.015625 Office 22.796875 0.140625 Colored Chips 8.296875 0.031250 Breast 14.0000 0.062500 House 24.828125 0.078125
VI.EVALUATION METRICS
The metrics used to evaluate the performance are accuracy, precision, recall, and F1 measure. For overall performance, accuracy metric is used. It is widely used in machine learning domain. The precision is calculated as the percentage of instances that are correctly classified as positive out of all the instances that are classified as positive, and the recall is calculated as the percentage of instances that are correctly classified as positive out of all the instances that are actually positive. The metrics of precision, recall and accuracy are as follows:
= (4)
= (5)
= (6)
There is another metrics that combines the precision and recall. This metrics is called F-measure or F1 score. It can be interpreted as a weighted average of the precision and recall which is given as follows:
− = × × (7)
VII. CONCLUSION
The recent developments in clustering algorithm have addressed the problem from the point of view of improving the performance of clustering. There are many challenges of operating on input datasets of large dimensions consisting of hundreds or several thousand instances. The various clustering algorithm is widely used in clustering data with the aim to remove noise in original data and hence improving the overall performance of clustering. Performance of clustering algorithm also varies based on the type and size of data it works on. Clustering algorithms can be classified into two main categories such as unsupervised linear clustering algorithms and unsupervised non-linear clustering algorithms. Performance of clustering algorithm also varies based on the applications.
REFERENCES
1. A.K. Jain, M.N. Murty and P.J. Flynn, “Data Clustering: A Review,” Computer Society Press, IEEE, 1996.
2. PavelBerkhin, “Survey of Clustering Data Mining Techniques,” Accrue Software, 1045 Forest Knoll Dr., San Jose, CA.
3. Yan Yang_ and Hao Wang, “Multi-view Clustering: A Survey,” BIG DATA MINING AND ANALYTICS, ISSN 2096-0654, Volume 1, Number 2, pp. 83–107, June 2018.
4. Akanksha Kapoor and Abhishek Singhal, “A Comparative Study of K-Means, K-Means++ andFuzzy C- Means Clustering Algorithms,” 3rd International Conference on "Computational Intelligence and Communication Technology, IEEE, 2017.
5. Iyer Aurobind Venkatkumar and Sanatkumar Jayantibhai Kondhol Shardaben, “Comparative study of Data Mining Clusteringalgorithms,” International Conference on Data Science and Engineering (ICDSE), IEEE, 2016.
6. Tapas Kanungo, David M. Mount, Nathan S. Netanyahu, Christine D. Piatko, Ruth Silverman and Angela Y. Wu, “An Efficient k-Means Clustering Algorithm: Analysis and Implementation,” IEEE TRANSACTIONS on pattern analysis and machine intelligence, Vol. 24, No. 7, July 2002.
7. Tian Zhang, Raghu Ramakrishnan and Miron Livny, “BIRCH: An Efficient Data Clustering Method for Very Large Databases,” Proceedings in SIGMOD International Conference on Management of data, ACM, Issue 2, vol. 25, pp. 103-114, June 1996.
8. Oleksandr Grygorash, Yan Zhou and Zach Jorgensen, “Minimum Spanning Tree Based Clustering Algorithms,” Proceedings of the 18th IEEE International Conference on Tools with Artificial Intelligence (ICTAI), 2006.
9. Joaquín Pérez Ortega, Ma. Del Rocío Boone Rojas and María J. Somodevilla García, “Research issues on K-means Algorithm: An Experimental Trial Using Matlab,” 2009.
10. Juntao Wang and Xiaolong Su, “An improved K-Means clustering algorithm,” 3rd International Conference on Communication software and Networks (ICCSN), IEEE, 2011.
11. Weiling Cai, Songcan Chen and Daoqiang Zhang, “Fast and robust fuzzy c-means clustering algorithms incorporatinglocal information
for image segmentation,” Journal of the Pattern Recognition Society, Elsevier, 2006.
12. James C. Bezdek, Robert Ehrlich and William Full, “FCM: The Fuzzy c-Means Clustering Algorithm,” Computer and Geosciences, Vol. 10, pp. 191-203, 1984.
13. Hind Rustum Mohammed, Husein Hadi Alnoamani and Ali AbdulZahraa Jalil, “Improved Fuzzy C-Mean Algorithm for Image Segmentation,” International Journal of Advanced Research in Artificial Intelligence (IJARAI), Vol. 5, No.6, 2016.
14. Prasanta K. Jana and Azad Naik, “An Efficient Minimum Spanning Tree based Clustering Algorithm,” International Conference on Methods and Models in Computer Science, pp. 199-203, 2009.
15. Michael Laszlo and Sumitra Mukherjee, “Minimum Spanning Tree Partitioning Algorithm for Microaggregation,” IEEE TRANSACTIONS on Knowledge and Data Engineering, Vol. 17, JULY 2005.
16. V. M. K. Prasad Goura and N. Madhusudana Rao, “AN EFFICIENT AND IMPROVED MINIMUM SPANNING TREE BASED CLUSTERING TECHNIQUE,” Columbia Institute of Engineering and Technology, 2012.
17. Grigorios Tzortzis and Aristidis Likas, “The Global Kernel k-Means Clustering Algorithm,” International Joint Conference on Neural Network, IEEE, 2008.
18. Inderjit S. Dhillon, Yuqiang Guan and Brian Kulis, “Kernel k-means, Spectral Clustering and Normalized Cuts,” International Conference on Knowledge Discovery and Data Mining (ICKDD), ACM, pp. 551-556, August 2004.
19. Benmouiza Khalil and Cheknane Ali, “Density-Based Spatial Clustering of Application with Noise Algorithm for the Classificationof Solar Radiation Time Series,”8th International Conference on Modelling, Identification and Control (ICMIC), IEEE, pp. 279-283, 2016. 20. Mohammad F. Hassanin, Mohamed Hassan and Abdalla Shoeb, “DDBSCAN: Different Densities-Based SpatialClustering of
![Figure 1: Data Cluster [1].](https://thumb-us.123doks.com/thumbv2/123dok_us/1383939.1171078/1.595.177.434.544.725/figure-data-cluster.webp)