Scholarship at UWindsor
Scholarship at UWindsor
Electronic Theses and Dissertations Theses, Dissertations, and Major Papers
2016
A One-dimensional Numerical Modelling Study of an Internal
A One-dimensional Numerical Modelling Study of an Internal
Combustion Engine with Mono-scroll and Twin-scroll Turbines
Combustion Engine with Mono-scroll and Twin-scroll Turbines
Davide Borello University of Windsor
Follow this and additional works at: https://scholar.uwindsor.ca/etd
Recommended Citation Recommended Citation
Borello, Davide, "A One-dimensional Numerical Modelling Study of an Internal Combustion Engine with Mono-scroll and Twin-scroll Turbines" (2016). Electronic Theses and Dissertations. 5803.
https://scholar.uwindsor.ca/etd/5803
A One-dimensional Numerical Modelling Study of
an Internal Combustion Engine with Mono-scroll
and Twin-scroll Turbines
by
Davide Borello
A Thesis
Submitted to the Faculty of Graduate Studies
through the Department of Mechanical, Automotive, and Materials Engineering in Partial Fulfillment of the Requirements for
the Degree of Master of Applied Science at the University of Windsor
Windsor, Ontario, Canada 2016
c
by
Davide Borello
APPROVED BY:
Dr. R. Carriveau
Department of Civil and Environmental Engineering
Dr. J. Defoe
Department of Mechanical, Automotive, and Materials Engineering
Dr. A. Sobiesiak, Advisor
Department of Mechanical, Automotive, and Materials Engineering
Declaration of Originality
I hereby certify that I am the sole author of this thesis and that no part of this thesis
has been published or submitted for publication.
I certify that, to the best of my knowledge, my thesis does not infringe upon anyones
copyright nor violate any proprietary rights and that any ideas, techniques, quotations,
or any other material from the work of other people included in my thesis, published or
otherwise, are fully acknowledged in accordance with the standard referencing practices.
Furthermore, to the extent that I have included copyrighted material that surpasses the
bounds of fair dealing within the meaning of the Canada Copyright Act, I certify that I
have obtained a written permission from the copyright owner(s) to include such material(s)
in my thesis and have included copies of such copyright clearances to my appendix.
I declare that this is a true copy of my thesis, including any final revisions, as approved
by my thesis committee and the Graduate Studies office, and that this thesis has not been
As a result of the engine-downsizing trend that has characterized the last decades,
turbo-charging has taken a central role in the automotive market. In this work the software
GT-Power was used to perform a one-dimensional modelling analysis of an engine with two
different turbine configurations: mono-scroll and twin-scroll. The main focus was on the
latter, for which performance maps provided by suppliers and measured in steady state
conditions do not allow to fully catch physical phenomena such as the cross-flow occurring
between the two scrolls before the turbine wheel. In this study two different modelling
approaches were considered to evaluate which of the two allowed a better matching with
experimental results. As outcome of this study, it was found that the best results were
obtained when using the modelling approach with only one performance map referring to
Acknowledgements
With this work a huge chapter of my life comes to an end. Here I would like to thank some
of the people that gave me all the amazing opportunities I had and that helped me during
these difficult, but at the same time wonderful and satisfying years.
First of all I would like to thank the people that made it possible for the Dual Degree
program between University of Windsor and Politecnico di Torino to exist. Therefore
great thanks to Doctor Giovanni Belingardi and Edoardo Rabino from the Italian side,
Mohammed Malik, Ishika Towfic and Doctor Jennifer Johrendt from the Canadian side.
I would also to thank the people that helped me overcoming all the big issues that I
faced during my projects. A special mention goes to Caterina Venezia and Davide Peci
that spent a lot of their precious time teaching me how to address some of the common
problems faced during 1D simulation projects. I also would like to express my gratitude
to my academic advisors Doctor Andrzej Sobiesiak and Doctor Federico Millo for having
always offered me their help, even in a situation in which the industrial counter-part was
mostly involved.
I further want to thank my advisor from Chrysler Technology Center, Doctor Lurun
Zhong for the opportunity that he gave me to enter in contact with one of the biggest
industrial facilities in the automotive field and in North America in general. Here I had the
chance to work with Mark Yung and Bogdan Nitu that helped me a lot when major issues
occurred. A huge thanks goes also to them.
The greatest thanks are for my family and friends. I would like to thank my mother
Tina for having always believed in me and encouraged in every risky choice I made. I also
during all the difficult moments I had.
I would also like to thank some of the amazing friends that I left in Italy, but that
even from the other side of the world showed me how important I was for them. A special
mention goes to my best friend Jacopo for having been a constant reference in all the major
decisions that I made in the latest years. My thanks go also to my close friends Silvia,
Paola, Stephan, Lorenzo, Giulio and Eddy. I would like to further thank a special group of
people that I had the chance to meet in my years of university. You are some of the most
cleaver, interesting and funny people ever had the chance to meet and to be part of such
a fantastic group is for me an honour. Therefore thanks to Davide, Mirko, Marcello, Piki,
Eddi, Marco and Ciccio.
Finally, I want to thank all the amazing people that I had the chance to meet here in
Canada during the past year. In particular I am really grateful to had the chance to live
with my colleagues Jerome, Marco, Marco, Mirko and Davide. The amount of things that
I learned just sharing the same house with you cannot be described. I consider my self a
better person thanks to your example. I will always miss the amazing moments that we
Table of Contents
Declaration of Originality iii
Abstract iv
Acknowledgments v
List of Tables x
List of Figures xi
List of Abbreviations xvii
List of Symbols xix
Chapter 1: Introduction 1
1.1 Problem statement and objectives . . . 3
1.2 Thesis Organization . . . 5
Chapter 2: Background and state of the art 6 2.1 Downsizing . . . 6
2.2 Direct injection . . . 10
2.3 Variable valve train . . . 11
2.4 Exhaust Gas Recirculation . . . 15
2.5 Exhaust Cylinder Head Integrated Manifold . . . 19
2.6 Turbocharging . . . 20
2.6.1 Introduction . . . 20
2.6.2 Compressor . . . 23
Design and function . . . 23
Compressor map . . . 24
Design and function . . . 26
Turbine map . . . 27
2.6.4 Waste-gate . . . 29
2.6.5 Charge air cooler . . . 30
2.6.6 Turbo Lag . . . 31
2.6.7 Pulsating exhaust flow . . . 33
2.7 Mono-scroll vs Twin-scroll . . . 37
Chapter 3: Experimental set-up and configurations comparison 47 3.1 Configuration comparison . . . 49
Chapter 4: Simulation tool and modelling description 55 4.1 GT-Power description . . . 56
4.2 Model description . . . 61
4.2.1 Pipe flow . . . 62
4.2.2 Intake and exhaust valve flow . . . 64
4.2.3 In-cylinder process . . . 66
4.3 Turbocharging . . . 69
Chapter 5: Methodology 75 5.1 Mono-scroll configuration . . . 78
5.2 Twin-scroll configuration . . . 80
5.2.1 Modelling . . . 80
One-map methodology . . . 81
Three-map methodology . . . 83
Chapter 6: Results 89 6.1 Model Validation . . . 89
6.1.1 Mono-scroll Configuration . . . 90
6.1.2 Twin-scroll Configuration . . . 97
One-map method . . . 97
Three-map method . . . 106
TABLE OF CONTENTS
6.3 Sensibility of Three-map model configuration to changes in the diameter that
simulates the cross-flow phenomenon . . . 117
6.4 Sensitivity analysis to the change in the extremes of the x-axis of the
look-up table that control interpolation of the performance maps - Three-map
modelling approach . . . 122
Chapter 7: Conclusions and Recommendations 128
Bibliography 130
3.1 Engine specifications . . . 47
3.2 Test constraints . . . 48
3.3 Comparison between Mono-scroll and Twin-scroll configuration . . . 54
6.1 Comparison of the Validation metric for the two modelling approaches . . 106
6.2 Maximum diameter of the orifice that simulates cross-flow . . . 115
6.3 Maximum diameter of the orifice that simulates cross-flow - Three map . . 118
6.4 Profile chosen to improve the correlation with average quantities - Threemap
method . . . 122
List of Figures
1.1 Differences between the actual and the future test cycles . . . 2
1.2 Twin-scroll turbine section showing the region where cross-flow can occurr . 4 2.1 Iso-Brake Specific Fuel Consumption lines as function of torque and engine RPM [7] . . . 8
2.2 Typical setup of a UniAir actuator [28] . . . 12
2.3 Lift curve for cylinder scavenging (top left), Lift curve for dethrottling (top right), Hybrid lift curve and Multi-lift curve (bottom left) and Lift-curve for Miller cycle (bottom right) [28] . . . 14
2.4 Fuel economy improvement by cooled EGR [5] . . . 16
2.5 High Pressure Loop configuration [10] . . . 17
2.6 Low Pressure Loop configuration [10] . . . 18
2.7 Mixed Pressure Loop configuration [10] . . . 18
2.8 Differences between a standard exhaust system and a CHIM one [38] . . . 20
2.9 Example of a turbocharger system [43] . . . 22
2.10 Schematic of a turbocharged engine[26] . . . 22
2.11 Example of a compressor map with highlighted the areas on which the system cannot operate . . . 25
2.12 Example of a turbine map . . . 27
2.13 Illustration of compressor housing showing A/R characteristics [45] . . . 28
2.15 Schematic of some turbocharger configurations used to reduce turbo lag,
compared with a standard configuration [4] . . . 32
2.16 Example of an exhaust manifold for pulse turbocharging [39] . . . 34
2.17 Analysis of effects of blowdown pulses . . . 36
2.18 Schematic of the differences between mono-scroll configuration and
twin-scroll configuration [40] . . . 37
2.19 Schematic of a twin-scroll turbine [29] . . . 39
2.20 Flow conditions in a twin scroll turbine at equal and single admission [30] . 42
2.21 Flow conditions in a twin scroll turbine at unequal admission and cross-flow
[30] . . . 42
2.22 Reference modeling approach for twin scroll turbines[30] . . . 43
2.23 Flow capacity (left) and turbine efficiency (right) in equal and single admissions[30] 44
2.24 Modeling approach proposed by Brinkert [30] . . . 45
3.1 Schematic of engine set-up . . . 48
3.2 Comparison of torque and power for mono-scroll and twin-scroll configuration 49
3.3 Comparison in terms of back-pressure between mono-scroll and twin-scroll
configurations . . . 50
3.4 Comparison in terms of Brake Specific Fuel Consumption between
mono-scroll and twin-mono-scroll configuration . . . 51
3.5 Comparison in terms of some control quantities between mono-scroll
config-uration and twin-scroll configconfig-uration . . . 53
3.6 Comparison in terms of parameters related to LIVC strategy between
mono-scroll and twin-mono-scroll strategy . . . 54
4.1 Computational time expressed as function of model detail for different
mod-elling approaches [34] . . . 56
4.2 Schematic of a staggered grid approach [33] . . . 58
4.3 Base model of the whole engine configuration that has been provide by FCA 62
4.4 Intake valve lift profiles for the mono-scroll configuration . . . 65
LIST OF FIGURES
4.6 Example of a pressure profile computed through a Weibe function . . . 69
4.7 Measurement data points and performance map processed for a compressor 71 4.8 Measurement data points and performance map processed for a turbine . . 71
5.1 Discretization of the 3D actual component into pipes and flowsplits in GT-Suite environment . . . 79
5.2 Complete model of the whole engine system with the mono-scroll turbine . 80 5.3 Modelling of the turbine according to One-map methodology . . . 81
5.4 Complete model of the whole engine system with the twin-scroll turbine (One map methodology) . . . 82
5.5 Water-cooler pressure sensor schematic and installation location . . . 83
5.6 Modelling of the turbine according tothree-map methodology . . . 84
5.7 Instantaneous pressure at the turbine inlet . . . 85
5.8 Instantaneous pressure difference and instantaneous mass flow through the scroll . . . 86
5.9 Instantaneous values for logarithm of the pressure ratio and rack positions . 87 5.10 Complete model of the whole engine system with the twin-scroll turbine (Three map methodology) . . . 88
6.1 Comparison between model results and experimental measurements for MAP and MAT - Monoscroll turbine configuration - Numbers on y-axis removed for confidentiality reason . . . 91
6.2 Wastegate diameter imposed by the model in order to obtain the required BOOST in the intake manifold - Monoscroll turbine configuration . . . 92
6.3 Temperature comparison between model results and experimental measure-ments - Monoscroll turbine configuration . . . 93
6.4 Pressure comparison between model results and experimental measurements - Monoscroll turbine configuration . . . 94
6.6 Comparison between model results and experimental measurements for Power
and Torque curves - Monoscroll turbine configuration . . . 96
6.7 Comparison between model results and experimental measurements for MAP
and MAT - Twinscroll turbine configuration with one map methodology . . 97 6.8 Wastegate diameter imposed by the model in order to obtain the required
BOOST in the intake manifold - Twinscroll turbine configuration with one map methodology . . . 98 6.9 Comparison between model results and experimental measurements for
pres-sures - Twinscroll turbine configuration with one map methodology . . . . 99 6.10 Comparison between model results and experimental measurements for
tem-peratures - Twinscroll turbine configuration withone map methodology . . 100 6.11 Comparison between model results and experimental measurements for Air
mass flow rate, turbocharger shaft speed, volumetric efficiency and Brake
Specific Fuel Consumption - Twinscroll turbine configuration with one map methodology . . . 101 6.12 Comparison between model results and experimental measurements for Torque
and Power curves - Twinscroll turbine configuration withone map methodology102 6.13 Comparison between model results and experimental measurements for
in-cylinder pressure - Twinscroll turbine configuration withone map methodology103 6.14 Comparison between model results and experimental measurements for the
instantaneous pressure at the turbine inlet - Twinscroll turbine configuration
withone map methodology . . . 104 6.15 Comparison between model results and experimental measurements for the
instantaneous pressure at the turbine inlet - Twinscroll turbine configuration
withone map methodology . . . 105 6.16 Comparison between the two twin-scroll modelling possibilities for some
per-formance parameters . . . 107
6.17 Comparison between the two twin-scroll modelling possibilities for some
LIST OF FIGURES
6.18 Variation in diameter of the orifice simulating the cross-flow phenomenon for
the sensibility analysis . . . 109
6.19 Sensitivity of some performance parameters to changes in the diameter of the
orifice simulating the cross-flow phenomenon - One map approach . . . 110
6.20 Sensitivity of the targeted boost to changes in the diameter of the orifice
simulating cross-flow - One map approach . . . 111
6.21 Sensitivity of pV diagrams to changes in the diameter of the orifice simulating
the cross-flow phenomenon - One map approach . . . 112
6.22 Sensitivity of Torque and Power to the changes in the diameter of the orifice
simulating the cross-flow phenomenon . . . 113
6.23 Sensitivity of the instantaneous pressure profiles at turbine inlet to changes
in the diameter of the orifice simulating the cross-flow phenomenon - One
map approach . . . 113
6.24 Sensitivity of the instantaneous pressure at turbine inlet to changes in the
diameter of the orifice simulating the cross-flow - One map approach . . . . 115
6.25 Sensitivity of the instantaneous pressure at turbine inlet at 5200 RPM to
changes in the diameter of the orifice simulating the cross-flow - One map
approach . . . 116
6.26 Sensitivity of the targeted boost to extreme changes in the orifice diameter
simulating the cross-flow - One map approach . . . 117
6.27 Sensitivity of the targeted boost to changes in the orifice diameter that
sim-ulates the cross-flow phenomenon - Three Map . . . 118
6.28 Sensitivity of some performance parameters to changes in the diameter of the
orifice simulating the cross-flow phenomenon - Three map approach . . . . 119
6.29 Sensitivity of the instantaneous pressure at turbine inlet to changes in the
diameter of the orifice simulating the cross-flow - Three map approach . . . 120
6.30 Sensitivity of the instantaneous pressure profiles at turbine inlet to changes
in the diameter of the orifice simulating the cross-flow phenomenon - Three
6.31 Virtual rack position as function of engine speeds for different extremes of
the interpolating law . . . 123
6.32 Boost pressure target as function of RPM for different extremes of the
inter-polating law . . . 124
6.33 Analysis of the the sensitivity of instantaneous pressures at turbine inlet at
different RPMs fo changes in the extremes of the interpolatinglaw . . . 124
6.34 Analysis of the sensitivity of some performance parameters expressed as
List of Abbreviations
1D One dimensional
3D Three dimensional
AFR Air to Fuel Ratio
BEC Burned End Constant
BMC Burned Midpoint Constant
BMEP Brake Mean Effective Pressure
BSC Burned Start Constant
BSFC Brake Specific Fuel Consumption
CAD Computer Aided Design
CR Compression Ratio
CRF Centro Ricerche Fiat
EGR Exhaust gas recirculation
FCA Fiat Chrysler Automobiles
FMEP Friction Mean Effective Pressure
GT Gamma Technologies
IMEP Indicated Mean Effective Pressure
LIVC Late Intake Valve Closure
MAP Manifold Absolute Pressure
MAT Manifold Absolute Temperature
MBF Mass of Burned Fuel
MFR Mass Flow Ratio
O2 Oxygen
PFI Port Fuel Injection
PMEP Pumping Mean Effective Pressure
PR Pressure ratio
RPM Revolution Per Minute
SOC Start Of Combustion
VVA Variable Valve Actuation
VVT Variable Valve Timing
WB Wiebe constant
WCAC Water Charge Air Cooler
WG Waste-gate
WLTP World-harmonized Light-vehicles Test Procedure
List of Symbols
γ Specific heat ratio of the incoming gas
ηb Compressor efficiency
ηCAC Charge Air Cooler efficiency
θ Instantaneous crank angle
ρ Density
ρinf Density of outside air
ρis Upstream stagnation density
τb Brake Torque
A Cross sectional flow area
Ar Reference flow area
As Heat transfer surface area
CD Discharge Flow coefficient
Cf Skin friciton coefficient
cs Speed of sound
Cp Pressure loss coefficient
cp Specific heat at constant pressure
D Duration
De Equivalent diameter
E Wiebe exponent
e Total specific internal energy
eb Burned zone energy
eu Unburned zone energy
H Total specific enthalpy
ha Enthalpy of air mass
hf Enthalpy of fuel mass
hf,i Enthalpy of injected fuel mass
ht Heat transfer coefficient
k Adiabatic coefficient
LHV Lower Heating Value
m Mass
M(n) Modeling result
ma Air mass
mb Burned zone mass
mf,i Injected fuel mass
mu Unburned zone mass
˙
m Mass flow
˙
mf Fuel mass flow rate
p Cylinder pressure
Pb Brake Power
p1 Static Pressure at compressor inlet
p2 Static Pressure at compressor outlet
p3 Static Pressure at turbine inlet
p4 Static Pressure at turbine outlet
˙
LIST OF SYMBOLS
˙
Qu Unburned zone heat transfer
t Time
Tin Temperature at inlet
T20 Temperature after the CAC
Tc Temperature coolant
Tf luid Fluid temperature
Ttotal,in Total temperature at inlet conditions
Twall Wall temperature
T1 Static Temperature at compressor inlet
T2 Static Temperature at compressor outlet
T3 Static Temperature at turbine inlet
T4 Static Temperature at turbine outlet
u Velocity at the boundary
uin Flow velocity at inlet
Uis Isentropic velocity at the throat
V Validation Metric
Vdisp Displaced Volume
Vu Unburned zone volume
Vb Burned zone volume
Introduction
Turbo-charging has for a long time been viewed as a luxury device for power boost. More recently this viewpoint has changed. This is partially due to the growing focus on
environ-mental issues, but mostly due to the tightening of the regulations for emissions and fuel
economy. The shift towards the use of turbochargers has been in parallel with the
intro-duction of engines with a reduced displacement. With this solution, the idea is to have an
engine that operates with the same performance thanks to some boosting system, but with
operating points that are shifted to an area of higher loads thanks to lower pumping losses.
At the same time this solution is able to guarantee some positive side effects such as a
con-sistent reduction of weight and frictional losses, thus resulting in a significant improvement
in engine’s emissions and fuel efficiency. This downsizing approach has experienced large success in Europe where gasoline prices are in general much higher. North America is now
moving in the same direction, but at a much lower rate.
A vehicle’s fuel economy is measured according to specific driving cycles, that should
rep-resent the typical usage of a car. The one used in Europe is the New European Driving
cycle (NEDC). The problem with this test procedure is that it imposes low accelerations,
many constant speed cruise events and many idling events. All these conditions are rarely
1. INTRODUCTION
(a)New European Driving Cycle (b) Worldwide harmonized Light-vehicle Test Procedure
Figure 1.1: Differences between the actual and the future test cycles
procedure,called World harmonized Light-vehicle Test Procedure (WLTP) is being
consid-ered. Even if still not exactly representing the actual driving conditions, the improvement
is considerable as can be seen from Figure 1.1.
In the WLTP the number of fast acceleration events from low speed, like those
expe-rienced in city traffic, is greatly increased and this might be a problem for turbocharged
engines. Due to the low energy of the exhaust gases at low Revolution Per Minute and due
to the fact that the rotational inertia of turbocharger components under those conditions
is not negligible, a phenomenon known as turbo-lag is experienced. This is the delay per-ceived by the driver from the moment at which the gas pedal is pressed to the moment at
which the increase in torque is actually noticed. Of many possible solutions that have been
introduced to address this problem and improve the efficiency in this lower speed region,
one of the simplest and cheapest is the twin-scroll turbine. A standard turbocharger uses a
mono-scroll turbine, in which all the exhaust manifold runners converge into only a single pipe that is directly fed into the turbine. The exhaust flow coming from the engine is highly
pulsating and the mono-scroll solution is not able to efficiently convert the energy contained
in the exhaust gases. In addition to that, these exhaust pulses caused by the opening of
the exhaust valves of one cylinder might interfere with another cylinder during its valve
overlap phase, thus increasing the quantity of residual gases and as a consequence also the
risk of knocking. The twin-scroll turbine configuration partially allows these issues to be overcame. In this case the turbine features two inlets, one carrying the exhaust from half
appropriately to avoid deleterious pressure interactions. As an example, in a 4-cylinder
engine with firing order 1-3-4-2, like the one considered in this study, one scroll will receive
the exhaust flow form cylinders 1 and 4 while the other will receive the exhaust flow from
cylinders 2 and 3. This allow to increase to 360◦ the gap between each pressure pulse in
each manifold section and a results it makes impossible for a pressure pulse to negatively
affect what happens into another cylinder during the valve overlap phase.
1.1
Problem statement and objectives
In this study, a turbocharged engine with both mono-scroll configuration and twin-scroll
configuration turbines will be modelled and the two solutions will be compared. The analysis
is done with a 1D modelling approach with the use of GT-Power, the leading software in
power-train modelling in the automotive field. Efficient reuse of models is important from
an industrial perspective, where components that have been investigated and thoroughly
validated can be used again, to speed up new projects. Hence, in this study a ”base model”
has been provided by Fiat Chrysler Automobiles as a starting point. This base model has
been deeply analysed by the author in a preliminary phase and some modifications, that
described in detail in Chapter 4, were implemented in order to adapt it to the case in this
study. Later on, when the actual analysis started, the base model was completed for the
different configurations with the missing exhaust manifolds and turbines. The modelling
of mono-scroll configuration is straightforward, but the same cannot be said for twin scroll
turbines. The issue is that, due to manufacturing tolerances, the two flows entering the
turbine can interact before coming into contact with the turbine wheel blades. The region
where this is possible is shown in Figure 1.2. Due to the pulsating nature of the exhaust flow
coming from an internal combustion engine, quite significant pressure difference between
the two scrolls can be experienced and some exhaust flow could recirculate in the other
scroll before reaching the turbine wheel. In a 1D model where the turbine performance is
described through steady-state maps, therefore it is difficult to capture this phenomenon and
a better understanding of this is required. To gain this understanding different approaches
1. INTRODUCTION
Figure 1.2: Twin-scroll turbine section showing the region where cross-flow can occurr
The objectivesof this study are the following:
1. To compare the two engine with different turbine configurations using experimental
data and establish which gives the better performance. This constitutes Phase 1 of
the project
2. To set-up a complete 1D model of an engine with a mono-scroll turbine and to correlate
it with experimental data. This constitutes Phase 2 of the project.
3. To set-up a complete 1D model of an engine with a twin-scroll turbine and to
corre-late it with experimental data. Due to the challenges associated with modelling the
physical phenomenon, two different approaches will be compared in order to evaluate
which one gives the better matching with experiments. This constitute Phase 3 of the
project.
The required experimental data were measured in a preliminary phase of the project
and were provided by FCA to the author after the conclusion of the literature review. The
1.2
Thesis Organization
The remaining part of the present work is organized in the following chapters:
• Chapter 2: this chapter presents all the literature review performed by the author
in the early stage of the project. In the first part of the chapter the main feature of
the engine such as direct injection, cooled Exhaust Gas Recirculation, Uni-air valve
actuation system and turbocharger are described to give the reader a better
under-standing of the design choices for this engine. In the second part some more specific
works about 1D modelling of twin-scroll turbines is presented.
• Chapter 3: the engine main features and the test constraints are reported here. A
comparison of the experimental data coming from engine with mono-scroll turbine
and engine with twin-scroll turbine is also performed.
• Chapter 4: some important information about the software used to perform the
anal-ysis are given here. In addition to that, the most important components of the base
model provided by FCA are described.
• Chapter 5: the simulation procedure for steady-state is reported. The steps for the
completion of the models for both configuration are given. For the twin-scroll turbine
are also explained the two modelling approaches that will be compared in order to
assess which one gives the better matching with experimental results.
• Chapter 6: in the first part of this chapter are provided the results of the simulations
for the model correlation with experimental results, for both mono-scroll and
twin-scroll configuration. In the second part are reported the results of the sensitivity
analysis performed to assess which modelling approach is better for the twin-scroll
turbine.
Chapter 2
Background and state of the art
Most of this chapter deals with the description of important solutions, such as Downsizing,
Exhaust Gas Recirculation, Variable Valve Actuation, Direct injection and Turbo-charging,
in order to give to the reader a better understanding of the design choices for the engine
of this study. The latter section of this chapter is dedicated to the description of some
modelling solutions for the twin-scroll turbine configuration.
2.1
Downsizing
Improvement of fuel economy is the goal that today is leading all car manufacturers’ strategic
decisions. This means that a higher portion of the chemical energy contained in the fuel
should be converted into useful work and such a task can be achieved only through a
reduction in terms of engine losses.
The tendency that has consolidated in the last decade is the production of high specific
power engines, characterized by a lower displacement and a higher specific mechanical
power. This approach has been referred to as downsizing and was made possible only by the development of modern boost systems (mechanically driven or exhaust driven). This
kind of boosting systems are necessary in order to reach an increased specific output, so as
of this solution observing that, on standard driving cycles, an engine spends the majority
of its time operating at light load. When a naturally aspirated engines operates in this
conditions, the pumping work done to overcome the flow restriction of the throttle and the
higher friction work associated with these normally larger engines result in a significant
penalty in terms of specific fuel consumption. As a consequence of this, the majority of
car makers has replaced their engines with smaller turbocharged ones that, in the same
operating conditions, will experience reduced losses. In fact, in order to guarantee the
same power output as the original configuration, this power-train solution will spend an
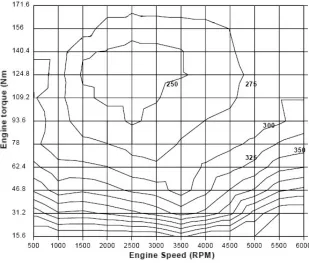
higher portion of time operating at higher Brake Mean Effective Pressure. In figure 2.1 it
is given an example of anengine map for a naturally aspirated engine in which iso-lines of a parameter known asBrake Specific Fuel Consumption are expressed as function of torque and engine RPM.
BSF C= m˙f Pb =
1
LHV ·ηb (2.1.1)
When considering a turbocharged downsized engine, those lines will be slightly different.
However what will not change is the trend by which at higher loads it will be experienced a
reduction in fuel consumption. The operating points for the new engine configuration will
now shift in this higher efficiency area and therefore improvements in terms of efficiency
will be reached. [1] [2].
Even if it is true that the goal of this approach is to achieve a reduced fuel consumption,
at the same time it is also necessary to achieve at least the same performances of the
orig-inal naturally aspirated engine. Turbo-charging perfectly fulfil this task when considering maximum power output at medium/high loads in conditions close to steady state. On the
other hand the situation is different when dealing with transient conditions at low engine
speeds. Under accelerating conditions only part of the energy recovered from the exhaust
gases at the turbine is exploited to compress the incoming flow of air while the reminder is
necessary to overcome theinertia of the turbocharger and increase the speed of its rotating components [32]. In addition to that, at low speeds the compressor performance is limited
turbo-2. BACKGROUND AND STATE OF THE ART
Figure 2.1: Iso-Brake Specific Fuel Consumption lines as function of torque and engine
RPM [7]
charging has been the so calledturbo lag effect[2]. Different solutions have been studied
in order to address this problem and a more detailed description of these will be given in
the following sections.
Another strategy to improve engine efficiency isdown-speeding. It consists in utilizing
a longer final drive ratio to operate the engine at lower speed and higher BMEP with similar
benefits as the ones already described for downsizing. However, in order to reduce the driver
perception of lag, an opposite approach may be taken. What happens in this case is that a
shorter final gear ratio is used in order to have the engine working at higher engine speed,
where the transient response is better, wasting some of the fuel consumption advantage of
the downsized engine [7].
In addition to the limitations in transient response, downsized turbocharged SI engines
as the abnormal combustion during which part of the charge is consumed at very high
rates [26]. Due to the dramatic limits in terms of thermal efficiency that it may impose, it
represents one of the most important phenomena in Otto cycle engines. One of the most
accepted theory explaining the origin of knock is the end-gas theory. According to this, when portion of the still unburned mixture ahead of the propagating flame front reaches
the autoignition temperature, some pre-flame reactions in the end-gas region start. If the
pre-flame process ends before the flame front consumes all the fresh charge in the chamber,
the portion of the end gas begins to burn releasing thermal energy at a high rate [6]. As
a consequence, all the parameters that slow down the propagation of the flame front and
that reduce the time necessary for pre-flame reactions to occur favours knock. An example
could be represented by low engine speed conditions in which in-cylinder turbulence level
is lower resulting in a slower propagating flame. Another example is given by the reduction
of the pre-flame reaction time caused by the high pressure and temperature values that
can be reached in the chamber for instance due to supercharging, high pressure ratios, or
simply high load operation [26]. As a consequence, when considering knock, operation at
low speed and high load is typically a critical operation point for spark-ignition engines.
The immediate energy release rates from the end-gas results in local high pressure levels
and pressure waves that propagates across the combustion chamber. The subsequent noise
transmitted through the engine structure is the actual knock that gives the name to the phenomenon [26]. Another effect is the strong thermal gradients that are formed across the
cylinder and that cause high rates of local heat transfer. Hot spots on the walls are then
formed due to abnormal overheating, possibly leading to other surface ignition phenomena
[6].
The higher propensity to knock faced by turbocharged engines is also the reason why
strong attention is given to the goal of reducing trapped residual gases. If not accounted properly, the resulting raise in temperature of the in-cylinder charge would increase the
probability of knock due to consequential higher combustion temperatures. In order to
fight this higher knocking risk, a solution could be retarding the ignition timing, but this
means that higher exhaust temperature are experienced. At high engine speeds conditions
2. BACKGROUND AND STATE OF THE ART
enrichment necessary to maintain acceptable turbine inlet temperatures. The explanation
about why fuel enrichment helps decreasing exhaust gas temperature is given in the next
section. The only way to achieve a more advanced combustion phasing would then be
through a reduction in compression ratio. However the efficiency across all operating
con-ditions would then be degraded. [25]. This chain reaction of negative effects shows the
importance of a correct expulsion of these residual gases and a solution to achieve this
could be to exploit some of the fresh air entering the cylinder during the overlap phase
between intake and exhaust valves.
2.2
Direct injection
Due to the risk of knocking combustion, a reduction of the compression ratio in order to
maintain an acceptable combustion phasing at all load would be required. This would result
in a reduction of the indicated efficiency at part load that would lead to an increase in part
load brake specific fuel consumption. Thus, in order to obtain the best improvement in
fuel economy, the compression ratio needs to be maintained as high as possible [15]. This
requirement has lead to the widespread introduction of direct injection to turbocharged
engines. Injecting the fuel directly into the combustion chamber, as opposed to the port,
reduces the charge temperature in the cylinder thanks to the absorption of heat obtained
through the vaporization of the fuel. This has the combined effect of both increasing
the density of the charge and simultaneously moving the knock limit of the combustion
system [7]. Additional advantages that the turbocharged direct injection engines can allow to reach come from its synergic use with variable camshaft phasing. Normally, due to the
positive pressure ratio across the engine that occurs at low speed on a turbocharged engine,
significant blow-through will occur when large amounts of valve overlap are used. On a port
fuel injected (PFI) engine this would result in an unburned air/fuel mixture in the exhaust,
causing both significant engine out hydrocarbon emissions, possible catalyst damage and
increased fuel consumption. By injecting after the exhaust valve has closed, direct injection
engines are not limited in this way and so high levels of overlap can be utilized to achieve
further improves the knock limit at low speed/high load and moves the operating point to
a more favourable position on the compressor map improving low speed torque [4].
When talking about scavenging it is important to define the parameter known as
trap-ping ratio, that is the ratio between the mass of fresh charge in a cylinder and the total
mass of air that runs into the engine. This parameter is equal to 1 if all air that flows into
the engine remains in the combustion chamber. If the trapping ratio is dropping below 1,
the overlap has made the fresh air to short cut into the exhaust pipe. A positive side effect
of this scavenging phenomenon is that an increased mass flow through the turbine can be
achieved allowing its speed to be increased faster [19].
2.3
Variable valve train
With the remarkable technological improvements that have been achieved in the last decade,
valve train control has gained a decisive role in fulfilling the increasingly stringent
require-ments with regard to carbon dioxide emissions and exhaust pollutants. A well functioning
system on the one hand should be designed in such a way that the losses occurring during
the charge cycle are low, and on the other it should create the prerequisite for the best
possible preparation of the in-cylinder mixture. This would then result in a particularly
good combustion process in terms of efficiency and low emissions [11].
Two basic approaches can be followed in order to achieve a higher degree of variability:
• Variable Valve Timing VVT: variation of the valve lift curve just in terms of temporal shifting. This is done using camshaft phasing units and the shape of the valve lift
profile is not affected.
• Variable valve Actuation VVA: variation of the valve lift curve in terms of the lift height and the opening and closing point, and thus of the resulting opening period
The engine considered in this study uses the UniAir system, the world’s first
electro-hydraulic system for fully-variable control of intake valves launched in 2009 by a
collabo-ration between Schaeffler and FIAT. This system has allowed the engine to simultaneously
2. BACKGROUND AND STATE OF THE ART
in power and torque levels in the lower speed range of respectively 10% and 15%. These
performance improvements have been achieved staying within the stringent limits imposed
by Euro 5 and 6 emission standards requirements. [28] [37]
Figure 2.2: Typical setup of a UniAir actuator [28]
Figure 2.2 gives an overview of how the system works. Here it is shown that, during
its movement, the camshaft acts on a finger follower which drives a pump that fills a
high-pressure chamber. Depending on the position of the solenoid valve, the oil high-pressure may
act on the engine valve via the piston or in alternative it can be reduced directing the flow
into the medium-pressure chamber and oil reservoir. It becomes then clear that with this
solution the valve opening is here decoupled from the camshaft position and therefore, acting
on the solenoid valve, various pressure levels in the high pressure chamber, thus variable
valve lift, can be achieved. The degree of freedom allowed by this system enable the cam
to be in the lift phase while the intake valve remain closed, if all the pressure is discharged
[37]. Once the pressure in the high-pressure chamber drops, the engine valve is brought
back to its closing position thanks to a valve spring. A temperature sensor is also required
in order to compensate for the hydraulic effects produced by the temperature-dependant
viscosity of the oil. All the other parameters required for controlling the system, such as
the camshaft speed, are provided by sensors that are already employed [28].
The UniAir system allow a significant degree of variability to be achieved both in terms
point and latest possible closing point are determined by the envelope curve of the cam
that is used to drive the system. Within these limits, all the intermediate conditions can be
achieved by simply acting on the electric current controlling the solenoid. The overall result
is that the valve opening and closing times and the valve lifts can be optimally adjusted for
all engine operating conditions.
In the following, some possible applications of this system for gasoline engine will be
presented [28] (see Figure 2.3):
• Cylinder scavenging: in turbocharged engines the removal of residual gases in the
cylinder through the use of fresh air provides significantly faster response times at low
speeds and high loads. Although it is not possible for this system to influence the
point at which the valve’s envelope curve begins, the variation of the opening, point
together with a special lift curve, can be used to activate the required valve overlap
only when it is required. Due to its shape, this special lift curve will be referred to as
boot profile in the rest of this thesis.
• De-throttling at low speed : this solution guarantees to reach some improvements in
terms of fuel consumption with respect to the standard throttle valve solution. Ideally,
the smaller valve lifts typical of this situation should be designed in such a way that
during the intake stroke it would not be generated a vacuum that could cause load
cycle losses to occur in the cylinder. In reality some pumping losses will still be
experienced, even if with this solution those are slightly reduced.
• Hybrid lift: process that combines late opening of the intake valve with early closure,
but in which the ramps are not symmetrical with one another. This solution is good
for low load conditions typical of city traffic operation.
• Multi-lift: the intake valve is opened and closed twice within the intake stroke. This
produces an optimum combustion process and low pumping losses at low speeds and
under low loading conditions. In theory it may look particularly suitable for reducing
fuel consumption in city traffic. However in practice due to the particular shape of
the lift profile it is very difficult to handle even loads that are slightly higher than 3-4
2. BACKGROUND AND STATE OF THE ART
• Miller cycle and Atkinson Cycle: they consist respectively in a premature closing of
the intake valve and in a retarded closing of the intake valve. With this technology,
a fixed high geometric compression ratio is maintained to allow high efficiency during
part load operation, but at the same it is possible to achieve a longer expansion stroke
than compression stroke. This is effective to reduce the temperature and pressure at
the end of compression stroke resulting in an improvement of knock sensitivity [4].
Figure 2.3: Lift curve for cylinder scavenging (top left), Lift curve for dethrottling (top
right), Hybrid lift curve and Multi-lift curve (bottom left) and Lift-curve for Miller cycle
(bottom right) [28]
Another feature that an UniAir system is capable of providing is the fully
deactiva-tion individual cylinders during partial load applicadeactiva-tions,with the consequent advantage of
however not possible due to the fact that, in order to implement it, also the exhaust side
should have been provided a similar control system.
2.4
Exhaust Gas Recirculation
In internal combustion engines, Exhaust Gas Recirculation is a technique realized by re-aspirating a fraction of the burnt gases that are formed within the combustion chamber
and directing it to mix with the incoming charge. This is done thorough an external circuit
connecting the exhaust manifold and the intake one. Normally this flow of exhaust gases
are cooled in a heat exchanger to limit the temperature increase of the flow entering the
cylinder.[5]
This technology has been initially introduced on Diesel engines because of the significant
reduction ofN Ox emissions that it allowed to achieve. In order for nitrogen compounds to
be produced, two ”ingredients” are necessary: high oxygen concentration and high
temper-atures. Recirculating a fraction of the exhaust gas has the positive effect of diluting the inlet
flow decreasing the quantity of oxygen and then, due to the introduction of components
with a higher thermal capacity, also the temperatures experienced in the combustion will
be lower.
Nowadays this system has found success also in Turbocharged Spark Ignition Engines,
in particular theCooled External EGR configuration. From Figure 2.4 one can see that this solution allows to obtain advantages such as:
• Better knocking suppression:this gives the possibility to advance ignition timing (thus increasing torque) and increase compression ratio (thus increasing efficiency)
• Reduced need for mixture enrichment at high loads
• Reduced cooling losses
• Increase of relative specific heat
• Reduced throttling losses: to admit the same quantity of air in the engine the throttle has to be more open. The consequent reduction in pressure drop across the throttle
2. BACKGROUND AND STATE OF THE ART
Figure 2.4: Fuel economy improvement by cooled EGR [5]
It could be argued that large amounts of recycled gases could significantly slow down
the flame development. As a result unstable combustion could occur producing large cyclic
variations,a deterioration in car drivability and an increase in pollution levels. However,
since exhaust gases reach lower temperature levels, the boost pressure could be increased,
compensating the reduction in flame development speed just described [5].
Depending on the position where the exhaust gas is extracted and than re-introduced,
the Cooled EGR systems can be classified as High-pressure loop EGR systems, Low-pressure
loop EGR systems and Mixed-pressure loop EGR systems. Those three configuration will
be now described and in order to do so Figure 2.5, Figure 2.6 and Figure 2.7 will be
used. In all of these on the left it is shown a schematic of the configuration so that a
good understanding about where the gas is extracted and where it is reintroduced can
be achieved. On the right instead it is shown contour diagram of the pressure difference
between the EGR gas extraction and supply ports.
• High-pressure loop EGR system: EGR gas is extracted upstream of the turbine
and re-introduced downstream of the compressor. The intake air pressure is higher
than the exhaust gas pressure in the stripe region in figure 2.5, so that fresh air would
flows into the exhaust pipe when the EGR valve is opened [10].
• Low-pressure loop EGR system: EGR gas is extracted downstream of the turbine
considered now shows a pressure difference in the direction required. This means that
LP-EGR system can introduce EGR gas in a larger area than the HP-EGR system,
in particular in the low-speed, high-load region [10]. Since this operating condition is
the one that will be reached in a transient condition and considering how likely is the
knock phenomenon in this region, then it can be easily understood why this solution
is preferable.
• Mixed-pressure loop EGR system: EGR gas is extracted upstream of the turbine
and introduced upstream of the compressor. This solution shows a larger pressure
difference with respect to the LP-EGR system in the same enclosed region. However
because of the fact that Mixed-EGR systems are installed upstream of the turbine,
some troubles are experienced in the transfer of exhaust gas dynamic pressure to the
turbine. This causes turbocharging efficiency to decline while no decline is experienced
by the LP-EGR system. This means that the Mixed-EGR system cannot generate
enough torque in the low speed condition even if the differential pressure is large. [10].
(a)Schematic of configuration (b) Pressure difference between EGR gas extraction and supply ports
2. BACKGROUND AND STATE OF THE ART
(a)Schematic of configuration (b) Pressure difference between EGR gas extraction and supply ports
Figure 2.6: Low Pressure Loop configuration [10]
(a)Schematic of configuration (b) Pressure difference between EGR gas extraction and supply ports
For the engine considered in this study, a Low Pressure EGR system has been chosen because of the greatest advantage on improving fuel economy in the turbocharged region.
This is due to the fact that this EGR solution allows to recirculate gases also in the high
load/low speed region. This area is the most critical in terms of knocking combustion and
therefore it is important to exploit also here the reduction in terms of temperature that the
recirculation of exhaust gases allow. As a consequence, the spark timing can be advanced
reducing the temperature at the turbine inlet. The combined effect of reduced knock risk
and reduced temperature at the turbine inlet result in a lower enrichment required. This
explains why the LP EGR solution helps in improving the fuel efficiency.
2.5
Exhaust Cylinder Head Integrated Manifold
The exhaust manifold presents a configuration calledCHIM, that stands forCylinder Head Integrated Manifold. What happens in this case is that the conventional exhaust manifold is completely integrated in the cylinder head. As a consequence, only a single pipe feeds
directly into the turbocharger resulting in a much more compact solution [38].
As can be seen from Figure 2.8, a reduction of approximately 30% of the overall surface
area up to the turbo result can be achieved. During cold-start conditions this allows to
reduce the necessary time needed for the catalyst to reach its operating temperature of
350◦. Here the effect of the reduced amount of thermal losses due to the more compact
design are stronger than the effect of the increased heat exchange that is experienced with
an higher portion of the system being in contact with the liquid coolant [38]. Due to the
fact that from Euro3 the New European Driving Cycle mandates the test to be performed
in a cold-start condition, this solution could result helpful for manufactures.
In addition to general reduction in overall dimensions, the introduction of an Exhaust
CHIM resulted also in a significant increase of the water cooled surface. Once the
steady-state has been achieved, this results in exhaust temperatures significantly lower than in the
case of a regular manifold system. Thanks to this, the enrichment of the charge normally
necessary to avoid overheating and component damage is no longer required. Stoichiometric
2. BACKGROUND AND STATE OF THE ART
Figure 2.8: Differences between a standard exhaust system and a CHIM one [38]
2.6
Turbocharging
2.6.1 Introduction
To understand how this system helps the engine reaching higher specific outputs, recall that
the maximum power a given engine can deliver is limited by the amount of fuel that can be
burned efficiently inside the engine cylinder. This is limited by the amount of air that is
introduced into the cylinder each cycle. From equations 2.6.1,2.6.3, and 2.6.2 one can see
that , if the air is compressed to a higher density value than ambient prior to entry into the
cylinder,then the torque that an engine of fixed dimensions can deliver will be increased.
This will result in increased torque and power
Pb = bmep·Vdisp·RP M
2·60 (2.6.1)
τb = bmep·Vdisp
2π·2 (2.6.2)
bmep = ηb·ηv·LHV ·ρinf
There are different ways in which this increase of inlet charge density can be achieved:
• Mechanical supercharging: a compressor directly powered by the engine is exploited to compress the intake air. With this solution the achievable power output increase
is limited by the parasitic losses experienced in driving the compressor. As a result
also the BSFC will increase. [46]
• Turbo-charging: air is compressed thorough a compressor driven by a turbine mounted on the same shaft. This turbine component allow to exploit the total enthalpy the
high-temperature exhaust gases that would otherwise be lost to the ambient.
In this study the attention will be concentrated on turbo-charging, a schematic of which
is given in Figure 2.9 and Figure 2.10. A turbocharger consists of two major parts: a compressor and a turbine. In the following paragraphs these and other components such
as charge air cooler and boost control system are described. In addition, some information
about compressor and turbine performance maps will be provided. It will be explained
how these tools allow to address the difficult task of turbocharger matching whose overall objective is to fit a turbocharger with the most suitable characteristics to an engine in order
to obtain the best overall performance from it[14]. Internal combustion engines used in the
automotive field are capable of operating over wide speed ranges, but turbochargers are not
able to operate in their highest efficiency area over all this range. The performance of
turbo-machines is dependent on the angles at which the gas flow enters in the impeller, diffuser
and turbine rotor. In theory the blade angles should be set to match these gas angles, but in
practice a correct match can be obtained only for a specific rotor speed [43]. Away from this
design point the gas angle will not match the blade angle and an incidence loss occurs due
to separation and subsequent mixing of high and low-velocity fluid. The losses will increase
with increasing incidence angles, hence turbo-machines are not well suited for operation
over a wide flow range [27]. Due to the fact that it is possible to correctly match the
turbocharger to the engine only at a particular point in the operating range of the engine,
a compromise must be made when considering the rest of the range. This compromise will
2. BACKGROUND AND STATE OF THE ART
Figure 2.9: Example of a turbocharger system [43]
2.6.2 Compressor
Design and function
The compressor is the element that actually produces the required pressure level increase of the ambient air that has been drawn into the system. In theory both axial and radial
types could be used, however only the latter can be found on the automotive market. One
reason for this can be found in the higher pressure ratios that can be achieved in a single
stage. This translates in reduced dimensions and weight, something that car manufacturers
are always looking for due to the very strict packaging constraints and the goal of fuel
con-sumption reduction. In addition, this solution also provides a higher tolerance to differences
in the inlet flow conditions [43]. This makes it suitable to be matched with an internal
com-bustion engine, whose flow in normal driving conditions is everything but constant. Radial
compressors used for automotive’s application are of the centrifugal type, in which the air is admitted in the compressor along the axial direction and then expelled radially. The
essential components of this system are three and are the impeller, the diffuser and the
volute housing.A brief description of how these elements help generating a pressure increase
inside the compressor is now given [26].
First of all the impeller is exploited in order to accelerate the flow increasing its kinetic energy content while at the same time some of this kinetic energy is converted into static
pressure due to the increasing of the cross-sectional flow area between the blades. Once the
flow exits the compressor wheel, no more energy will be externally provided. It is now task
of thediffuser to slow down the high velocity air in the most efficient way possible in order to increase the static pressure. The most used type of diffuser in automotive applications is
thevaneless one. Even if with this solution some efficiency is sacrificed and a lower pressure recovery can be achieved in ideal conditions, however the reduced manufacturing costs and
also the improved behaviour over a wide flow range has lead to a more widespread use of
this configuration. Once out of the diffuser the air-flow is then collected in a spiral shaped
volute housing whose cross sectional area is increasing in the flow-direction. This helps in further converting kinetic energy into pressure content before air is finally expelled along
2. BACKGROUND AND STATE OF THE ART
One of the most critical components of a compressor are the compressor wheel blades. Their profile is curved in such a way that it is possible to change the axial direction of the
flow into radial while simultaneously accelerating the flow to high velocity. The way this
profile is shaped can largely affects performance and durability. It is in fact to remember
that due to the extremely high rotational speeds (in the order of 150000-200000 RPM)
reached by a turbocharger system, those components are subjected to significant bending
stresses and centrifugal forces. Another aspect to take into consideration are the related
manufacturing costs. Blades require extremely tight tolerances with the housing in order to
reduce as much as possible the amount of back-flow. A solution that is sometimes applied
is to coat the stationary housing with an abradable material softer than the one used for
the blades. Then the unnecessary additional coating will be removed keeping the clearances
with the blade to a minimum [40].
Compressor map
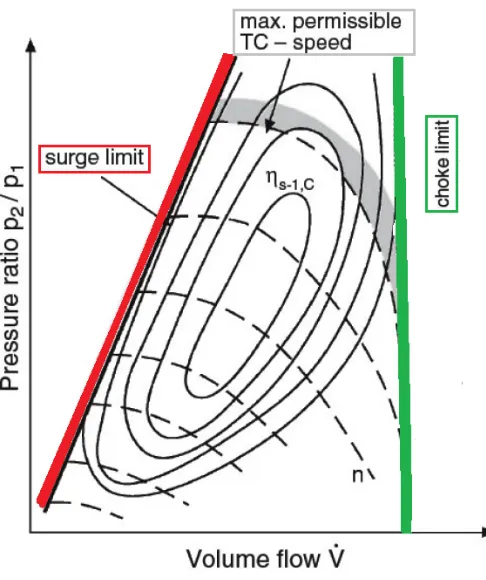
Thecompressor map defines the performance of the machine and it is used when evaluating the required turbocharger compressor for a specific engine application. It gives an immediate
overview of the compressor operating behaviour in terms of mass flow rate, pressure ratio,
shaft speed and efficiency, as can be seen from Figure 2.11. Not all the points present in
the map are usable and the in fact the area where the compressor can operate is enclosed
by the surge limit curve, the choke limit curve and the compressor maximum speed limit
curve. Those limit conditions will be now described more in detail [27] [43] [46]:
• Surge limit: establishes the lowest airflow at which the compressor can operate for
each pressure ratio. What happens at this low flow conditions is that flow can no
longer adhere to the blades and separation occurs, potentially leading to a situation
in which the pressure in the diffuser is lower than the delivery pressure. This would
reverse the flow in the compressor until resistance thorough the diffuser drops enough
for air discharge to be restarted. This process is repeated cyclically leading to potential
damages of the blades.
In these high flow and high shaft speed conditions, a point can be reached after which
the flow cannot remain attached to the impeller blades resulting in a flow separation.
As a consequence of this separation the effective flow area is reduced increasing the
possibility for this high speed flow to reach sonic speed. When this happens no further
flow rate increase is possible [26].
• Compressor maximum speed: establishes the maximum speed that can be reached
by the compressor, usually due to material limitations [31].
Figure 2.11: Example of a compressor map with highlighted the areas on which the system
cannot operate
Since the engine is required to operate over a range of speeds and loads, then a set of
constant speed and constant load lines may be drawn on the compressor characteristic to
represent the operating range. The compressor is matched by choosing the best combination
of impeller and diffuser such that the engine operating characteristic lie in the area described
2. BACKGROUND AND STATE OF THE ART
unexpected problems occurring in particular conditions like in case of pulsations in the
intake system.
2.6.3 Turbine
Design and function
In order for the compressor to perform its task, a driving element is needed. This mission is
accomplished by theturbine, a component whose purpose is to to extract part of the energy
present in the exhaust gases. Due to their high temperature, those gases are characterized
by a high enthalpy content and this can be exploited to spin the turbine through their
expansion. This solution avoids wasting this energy as instead it happens in the case of
naturally aspirated engines that expel those gases directly into the ambient. With reference
to the inlet flow direction, there are three types of turbines that could potentially be used:
mixed-flow, axial-flow andradial flow. The latter is in general the most attractive solution in the automotive field due to some advantages in terms of manufacturing costs and simplicity,
space occupied and temperature profile in the high-stress blade root area [31]. On the
contrary with respect to the compressor case, here we are dealing with acentripetal machine
in which the exhaust flow enters the turbine from the external scroll and then is expelled
along the axis. Independently from the configuration considered, it is important to underline
that each turbine stage is composed of a stationary part and a rotating part, and that process
by which energy is recovered from the exhaust is the same. At first the flow is directed
into the stationary part in which, due to the converging cross-sectional area, it is possible convert part of a pressure drop in an increased kinetic energy level. This turbine entry can
be of the mono-scroll or double scroll type, but this will be object of a deeper study in the
rest of the thesis. Once the flow has passed through this first element, then it reaches the
rotor, a rotating disk with blades angled in order to receive the flow from the stator with minimum disturbance when the operating conditions are the designed ones. Here the flow
impacts against the blades resulting in a change in tangential momentum and a force to
be exerted on the blades. The energy absorbed by the blades is used to spin the turbine
output shaft that is rigidly connected to the rotor. The flow that is coming out from the
through a diffuser an higher static pressure level can be achieved increasing the turbine
power output for a given inlet and discharge conditions [31].
Turbines operate in a hostile environment. The exhaust gases that drives them are very
corrosive and they can reach temperatures in the order of 1050◦C. In addition to that, due
to the high speeds at which turbocharger operates, very high tensile loads are experienced
due to the centrifugal forces as well as bending and vibratory loads. Due to these extreme
conditions, nickel-based alloys are required as the construction material for turbine wheels
due to capability of this material to retain high strength values at high values of temperature
[43].
Turbine map
The turbine map defines the performance characteristic of the machine and gives an
immediate overview of the turbine operating behaviour in terms of mass flow rate, pressure
ratio, shaft speed and efficiency, as can be seen from Figure 2.12.
2. BACKGROUND AND STATE OF THE ART
The way information are displayed here is different with respect to the compressor map.
In this case, on the x-axis one can see the pressure ratio while on the y-axis are found both
the reduced turbine mass flow at different turbine speeds and the efficiency at different
turbine speeds. The first family of curves often form a curve that is almost continuous
while for the second family often it is drawn a line passing through the peak efficiency
point. This last one is referred to as the swallowing capacity and represents the desired operating curve of the turbine.
An important parameter for turbine performance is the A/R ratio. With reference to
figure 2.13, it is defined as the ratio of the inlet cross-sectional of the housing area divided
by the radius from the turbo centreline to the centroid of that area.
Figure 2.13: Illustration of compressor housing showing A/R characteristics [45]
This parameter can be used to match the swallowing capacity of the turbine to the flow
from the engine. In general, using a small A/R ratio an increase in the exhaust gas velocity
into the turbine will be experienced. This helps increasing turbine power at lower engine
speeds and thus results in a quicker boost rise. A drawback of this solution is that the
ultimate flow capacity of the turbine is decreased. As a consequence, exhaust back-pressure
is increased and thus the ability of the engine to breath at high RPM is reduced with a
in reduced exhaust gas velocity and delayed boost rise. Flow capacity is instead increased
allowing better power at higher engine speeds [45].
2.6.4 Waste-gate
Thewastegate is a valve that allows a certain amount of exhaust flow to bypass the turbine wheel. This is the simplest form of boost control, needed in order to control the amount
of pressure increase reached in the intake manifold. This kind of control may be needed
in order to match the required load or also in order not to exceed the knocking limit. In
extreme cases the amount of boost that the turbocharger system is capable of providing can
be so high that it will result in a broken engine, due to the material limitations in handling
too high pressure level, and/or a broken turbocharger, due to over-speeding. In this case
the operating principle of a waste-gate valve allow to avoid those destructive situations.
However those represent in general very extreme situations. In most of the cases the
waste-gate function is to control that a certain target is reached. What is actually done to perform
this control task is to regulate the amount of exhaust flow over the turbine wheel, in most
of the cases through a pneumatically controlled valve of the same type as the one shown in
Figure 2.14. Due to the high temperatures experienced on the turbine side, this actuator
is often mounted on the compressor side and connected to the valve by a rod.
Figure 2.14: Example of a pneumatically actuated wastegate valve

![Figure 2.5: High Pressure Loop configuration [10]](https://thumb-us.123doks.com/thumbv2/123dok_us/1382306.1170905/39.612.146.507.432.650/figure-high-pressure-loop-conguration.webp)
![Figure 2.6: Low Pressure Loop configuration [10]](https://thumb-us.123doks.com/thumbv2/123dok_us/1382306.1170905/40.612.144.501.103.321/figure-low-pressure-loop-conguration.webp)
![Figure 2.8: Differences between a standard exhaust system and a CHIM one [38]](https://thumb-us.123doks.com/thumbv2/123dok_us/1382306.1170905/42.612.170.490.91.331/figure-dierences-standard-exhaust-chim.webp)
![Figure 2.9: Example of a turbocharger system [43]](https://thumb-us.123doks.com/thumbv2/123dok_us/1382306.1170905/44.612.114.541.410.652/figure-example-of-a-turbocharger-system.webp)
![Figure 2.13: Illustration of compressor housing showing A/R characteristics [45]](https://thumb-us.123doks.com/thumbv2/123dok_us/1382306.1170905/50.612.225.419.299.519/figure-illustration-compressor-housing-showing-r-characteristics.webp)
