ABSTRACT
BENCZE, ORSOLYA CSILLA. The Development of a Certification Program for Natural Disaster Resilient Homes. (Under the direction of Dr. David Tilotta, Dr. Sudipta Dasmohapatra, Dr. Ilona Peszlen and Dr. Kimberly Weems.)
Natural disasters such as hurricanes, floods, and earthquakes can occur anywhere in the United States. These occurrences cause millions of dollars of economic damage and result in extended recovery time. The largest component of the economic damage during these disasters is to residential properties that lead to delayed return of residents and in many cases they are impossible to return to their homes years after the natural disaster.
This dissertation is partitioned into 3 studies. In the first study, a survey about the public perception of resilience of housing to natural disasters was conducted in 2008. The objective was to get an overall opinion from homeowners, builders, and other stakeholders from the Southeastern states to explore any educational and technical gaps. More than 350 surveys were obtained with the majority of the respondents being homeowners (90%) and those that experienced natural disaster (75%). The most significant finding was that more than 90% of the respondents thought that homeowners need to be better educated on natural disaster resilience of homes.
focus groups were conducted with a diverse 25-member expert stakeholder group including homeowners, builders, insurance agents and representative from federal and state government) to develop a comprehensive, universal rating system, for common natural disasters e.g., wind, rising water, storm surge, wind-driven rain, earthquake, hail, wildfire, etc. The ReScU framework includes four key operational features: 1) an output system that can be tied to incentives, 2) the use of performance-based evaluation criteria for home resilience, 3) utilization of “threshold” adjustments to represent location of homes, and 4) adaptability to new technologies. These features are likely to assist homeowners, homebuilders, and others in designing, building, and maintaining more natural disaster resilient homes, accelerate the recovery time and decrease the economic impact of natural disasters.
In the third study, a preliminary scoring mechanism for homes using the ReScU system was developed. The scoring system was based on the performance of different elements of the house (e.g. a roof system, wall system, foundation) for specific natural disasters. Separate performance-based inventories were developed for each natural disaster peril specified in the ReScU system (wind, rising water, storm surge, wind-driven rain, earthquake, fire, wildfire, hail, and mudslide). Each of the Inventories have a standardized structure beginning with the elements of the house and the performance-based requirements for reinforcing the elements, and offer best practice recommendations regarding material and design characteristics at a specific location.
The Development of a Certification Program for Natural Disaster Resilient Homes
by
Orsolya Csilla Bencze
A dissertation submitted to the Graduate Faculty of North Carolina State University
in partial fulfillment of the requirements for the Degree of
Doctor of Philosophy
Forest Biomaterials
Raleigh, North Carolina 2011
APPROVED BY:
_______________________________ ______________________________
Dr. David Tilotta Dr. Sudipta Dasmohapatra
Chair of Advisory Committee Co-Chair of Advisory Committee
________________________________ ________________________________
Dr. Kimberly Weems Dr. Ilona Peszlen
DEDICATION
BIOGRAPHY
ACKNOWLEDGMENTS
This dissertation would not have been possible without the guidance and support of several individuals who contributed in many ways to the completion of my studies. I owe my deepest gratitude to my advisors, Dr. David Tilotta and Dr. Sudipta Dasmohapatra for their support, patience, and encouragement. Their professional and editorial advice was essential and taught me valuable insights about academic research. I appreciate the financial support and the opportunity to be a member of the Resilient Home Program.
My thanks also go to the members of my advisory committee, Dr. Ilona Peszlen for her valuable advice to improve my work and for her critical reading of my dissertation and Dr. Kimberley Weems for her guidance and suggestions on the statistical analysis and for supporting me to pursue a minor in statistics.
I am very thankful to my fellow graduate students, Dr. Maria Soledad Peresin and Nathan Irby for their friendship and support. I appreciate the friendship of Andrea Kecskes and Annamaria Polgar and several others in the US and in Hungary for their support and for believing in me.
TABLE OF CONTENTS
LIST OF TABLES ... vii
LIST OF FIGURES ...ix
CHAPTER 1 ... 1
Literature Review ... 1
Natural Disasters in General ... 1
Natural Disasters in Numbers ... 3
Economic and Insured Loss... 13
The Effect of Natural Disasters on the Insurance Industry ... 14
The Effect of Building Codes on Residential Housing ... 18
References ... 25
CHAPTER 2 ... 1
Perceptions on the Natural Disaster Resilience of Homes in the Southeastern United States ... 29
Abstract... 29
Introduction ... 30
Methodology and Survey Design ... 33
Results and Discussion ... 34
Demographics ... 34
Sources of Information ... 37
Needs of Homeowners ... 39
Perceptions of Housing Survivability ... 40
Factors in Disaster Preparedness and Recovery... 42
Summary and Conclusions ... 45
Acknowledgements ... 46
References ... 47
CHAPTER 3 ... 49
A Performance-based Rating System for Home Resilience: The ReScU Concept ... 49
Abstract... 49
Introduction ... 51
Methodology ... 54
Review of Existing Building Programs ... 54
Result and Discussion ... 58
Hazard Perils in the ReScU Framework ... 59
Performance-Based Inventory and the “Building Score” ... 60
Hazard Thresholds ... 62
The ReScU Score ... 64
Applying the ReScU System: Varying Locations ... 66
Conclusions ... 75
Acknowledgments ... 76
References ... 77
CHAPTER 4 ... 79
Development of the Performance-Based Inventories and the Scoring Mechanism ... 79
Abstract... 79
Introduction ... 80
Materials and Methods ... 83
Development of the Inventories ... 83
Result and Discussion ... 84
Organization of the Inventories ... 84
Organization of the Preliminary Scoring Mechanism for Inventories ... 88
Application of the Inventories ... 89
Application of the Scoring Mechanism ... 92
An Example Application of the Scoring Mechanism ... 94
Future Directions ... 97
Summary and Conclusions ... 98
References ... 100
SUMMARY AND CONCLUSIONS ... 101
RECOMMENDATIONS FOR FUTURE WORK ... 105
LIST OF TABLES
CHAPTER 1
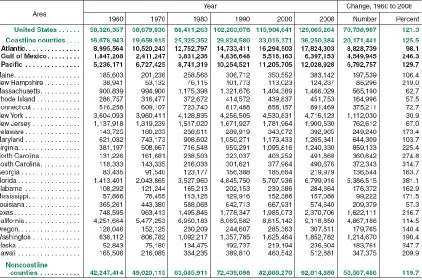
Table 1. Housing units for coastline counties by state 1960-2008. U.S. Census Bureau, Decennial census of population and housing: 1960 to 2000; Population Estimates Program: 2008. (US Census Bureau 2010) ... 6 Table 2. Coastline population by state: 1960-2008 U.S. Census Bureau,
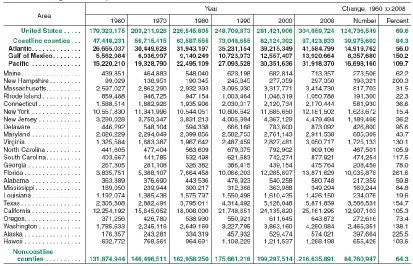
Decennial census of population and housing: 1960 to 2000; Population Estimates Program: 2008. (US Census Bureau 2010) ... 7 Table 3. The twenty most costly insured catastrophes in the world,
1970-2008. (Kunreuther and Michel-Kerjan 2009a) ... 15 Table 4. Housing damage caused by natural disasters (Comerio 1997;
Edwards and Iskowitz 2010) ... 18
CHAPTER 2
Table 5. Summary of responses to the residential construction survivability question “Which of the following items in residential construction have the most problems surviving natural disasters? (Check all that apply!)” by natural disaster types. ... 41 Table 6. Chi-square and Spearman‟s correlation summary table of different
attributes before and after natural disaster events ... 43
CHAPTER 3
Table 7. The ReScU spreadsheet ... 66 Table 8. General ReScU spreadsheet for the example house ... 67 Table 9. ReScU Spreadsheet for the example house located in a hurricane
Table 10. ReScU Spreadsheet for the example house located in a wildfire prone area ... 70 Table 11. ReScU Spreadsheet for the example house located in a flood
prone area ... 72 Table 12. ReScU Spreadsheet for the example house located in a non-flood
prone area ... 74
CHAPTER 4
Table 13. The preliminary scoring mechanism for the rising water Performance-Based Inventory ... 93 Table 14. Practical example of the scoring mechanism for the rising water
LIST OF FIGURES
CHAPTER 1
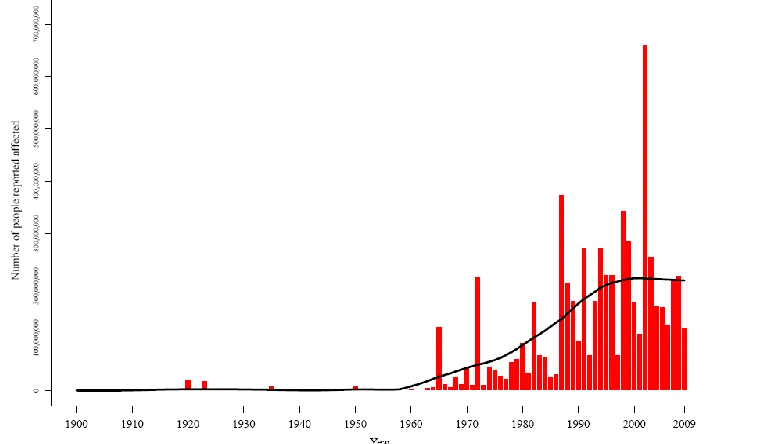
Figure 1. Average annual damages ($US billion) caused by reported natural disasters 1990-2009 EM−DAT: The OFDA/CRED International Disaster Database − www.emdat.be − Université Catholique de Louvain, Brussels – Belgium ... 4 Figure 2. Number of people reported affected by natural disasters
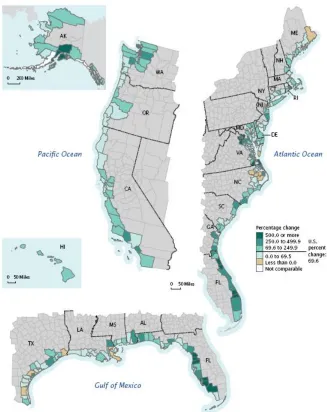
1900-2000. EM−DAT: The OFDA/CRED International Disaster Database− www.emdat.be − Université Catholique de Louvain, Brussels – Belgium, ... 5 Figure 3. Change in coastline population by county: 1960-2008 U.S. Census
Bureau, Decennial census of population and housing: 1960 to 2000; Population Estimates Program: 2008. (US Census Bureau 2010) ... 8 Figure 4. Comparison of domestic net migration by state: 1990-2000 and
2000-2004 U.S. Census Bureau, Population Estimates Program, 2004. (US Census Bureau 2006)... 10 Figure 5. Distribution in percentage of natural disasters by type (ISDR 2005) ... 11 Figure 6. Burned area in wildfires between 1960-2009 National Interagency
Fire Center Total wild land fires and acres (National Interagency Fire Center 2009) ... 12 Figure 7. Economic and insured losses from great natural catastrophes
worldwide, 1950-2007. (Kunreuther and Michel-Kerjan 2009a) ... 13 Figure 8. Insured coastal exposure of residential and commercial properties
as percentage of statewide insured exposure, December 2007. Data from AIR Worldwide Corporation. (Kunreuther and
Michel-Kerjan 2009a) ... 16 Figure 9. Total value of insured coastal exposure of residential and
from AIR Worldwide Corporation. (Kunreuther and Michel-Kerjan
2009a) ... 16
Figure 10. Damaged two-story residential building (Mehta et al. 1992) ... 17
Figure 11. The result of vinyl siding and nonstructural siding loss in a subdivision (van de Lindt et al. 2007) ... 17
Figure 12. Carport collapsed due to high wind. (van de Lindt et al. 2007) ... 17
Figure 13. Percentage of uninhabitable homes within a subdivision, by year built and wind speed. (Fronstin and Holtmann 1994) ... 19
Figure 14. The manufactured home in the background was two months old, the one in the foreground was manufactured before 1994. (Reinhold et al. 2005) ... 21
Figure 15. Percentage of homes with roof cover damage by wind zone and building code, wind zone 8&9 – 110-120mph, wind zone 10 – 130-140mph, wind zone 11 – 140-150mph (Reinhold et al. 2005) ... 21
CHAPTER 2 Figure 16. Distribution of the survey respondents by state ... 34
Figure 17. Homeownership of survey respondents ... 35
Figure 18. Natural disaster experience of respondents ... 35
Figure 19. Types of experienced natural disasters ... 35
Figure 20. Reported damage after natural disasters ... 36
Figure 21. Reported damage after hurricane event ... 36
Figure 22. Reported damage after flood event ... 37
Figure 23. Primary source of information after a natural disaster ... 37
CHAPTER 3
Figure 25. An example building score ... 61
Figure 26. An example ReScU system chart ... 64
Figure 27. ReScU Score for a hurricane prone and flood zone area ... 69
Figure 28. ReScU Score for a wildfire prone area ... 71
Figure 29. ReScU Scores for a flood prone area ... 73
Figure 30. ReScU Score for a non-flood prone area ... 74
CHAPTER 4 Figure 31. Organization of the Performance-Based Inventories ... 85
CHAPTER 1
LITERATURE REVIEW
Natural Disasters in General
Over the past few decades, climate change has been a growing concern among scientists and policy makers from different parts of the world. The Earth‟s climate is changing due to global population growth and increased greenhouse gas emissions (Van Aalst 2006). The most alarming impact of climate change is on the extreme weather events that could result in an increased number of natural disasters. Sea level rise could cause substantial inundation, flooding due to storm surge, and could erode the shores and the coastal ecosystem (Field et al. 2007). In addition, the increased ocean temperature is likely to increase the evaporation rate of water that may result in an increase in tropical cyclones‟ intensity and precipitation (Kunreuther and Michel-Kerjan 2009a). The Intergovernmental Panel on Climate Change (IPCC) (IPCC 2001) predicts that the tropical cyclones‟ intensity and precipitation could increase by 5-10% in wind speed and 20-30% in precipitation in the coming century. Moreover, the number of category 4 and 5 hurricanes between 1975-1989 and 1990-2004, in the Atlantic, Gulf of Mexico, and Caribbean, increased significantly from 16 to 25, respectively, due to global warming environment (Webster et al. 2005).
environment depend greatly on the ability of people and communities and how they prepare for, cope with, and recover from the natural disasters (Thomalla et al. 2006).The effects of climate change can vary by region, and it can even result in some “positive” effects, such as a boost in agriculture and less demand for heating and cooling (Van Aalst 2006). On one hand, people become more resilient to weather extremes as they adapt to new environmental conditions, e.g., by changing agricultural crops, redesign of infrastructure and structure of society, etc. On the other hand, extreme weather events can cause damage to infrastructure, property and community structures. For example, tropical cyclones increase the damage to coastal buildings and infrastructure, and more frequent storms create higher risk to human lives and health, and property and infrastructure losses (Van Aalst 2006).
events is one such preventative action that is reported to help reducing the vulnerability of homeowners and communities to existing and future extreme weather events (Schipper and Pelling 2006).
Natural Disasters in Numbers
In essence, based on their frequency and consequences, natural disasters can be categorized into two major types: low probability-high consequence and high probability-low consequence natural disasters (Changnon 2003). The former category includes those events that are irregular but cause billion dollar losses, i.e., flood, hurricane and winter storm. The second category includes usually frequent events that result in considerably low losses, i.e., thunderstorm, tornado and lightning. Although their annual damage could be significant due to their more frequent occurrence, it is still substantially less than the annual damage caused by floods and hurricanes. Nonetheless, natural disasters have significant impact on the society, the insurance industry, home and business owners, the state and federal governments and local communities (Kunreuther and Roth 1998).
as well, although in Asia or Africa earthquakes are a more prevalent natural disaster (International Disaster Database 2009a).
Figure 1. Average annual damages ($US billion) caused by reported natural disasters 1990-2009 EM−DAT: The OFDA/CRED International Disaster Database − www.emdat.be −
Université Catholique de Louvain, Brussels – Belgium (International Disaster Database 2009a)
people affected by natural disasters (Figure 2). The following section explains the trends in population growth and movement as it relates to different natural disasters.
Figure 2. Number of people reported affected by natural disasters 1900-2000. EM−DAT: The OFDA/CRED International Disaster Database− www.emdat.be − Université Catholique
de Louvain, Brussels – Belgium, (International Disaster Database 2009b)
Hurricanes
inappropriate land use are a few examples of the determinants of the increase in vulnerability to natural disasters (Thomalla et al. 2006).
In the United States, based on the U.S. Census Bureau (2010), the number of residential housing units on coastlines (Atlantic, Gulf of Mexico and Pacific) increased from 16.1 million to 36.3 million between 1960 and 2008 (Table 1). This population increase is significant considering that the coastal population rose in numbers from 47 million to 87 million from 1960 to 2009 (Table 2, Figure 3).
Figure 3. Change in coastline population by county: 1960-2008 U.S. Census Bureau, Decennial census of population and housing: 1960 to 2000; Population Estimates
Program: 2008.(US Census Bureau 2010)
claims that 53% of the U.S population lives in coastal counties. Under this definition, San Bernardino County in California is considered to be a coastal county although it is “completely land blocked”. The Federal Emergency Management Agency (FEMA) defines coastal county as one that “has a coastline bordering the open ocean or Great Lakes coasts and contains velocity zones (V-Zones)1” (Crowell et al. 2007). The U.S. Census Bureau uses the definition of the National Oceanic and Atmospheric Administration (NOAA) that defines the coastal county as “those counties that border coastal water or territorial sea” (US Census Bureau 2010). Using geographic information system (GIS) census block groups were created by the U.S. Census Bureau that included only those counties that “touched open water or inlets”. Based on this modification, only 30 percent of the U.S population (excluding the Great Lakes) is considered to live in coastal counties. No matter what definition is considered, currently more than 30% of the U.S population lives in coastal counties where hurricanes and tropical storms are a growing concern, and this population is increasing over time (Crowell et al. 2007) (Figure 4).
1
Figure 4. Comparison of domestic net migration by state: 1990-2000 and 2000-2004 U.S. Census Bureau, Population Estimates Program, 2004.(US Census Bureau 2006)
Flood
Globally, the frequency and intensity of flood events increased in the last few years (Berz 2000). Between 1970 and 1995, approximately 1.5 billion people were affected by floods and as a result 81 million become temporarily homeless (Pielke Jr and Downton 2000). Flood damage contributes approximately one third of the global natural disaster related economic losses (Figure 5).
agency reports, and structural damages on buildings. In the last decade, the annual flood damage ranged from 5 billion dollars in 1999 to 42 billion dollars in 2004, excluding the flood damage caused by Hurricane Katrina and Hurricane Rita (NWS 2009).
Wildfires
The number of wildfire events shows significant increase throughout the past decades. As a consequence of climate change, warmer temperatures cause longer summer intervals which contribute to greater intensities and duration of wildfires (Running 2006). For instance, in the western part of the United States, the wildfire season has increased by 78 days (Westerling et al. 2006), which represents an increased threat to natural forests and communities (Schoennagel et al. 2004). According to the National Interagency Fire Center (NIFC), the burned land area increased from 5 million hectare to 7.2 million hectare from 1988 to 2002 (National Interagency Fire Center 2009) (Figure 6).
Economic and Insured Loss
As indicated previously (Changnon 2003) , the increase in losses caused by natural disasters is more likely due to societal changes than due to global warming or climate change. Economic losses are defined as “market-based negative economic impacts and include the cost associated with the aftermath of extreme events”. Estimating the economic loss of a natural disaster is extremely difficult due to the lack of information, impropriate data keeping, and many different data sources. For example, data records are available from government agencies, insurance claims, economic models, scientific institutions, and the agricultural industry. However, it is difficult to compare the natural disaster related economic losses for separate years because data are in different formats for different years and the type of data vary by agencies. Despite these difficulties comparing data across time, Kunreuther and Michel-Kerjan(2009a) found an increasing trend in the insured losses related to natural disasters (Figure 7).
The graph in Figure 7 shows that the insured portion of the economic loss was increasing but was small compared to the trend of overall losses that increased more rapidly. The economic loss increased from $53 billion in 1950-1959 to $778.3 billion in 1990-1999. The economic loss totaled $420.6 billion in 200-2007 due to the very active 2004 and 2005 hurricane season at the Atlantic coast (Kunreuther and Michel-Kerjan 2009a).
The Effect of Natural Disasters on the Insurance Industry
insurance agencies have the capability to use better catastrophic models to predict their disaster-specific insured portfolio for a hazard prone area.
Table 3.The twenty most costly insured catastrophes in the world, 1970-2008. (Kunreuther and Michel-Kerjan 2009a)
represents around $2.5 billion worth of insured residential and commercial value (Figure 9).
Figure 8. Insured coastal exposure of residential and commercial properties as percentage of statewide insured exposure, December 2007. Data from AIR Worldwide Corporation.
(Kunreuther and Michel-Kerjan 2009a)
Figure 9. Total value of insured coastal exposure of residential and commercial properties, December 2007 (billions of dollars). Data from AIR Worldwide Corporation. (Kunreuther and
Michel-Kerjan 2009a)
billion dollars in wind related damages to residential construction, annually (Li and Ellingwood 2006; van de Lindt et al. 2007). Since, higher portion of the population and property are exposed to natural disasters, the economic and direct losses are more likely to increase, unless serious preventative measures are taken.
Figure 10. Damaged two-story residential building (Mehta et al. 1992)
Figure 11. The result of vinyl siding and nonstructural siding loss in a subdivision (van de Lindt et al. 2007)
The Effect of Building Codes on Residential Housing
Although the economic loss from natural disasters is high, the mortality rate associated with them is decreasing due to the rapid development of weather forecast technologies, awareness, communication channels, and transportation strategies that leads to faster evacuation from hazardous areas (Fronstin and Holtmann 1994; Goklany 2007). On the other hand, the damage caused by various natural disasters on residential housing is still a growing concern (Table 4).
Table 4.Housing damage caused by natural disasters (Comerio 1997; Edwards and Iskowitz 2010)
Natural Disaster Year Number of Houses Destroyed or Damaged
Hurricane Hugo 1989 36,000
Oakland Firestorm 1991 3,000 Hurricane Andrew 1992 80,000 Northridge Earthquake 1994 60,000 Hurricane Katrina 2005 n/a*
*Actual number of units is not available, but approximately 90% of the residential and commercial buildings were destroyed in the Biloxi-Gulfport area in Mississippi State.
example, in Dade County, Florida, in 1992, there were only 60 building inspectors who were responsible for inspecting an average of 20,000 new construction projects, annually. This accounts for approximately 35 inspections a day (4 inspections/hour) which is impossible to execute properly. Another factor contributing to property damage is the erosion of building codes (less stringent standards) (Fronstin and Holtmann 1994). A study conducted in Florida after Hurricane Andrew revealed that newer homes (less than 10 years old) suffered significantly more damage than older homes (built around 1960) (Figure 13).
Figure 13. Percentage of uninhabitable homes within a subdivision, by year built and wind speed. (Fronstin and Holtmann 1994)
faster construction time but resulted in lower structural quality. In addition, those changes degraded the construction price that led to better marketability of the home at lower selling prices. Approximately 33% of the damage to homes could have been avoided if more stringent (older) building codes had been applied to the newer homes. Similar conclusions were drawn by Kunreuther and Michel-Kerjan (2009b) who reported that, approximately 25% of the insured property loss could have been avoided after Hurricane Andrew by following proper building code.
Figure 14. The manufactured home in the background was two months old, the one in the foreground was manufactured before 1994. (Reinhold et al. 2005)
Figure 15. Percentage of homes with roof cover damage by wind zone and building code, wind zone 8&9 – 110-120mph, wind zone 10 – 130-140mph, wind zone 11 – 140-150mph
(Reinhold et al. 2005)
*Note: Although, the overall results of the study suggested that newer homes were less prone to damage, wind zone 8&9 shows a slight discrepancy within these results. The authors did not disclose, in detail, the possible reason why more new homes failed in wind zone 8&9.
economical losses. These findings are supported by insurance data, that homes built with improved design and construction techniques were subjected to less claims and the requested disbursement was approximately 40% less than homes with older design and construction techniques (Reinhold 2008; Edwards and Iskowitz 2010).
New resilient building programs have also been developed in the last 15 years, such as those by The Federal Alliance for Safe Homes (FLASH), The Institute for Business and Home Safety (IBHS) Fortified Homes and South Carolina Safe Home Program. These programs help their residents reinforce their homes in order to be more resilient against the destructive effects of hurricanes, severe storms, and other high wind events.
is structurally safe. According to (Reinhold et al. 2005), the type of materials used and other building features, such as roof shape, roof age, protection of openings, wall construction, and enforcement of garage doors, affects the wind resistance of homes significantly.
However, in order to encourage homeowners to build more disaster resilient homes, it is important to first understand their basic knowledge of and perception on resilient housing as well as their concerns and needs. In addition, many homes are now following more stringent building codes and using improved materials and construction features, however, there is not a universal rating system that may be used to rate the strength or resilience of them against common natural disasters. A rating system can provide a common framework for an easier comparison between homes on their resilience in different locations. Moreover, incentives attached to the rating program could encourage future and existing homeowners to both design their homes more appropriately and/or apply the necessary reinforcement techniques to increase the survivability of their homes during various natural disasters.
Based on the above discussions, two major gaps were identified:
a) Lack of information on the knowledge of southeastern U.S. residents about residential building practices and preventative techniques
REFERENCES
Adger, W., N. Brooks (2003). "Does global environmental change cause vulnerability to disaster?" Natural disasters and development in a globalizing world: 19.
Berz, G. (2000). "Flood disasters: lessons from the past-worries for the future." Proceedings of the Institution of Civil Engineers, Water Maritime and Energy 142(1): 3-8.
Changnon, S. (2003). "Shifting economic impacts from weather extremes in the United States: A result of societal changes, not global warming." Natural Hazards 29(2): 273-290.
Changnon, S. (2008). "Assessment of flood losses in the United States." Journal of Contemporary Water Research & Education 138(1): 38-44.
Comerio, M. (1997). "Housing issues after disasters." Journal of Contingencies and Crisis Management 5(3): 166-178.
Crowell, M., S. Edelman, K. Coulton, S. McAfee (2007). "How Many People Live in Coastal Areas?" Journal of Coastal Research 23(5): iii-vi.
Culliton, T. (1998). "Population: distribution, density, and growth." NOAA state of the coast report. Silver Spring, MD. Retrived September 8, 2010, from
http://oceanservice.noaa.gov/websites/retiredsites/sotc_pdf/POP.PDF.
Edwards, W., C.J. Iskowitz (2010). "Hurricane Katrina: Five Years Later-Are We Better Prepared?". Retrieved September 9, 2010, from
http://disastersafety.org/resource/resmgr/PDFs/HUR_081710_katrina-anniversa.pdf. Field, C., L. Mortsch, M. Brklacich, D. Forbes, P. Kovacs, J. Patz, S. Running, M. Scott (2007). "North America Climate Change 2007: Impacts, Adaptation and Vulnerability. Contribution of Working Group II to the Fourth Assessment Report of the Intergovernmental Panel on Climate Change, ML Parry, OF Canziani, JP Palutikof, PJ van der Linden and CE Hanson, Eds." Eds ML Parry, OF Canziani, JP Palutikof, PJ van der Linden, CE Hanson: 617–652.
Goklany, I. (2007). Death and death rates due to extreme weather events: global and US trends, 1900-2004. The civil society report on climate change,. London, International Policy Press.
Graumann, A., T. Houston, J. Lawrimore, D. Levinson, N. Lott, S. McCown, S. Stephens, D. Wuertz (2005). "Hurricane Katrina: a climatological perspective." Asheville, NC: National Oceanic and Atmospheric Administration.
International Disaster Database (2009a). "Average annual damages ($US billion) caused by reported natural disasters 1990-2009." Retrieved September 13, 2010, from
http://www.emdat.be/natural-disasters-trends.
International Disaster Database (2009b). "Number of people reported affected by natural disasters 1900 − 2009." Retrieved September 13, 2010, from
http://www.emdat.be/natural-disasters-trends.
IPCC (2001). Climate Change 2001: The Scientific Basis. Contributions of Working Group I to the Third Assessment Report of the Intergovernmental Panel on Climate Change. Cambridge University Press.
ISDR (2005). "Disaster statistics 1991-2005." Retrieved October 26, 2010, from http://www.unisdr.org/disaster-statistics/occurrence-trends-period.htm.
Kunreuther, H. (1976). "Limited Knowledge and Insurance Protection." Public Policy 24(227): 61.
Kunreuther, H., E. Michel-Kerjan (2009a). At War with the Weather: Managing Large-Scale Risks in a New Era of Catastrophes. The MIT Press.
Kunreuther, H., E. Michel-Kerjan (2009b). A New Era of Catastrophes. At War with the Weather Managing Large-Scale Risks in a New Era of Catastrophes
Cambridge, MA, The MIT Press: 3-23.
Kunreuther, H., R. Roth (1998). Paying the price: The status and role of insurance against natural disasters in the United States. Josehp Henry Press. Washington D.C., USA.
Mehta, K., R. Cheshire, J. McDonald (1992). "Wind resistance categorization of buildings for insurance." Journal of Wind Engineering and Industrial Aerodynamics 44(1-3): 2617-2628.
Mendez, I. (2009). "Mason-Dixon Poll Reveals Residents of Coastal States Grossly Unprepared for 2009 Hurricane Season." Retrieved September 2, 2010, from http://www.hurricanesafety.org/media09/HurricaneNewsConferenceRelease-2.pdf. National Interagency Fire Center (2009). "Total Wildland Fires and Acres (1960-2009)."Retrived September 13, 2010, from
http://www.nifc.gov/fire_info/fires_acres.htm.
NWS (2009). "Flood Losses: Compilation of Flood Loss Statistics." Retrieved October 27, 2010, from
http://www.nws.noaa.gov/oh/hic/flood_stats/Flood_loss_time_series.shtml.
Pielke Jr, R., M. Downton (2000). "Precipitation and damaging floods: trends in the United States, 1932–1997." Journal of Climate 13(20): 3625–3637.
Reinhold, T. (2008). "The Case for Strong Well-enforced Building Codes and for Strengthening/Retrofitting/Mitigating Existing Buildings." Retrieved September 9, 2010, from
http://www.ibhs.org/resource/resmgr/pdfs/reinhold_testimonytx_dec308.pdf.
Reinhold, T., K. Gurley, F. Masters, J. Burton (2005). "US Hurricanes of 2004: A Clear Demonstration that Improvements in Building Codes/Enforcement and Construction are Reducing Structural Damage." Disaster Safety Review 4(2): 13-19. Running, S. (2006). "Is global warming causing more, larger wildfires?" Science(Washington) 313(5789): 927-928.
Schipper, L., M. Pelling (2006). "Disaster risk, climate change and international development: scope for, and challenges to, integration." Disasters 30(1): 19-38. Schoennagel, T., T. Veblen, W. Romme (2004). "The interaction of fire, fuels, and climate across Rocky Mountain forests." BioScience 54(7): 661-676.
Thomalla, F., T. Downing, E. Spanger-Siegfried, G. Han, J. Rockström (2006). "Reducing hazard vulnerability: towards a common approach between disaster risk reduction and climate adaptation." Disasters 30(1): 39-48.
US Census Bureau (2006). "Domestic Net Migration in the United States: 2000 to 2004."Retrived September 7, 2010 from http://www.census.gov/prod/2006pubs/p25-1135.pdf
US Census Bureau (2010). "Coastline Population Trends in the United States: 1960 to 2008." Retrieved September 7, 2010, from
http://www.census.gov/prod/2010pubs/p25-1139.pdf.
Van Aalst, M. (2006). "The impacts of climate change on the risk of natural disasters." Disasters 30(1): 5-18.
van de Lindt, J., A. Graettinger, R. Gupta, T. Skaggs, S. Pryor, K. Fridley (2007). "Performance of Wood-Frame Structures during Hurricane Katrina." Journal of Performance of Constructed Facilities 21: 108.
Webster, P., G. Holland, J. Curry, H. Chang (2005). "Changes in tropical cyclone number, duration, and intensity in a warming environment." Science 309(5742): 1844.
CHAPTER 2
PERCEPTIONS ON THE NATURAL DISASTER RESILIENCE OF HOMES IN THE SOUTHEASTERN UNITED STATES
Abstract
Introduction
The economic recovery from the effects of a natural disaster is a long and time-consuming process that affects both the impacted community and the national economy. For example, after Hurricane Hugo, insurance claims were approximately 60,000 and reached $2.6 million dollars in damages (Huang et al. 2001). Another study showed that, following Hurricane Katrina, the unemployment rate for New Orleans was 20% and the average wage loss was around $2.9 billion dollars (Dolfman et al. 2007). Similarly, the national economy suffered from this catastrophe by increased gas prices due to the temporary shutdown of crude oil and natural gas production in the Gulf of Mexico (Townsend 2006). Countless additional examples exist on the negative economic effects of natural disasters on the southeastern United States (US), especially those caused by hurricanes Li and Ellingwood (2006) and Townsend (2006). Although, earthquakes are not prevalent in the Southeastern United States, it is worth to mention that they can result in severe damage as well. The historic earthquake in Charleston, SC in 1886 damaged most of the buildings and resulted in approximately $5-6 million property damage (Stover et al. 1993).
home is the building envelope, such as the roof, windows, and doors (Li and Ellingwood 2006) and unfortunately, once the building envelope is ruined, water and wind effects cause more severe damage inside the home (van de Lindt et al. 2007; Reinhold 2008).
Unfortunately, people living in high risk areas along the southeastern US are not aware of the potential danger that they and their homes face from natural disasters (Kunreuther 1976). This thinking that “it cannot happen to me” is still present today. For example, a Mason-Dixon Poll in 2009 showed that coastal residents did not think that they were vulnerable to hurricanes/tropical storms and approximately 80% of the respondents did not use any mitigation techniques to make their homes more disaster resilient (Mendez 2009). This result is in contrast to the fact that visible mitigation techniques (e.g., storm shutters) applied to homes increase their selling price by 5%.
Methodology and Survey Design
As part of a gap analysis to collect information about research and education needs related to resilient housing, a survey was developed by using a convenience sampling design. The 17-question survey consisted of ranking type questions and open ended questions to provide opportunity for respondents to express their opinions and needs on disaster resilience. The questions were designed to gather general information on the respondents, discover the primary sources for their information, and their disaster experience. In addition, the survey included specific questions, such as the survivability of residential construction elements in different natural disaster scenarios including, hurricanes, floods and earthquakes.
Results and Discussion
Demographics
A total of 385 responses were collected; however, only 367 surveys were useable due to missing values. Hence, some respondents skipped questions or just did not want to answer. The population of interest was from the southeastern US, primarily Alabama (AL), Florida (FL), North Carolina (NC), South Carolina (SC), Georgia (GA), Virginia (VA), Kentucky (KY), Mississippi (MS), and Tennessee (TN). Overall, 89% of the responses were from these states with the highest response rates coming from NC, FL, and AL (Figure 16). The sample from the target audience included builders, homeowners, extension agents, architects, engineers, government officials, manufacturers, and other housing-related professionals.
More than 90% of the respondents were homeowners (Figure 17), and the majority experienced natural disasters (Figure 18). For example, more than 65% of the respondents experienced hurricane and approximately 25% experienced flood (Figure 19).
Figure 17. Homeownership of survey respondents
Figure 18. Natural disaster experience of respondents
Those who experienced natural disaster were asked to indicate whether they had minimal, moderate, or extensive damage (Figure 20). From among those who experienced hurricanes, the reported damage was minimal (Figure 21). On the other hand, those who experienced floods reported their damage was moderate (Figure 22).
Figure 20. Reported damage after natural disasters
Figure 22. Reported damage after flood event
Sources of Information
Following a natural disaster, the majority of the respondents indicated that they turned to government officials, media (e.g., television, radio and newspapers), insurance agent, and builders to look for information concerning recovery and rebuilding (Figure 23).
Regardless of the primary source of information concerning recovery and rebuilding, however, most respondents were satisfied with the received information (Figure 24).
Figure 24. Satisfaction with the received information after a natural disaster
Needs of Homeowners
The majority of respondents (56%) felt that new building materials or construction practices should be developed to make homes more resilient to natural disasters while a significant portion of them (90%) indicated that homeowners need to be better educated about natural disaster resilience of homes. A study conducted in 2006 supports this latter result by stating that people need to be better educated about the risk that is associated with the location of their homes (Hauser et al. 2006).
through hurricanes whereas in reality the most interior part of the home is the safest place (The National Hurricane Survival Initiative 2010).
Perceptions of Housing Survivability
The respondents to our survey were asked to rank various housing elements with regards to their survivability to different natural disasters, i.e., hurricanes, floods, and earthquakes. The results of the survey with regards to this question are shown in Table 5. Based on the responses, the following three major conclusions can be drawn:
There is a clear perception that different portions of the house will survive to
lesser and/or greater extents for different disaster scenarios.
In hurricanes, the roof system seems to be the most vulnerable part.
Table 5. Summary of responses to the residential construction survivability question “Which of the following items in residential construction have the most problems surviving natural disasters? (Check all that apply!)” by natural disaster types.
Hurricanes % of
responses Floods
% of
responses Earthquakes
% of responses
Least
survivable Roof 99.3 Insulation 86.1 Foundation 76.1
Construction
Practices 91.4
Electrical
System 83.5 Plumbing 70.8
Framing
Practices 88.5 HVAC 82.0
Framing
Practices 66.3
Materials for Wall Construction 83.9 Materials for Wall Construction
74.2 Construction
Practices 63.8
Insulation 66.9 Construction
Practices 62.6
Materials for Wall Construction
56.3
Electrical
System 61.6 Foundation 56.4
Electrical
System 39.7
HVAC 59 Plumbing 49.4 HVAC 32.6
Plumbing 43.3 Framing
Practices 44.4 Roofing 25.6
Most
survivable Foundation 25.4 Roofing 17.8 Insulation 11.7
Note: Margin of Error: 6.4%
for flood event does not correlate with the literature. For example after a flooding caused by Hurricane Ike, the majority of homes‟ suffered foundation and floor damages (FEMA 2009).
Similarly to other findings, the respondents of our survey identified roof and foundation as the most vulnerable part of the home during hurricanes and earthquakes, respectively (NAHB 1994; Sparks et al. 1994). With regard to flood events, the result of this survey identified the insulation to be perceived as the most vulnerable component of the house; whereas, (FEMA 2009) reported that the foundation and flooring systems are the most vulnerable parts of homes during flood events. Therefore, developing better education and outreach materials are needed with regard to the vulnerable parts of homes during flood events.
Factors in Disaster Preparedness and Recovery
preparedness and disaster recovery. To measure the strength of these relationships the Spearman‟s correlation was used. The Spearman‟s correlation is more appropriate to use if the correlation between two ordinal data (ranked data) is considered (Weisberg et al. 1996b). All comparisons showed moderately strong relationship. The strongest relationship was found for sustainability (ρ=0.74), meaning that those who ranked sustainability important before the natural disaster also ranked sustainability as an important attribute after the natural disaster. The weakest relationship was found for cost (ρ=0.23) and speed of installation (ρ=0.24).
Table 6. Chi-square and Spearman‟s correlation summary table of different attributes before and after natural disaster events
Comparison
(before-after) Chi-Square
P-value Spearman
Correlation (Sample ρ)
Population Confidence Interval
Cost 33.80 0.0001 0.2304 0.0935 – 0.3673
Speed of Installation
17.05 0.0003 0.2470 0.1231 – 0.3709
Simplicity of Installation
52.5247 <0.0001 0.4074 0.2794 – 0.5354
Sustainability 223.3469 <0.0001 0.7380 0.6729 – 0.8031
Energy Efficiency 140.9155 <0.0001 0.5639 0.4734 – 0.6545
Do it yourself 146.5924 <0.0001 0.5957 0.4957 – 0.6957
any relationship for these attributes, before and after a disaster, between the disaster experienced and not experienced groups. As a result of the test, none of the comparisons were significant at the 0.05 significant level meaning that, in spite, of their disaster experience, the two groups ranked the attributes similarly.
A significant portion of our respondents wanted to see more education for homeowners on the natural disaster resilience of homes. Therefore, the relationship between disaster experience and the need for homeowner education was analyzed. The p-value (0.2118) of the chi-square test showed no association between the two groups. Regardless of disaster experience, the need for a better education was equally important for both groups. In addition, most of the respondents wanted to see the development of new construction technologies. Chi-square statistics was used to test the need for new construction technologies between disaster experienced and not experienced groups. The p-value (0.07) obtained by the test showing marginally significant relationship between the two variables suggesting that for people who experienced natural disaster, it is more important to develop new construction technologies in order to be better prepare to and recover from a natural disaster.
Summary and Conclusions
This research was conducted to explore the opinion of homeowners, builders, and other stakeholders concerning various aspects of housing and natural disaster resilience. Results show that the majority of the respondents think that homeowners need to be better educated regardless of their disaster experience about the preparedness and resilience of homes. Therefore more targeted educational materials should be developed and distributed by different agencies such as state and federal government, builder associations, local communities, and electronic media.
In general, respondents expect the development of new construction practices and materials to improve natural disaster resilience of homes. Those who experienced disasters are more interested in developing new construction practices as indicated by the marginal relationship between the need for new technologies and the disaster experience. Those who received information after a natural disaster from governmental agencies were satisfied with the received information. Therefore, information and educational material about the already available or newly developed sustainable and cost effective technologies should be distributed by these agencies. In addition, more effective sources of information and distribution channels for preventative or recovery techniques should be further explored.
general knowledge and perception of different demographic groups on disaster resilient housing and thus develop specific educational materials that target their needs.
Acknowledgements
REFERENCES
Dolfman, M., S. Wasser, B. Bergman (2007). "Effects of Hurricane Katrina on the New Orleans Economy." Monthly Lab. Rev. 130: 3.
FEMA (2009). "Hurricane Ike in Texas and Louisiana: Mitigation Assessment Team Report, Building Performance Observations, Recommendations, and Technical Guidance." Retrieved October 12, 2010, from
http://www.fema.gov/library/viewRecord.do?id=3577.
Hauser, E., S.M. Elmes, J.N. Swartz (2006). Risk, Preparation, Evacuation and rescue. Natural Disaster Analysis after Hurricane Katrina: Risk Assessment, Economic Impacts and Social Implications. P. G. Harry W. Richardson, James E. Moore II.
Huang, Z., D. Rosowsky, P. Sparks (2001). "Long-term hurricane risk assessment and expected damage to residential structures." Reliability Engineering & System Safety 74(3): 239-249.
Kovacs, P. (2005). "Homeowners and Natural Hazards." Retrieved October 18, 2010, from http://www.canadianunderwriter.ca/issues/story.aspx?aid=1000193356. Kunreuther, H. (1976). "Limited Knowledge and Insurance Protection." Public Policy 24(227): 61.
Li, Y., B. Ellingwood (2006). "Hurricane damage to residential construction in the US: Importance of uncertainty modeling in risk assessment." Engineering Structures 28(7): 1009-1018.
Mendez, I. (2009). "Mason-Dixon Poll Reveals Residents of Coastal States Grossly Unprepared for 2009 Hurricane Season." Retrieved September 2, 2010, from http://www.hurricanesafety.org/media09/HurricaneNewsConferenceRelease-2.pdf. NAHB (1994). "Assessment of Damage to Residential Buildings Caused by the Northridge Earthquake." Retrieved October 12, 2010, from
http://www.huduser.org/publications/pdf/earthqk.pdf.
Reinhold, T. (2008). "The Case for Strong Well-enforced Building Codes and for Strengthening/Retrofitting/Mitigating Existing Buildings." Retrieved September 9, 2010,
SAS Institute (2006). SAS Enterprise Guide. Cary, NC.
Sparks, P., S. Schiff, T. Reinhold (1994). "Wind damage to envelopes of houses and consequent insurance losses." Journal of Wind Engineering and Industrial Aerodynamics 53(1-2): 145-155.
Stover, C., J. Coffman, R. Scott (1993). "Seismicity of the United States, 1568-1989." US Geological Survey professional paper (USA).United States Government Printing Office. Washington D.C. USA.
The National Hurricane Survival Initiative (2010). "New Poll Shows Coastal Residents Compacent afte a Quite 2009 Hurricane Season." Retrieved October 18, 2010, from http://www.hurricanesafety.org/newpoll2010.shtml.
Townsend, F. (2006). "The federal response to Hurricane Katrina: Lessons learned." Washington, DC: The White House.
US Census Bureau (2010). "Coastline Population Trends in the United States: 1960 to 2008." Retrieved September 7, 2010, from
http://www.census.gov/prod/2010pubs/p25-1139.pdf.
van de Lindt, J., A. Graettinger, R. Gupta, T. Skaggs, S. Pryor, K. Fridley (2007). "Performance of Wood-Frame Structures during Hurricane Katrina." Journal of Performance of Constructed Facilities 21: 108.
Weisberg, H.F., J.A. Krosnick, B.D. Bowen (1996a). An introduction to survey research, polling, and data analysis. SAGE Publications, Inc. United States of America.71-72.
CHAPTER 3
A PERFORMANCE-BASED RATING SYSTEM FOR HOME RESILIENCE: THE RESCU CONCEPT
Abstract
guidance on how to protect/reinforce their homes against natural disasters. Unlike these other programs, the ReScU system proposed in this paper is location specific, performance-driven, and can be readily tied to incentives. These features will assist homeowners, homebuilders, and others in designing, building, and maintaining more natural disaster resilient homes.
Introduction
"Our goal is to ensure a more resilient Nation - one in which individuals, communities, and our economy can adapt to changing conditions as well as withstand and rapidly recover from disruption due to emergencies."
President Barack Obama (The White House 2009)
People and communities in the southeastern United States (U.S.) are being affected by coastal disasters with increasing frequency. This increase is a result of higher migration from in-land areas to coastal regions as well as a lack of preparedness for natural disasters (Gaddis et al. 2007). Regardless of the reason, natural disasters are having a greater impact on, and leading to more serious consequences for, local and national communities and economies.
Based on data from the U.S. Census Bureau (2010), the number of residential housing units on coastlines (Atlantic, Gulf of Mexico and Pacific) increased from 16.1 million to 36.3 million between 1960 and 2008. Similarly, the coastal population rose in numbers from 47 million to 87 million from 1960 to 2009. Thus, more than 30% of the U.S population lives in coastal counties, where hurricanes and tropical storms are a growing concern (Crowell et al. 2007).
(storms and flood) reveals that approximately 80% of insured residential and commercial properties are at high risk areas in the coastal region of Florida. This amount represents around $ 2.5 billion insured residential and commercial value.
The damage caused by various natural disasters to residential housing is still a concern. For example, Hurricane Hugo (1989) caused major damage to approximately 36,000 housing units, the Oakland Hills firestorm (1991) damaged more than 3,000 housing units, Hurricane Andrew (1992) damaged about 80,000 homes, the Northridge earthquake (1994) caused serious structural damage to about 60,000 houses, and Hurricane Katrina (2005) destroyed approximately 90% of the residential and commercial buildings in the Biloxi-Gulfport area (Comerio 1997; Edwards and Iskowitz 2010).
The type of materials used and other building features, such as roof shape, roof age, protection of openings, wall construction, and enforcement of garage doors affect the wind resistance of homes significantly (Reinhold et al. 2005). These findings are supported by insurance data that shows that homes built according to newer building codes (with improved design and construction) were subjected to fewer claims and disbursements than those built to older codes (Reinhold 2008; Edwards and Iskowitz 2010).
Methodology
The development process for the ReScU rating system started with a review of existing building programs to analyze their structures, benefits, disadvantages and possible applications to a disaster resilient rating system. Following this, a stakeholder expert group was assembled to get insights and continuous feedback on the developing rating system.
Review of Existing Building Programs
There are few building programs that focus on disaster resilience of homes. Two examples include the Federal Alliance of Safe Homes (FLASH) program and the Fortified Home program from the Institute of Business and Home Safety (IBHS). Both of these programs provide guides, focusing on prescriptive techniques, and information about preventative techniques to reinforce homes against natural disasters. However it should be noted that none of these programs show possible financial and other incentives of building more disaster resilient construction.
Home Builders (NAHB) Green Home, Earthcraft by Greater Atlanta Home Builders Association & Southface, and North Carolina Healthy Built Home.
As a major advantage, most green building certification programs have incentives associated with them to encourage their adoption. For example, upgrading to energy efficient heating and/or cooling system can result in a 30% tax break for the homeowner, and builders are eligible for a $2,000 federal tax credit if the home uses 50% less energy than a home built according to code (North Carolina Solar Center 2010)
.
However, a major disadvantage of these sustainable programs is that each of them use a different method to rate homes (Kaufmann and Melia-Teevan 2008). Some of them rate the entire home while others just rate specific features of the home, such as indoor air quality. Unfortunately, such variability in rating systems leads to confusion among homebuyers and homeowners since “green” homes cannot be compared to each other unless the homes are rated by the same program (Kaufmann and Melia-Teevan 2008).
One inconsistency with green building programs is that some of them take into account the location of the home and some of them do not. For example, Earthcraft had developed different checklists for homes based on climate zones (Earthcraft 2010). On the other hand, NAHB Green Home is not specific about location; it only has requirements for site selection and design (NAHB 2006).
“non-favored” alternatives, even if their result would have been the same as the ones currently favored by the prescriptive criteria (Bowyer 2007). “ The creation of rating systems based on prescriptive criteria has resulted in designers chasing building points”, other than focusing on the real environmental impact of the home (Bohnhoff 2010).
Based on the above review of the literature, this project seeks to design a resilience scoring utility for rating homes that could be:
1. Easily connected to incentives
2. Flexible and “universal” with respect to house type, peril, and location, and 3. Performance-based.
Stakeholder meetings
of the rating system. Meetings with the stakeholder groups were held either in-person (face-to-face) or through webinars each quarter of the year or when a major change was made in the rating system.
Result and Discussion
Hazard Perils in the ReScU Framework
The ReScU rating system includes various hazards that a home may have to withstand based on its location. Simply, homes in different geographical locations may be vulnerable to different types of hazards. For example, homes may be subjected to more hurricanes in the coastal regions vs. in the west where they are more vulnerable to earthquakes. ReScU uses the location of a home to determine the possible natural disasters for which the home must be reinforced. The knowledge of possible disasters that might affect a home at a particular location is advantageous because it could allow for better and more efficient reinforcement technologies to be targeted towards that natural hazard. Existing information, such as insurance and weather models, FEMA floodplain maps, etc., could be used to determine the vulnerability of homes to different natural hazards at various locations. Hazards currently targeted by the ReScU system include:
Wind (including hurricane-related wind), Rising Water,
Storm Surge, Wind-Driven Rain, Earthquake, Fire,
Wildfire, Hail, and
These hazards were defined based on the insurance industry standards, although flood peril needed to be modified in order to better target water related perils. Due to the complexity of water peril, it is broken down into three separate perils, such as rising water, storm surge and wind-driven rain. These three perils can contribute to flood events in different way, therefore require different reinforcement technologies in order to make homes more resilient against water invasion into the residential structure.
Performance-Based Inventory and the “Building Score”
Unlike existing green rating systems, ReScU uses performance requirements to rate homes for their resilience towards each of the natural disasters. In other words, ReScU will require certain functional goals be met for the performance of homes against natural hazards. A performance-based inventory was developed for each of the hazards to make it easier to specifically define the performance criteria for different parts of the house and to provide a basis for scoring the homes based on their resilience features. A Performance-based rating system was preferred over a prescriptive-based system because the performance-based criteria do not require specific prescriptive tools and will accept any proven prescriptive method as long as the applied tools contribute to achieving the required performance level.
inventories also contain best practice (prescriptive) recommendations that may be used to achieve the particular performance requirement. An example of a performance-based criterion within the wind peril inventory for the roof element is “appropriate reinforcement techniques utilized to enable the roof to withstand up to 150 mph wind speeds”. The corresponding best practice recommendations include “the use of hurricane straps”. Points or scores will be earned by a home for each of the performance criteria.
The total number of points a home receives by following recommendations outlined in the performance-based inventories is referred to as its Building Score, and a home will receive a perfect Building Score (tentatively 500 pts) for a particular hazard risk if it meets all the required performance based criteria. An example shown in Figure 25 demonstrates the Building Scores obtained for each of the hazard perils.
The green bar for each hazard represents the maximum obtainable Building Score – irrespective of its geographic location – assuming that the home is constructed using all best practices as specified in the performance-based inventory. The purple bars represent the actual rating for that home for each hazards based on the manner in which the home is actually constructed.
Hazard Thresholds
One of the main goals of developing ReScU was to formulate a home rating system that could be easily adapted for natural hazards regardless of the geographic location of the home. As such, the home is scored separately for its resilience against each hazard. By setting up different threshold values for the hazards for particular locations, the necessary resilience can be accomplished more efficiently. For example, homes do not have to be reinforced against the same natural disasters if they are located in the coastal regions or when they are located in the mountains and the ReScU score reflects this fact.
is located in the Midwestern United States (US), then the probability of that home being impacted by a hurricane will be lower relative to that same home located along the east coast. Thus, the overall wind hazard threshold will be lower for that home. These thresholds are determined from historical data, weather/hazard models, and insurance companies‟ risk analysis models that determine the probability of risk of particular hazard affecting a specific location (last 30-year risk data will be used).
The ReScU Score
A graphical representation of the ReScU rating system is shown in Figure 26.
Figure 26. An example ReScU system chart
It should be noted that the results from the ReScU rating system may be interpreted differently by different users, i.e., insurance industry, communities, builders, etc, based on their needs and requirement from the system. Moreover, the ReScU rating system will also allow communities to apply the ratings according to their specific location, requirements, and needs.
An example of a ReScU rating spreadsheet that was used to generate similar bar graph than in Figure 25 is shown in Table 7. In the first column the potential hazards are listed that a home is exposed to, based on the location of the home. In the second column the actual points (Building Scores) are shown that the home has received for each of the hazard perils. These points are awarded based on its performance as specified in the performance-based inventories. The third column shows the threshold value for each of the hazards. These Hazard Thresholds are governed by the location of the home as explained earlier. For example, if the house is located in a wind zone or in a hurricane prone area, these values (i.e., numbers) are higher than if it is not located in those areas. The fourth column shows the ReScU score. The ReScU Score is obtained by subtracting the Building Score from the Hazard Threshold value. For example if the Building Score for wind is 375 points and the Hazard Threshold is 200 points:
Table 7. The ReScU spreadsheet
Applying the ReScU System: Varying Locations
ponds and stone walls are used. Trees, bushes and other foliage are planted a safe distance from the home.
Table 8 shows a partially completed ReScU spreadsheet with entries for the example house. This home is placed in several locations and the ReScU scores calculated.
Table 8. General ReScU spreadsheet for the example house