ABSTRACT
ELLINGTON, JAMES KEMP. Exploring the Dimensionality of Performance in the Army Special Forces. (Under the direction of J.W. Cunningham.)
The purpose of this research was to explore the dimensionality of performance in the Army Special Forces (SF) using three separate data sources. A job analysis of the SF revealed 15 categories of performance common to all SF soldiers, in addition to 47 human attributes necessary to perform the behaviors associated with each category. A sample of SF soldiers was rated on their performance of the 15 categories using
behaviorally anchored rating scales (BARS). Furthermore, a panel of subject matter experts (SME) rated each performance dimension on its requirement for each of the human attributes. These two data sources served in the development of two sets of performance dimensions, based on respective factor and cluster analyses of the data. A third data source included job analyst sorting data of the 15 performance categories into predefined numbers of groups. This data was also cluster analyzed to produce a third set of performance dimensions. Research questions focused predominantly on the number of performance dimensions that would be derived from the three data sources and their interpretability, and the extent to which agreement would exist between the three sources. Agreement was determined based on an index of cluster overlap for comparing two cluster solutions. Three dimensions were chosen as most interpretable from the
EXPLORING THE DIMENSIONALITY OF PERFORMANCE IN THE ARMY SPECIAL FORCES
By
JAMES KEMP ELLINGTON
A thesis submitted to the Graduate Faculty of North Carolina State University
in partial fulfillment of the requirements for the Degree of
Master of Science
DEPARTMENT OF PSYCHOLOGY
Raleigh 2002
APPROVED BY:
BIOGRAPHY
J. Kemp Ellington was born on August 15, 1975 in Greensboro, North Carolina. He graduated from Page High School, and went on to college at both Caldwell
ACKNOWLEDGEMENTS
I would like to acknowledge the following people who have contributed to the completion of this project. First and foremost I would like to thank my parents, James and Elizabeth Ellington. They have provided critical emotional and financial support over the years, and have tolerated a great deal. Thanks for bearing with me and listening when I went on and on about some so-called “tragedy” associated with school. I am extremely fortunate to have such a great family.
I would also like to thank my advisor, Dr. Bill Cunningham for all of his support and advice. Thanks for all your help with my analyses and other various portions of my manuscript. Also, thanks for being such an understanding person.
TABLE OF CONTENTS
List of Tables………...…..…vii
List of Figures……….ix
Introduction………..1
Two-Factor Model of Performance……….2
Eight-Factor Model of Performance……….………...………4
Three-Factor Model of Performance…………...………5
SF Performance Dimensionality………..7
SF Attribute Requirements………...………...8
Job Analyst Agreement……….…..……….……..10
Research Questions………...………….……10
Method………...………12
Participants………...….12
Materials………...……….12
Procedure………...………13
Principal Components and Exploratory Factor Analyses……...….……..14
Factor Structure Stability………...………14
Job Analyst Reliability………...………16
Cluster Analyses………...……….16
Results………...…….17
Principal Components and Exploratory Factor Analyses……….…….17
Factor Structure Stability………...18
Job Analyst Reliability………...19
Cluster Analyses………20
Index of Cluster Overlap………20
Discussion………...………...21
References………...………...28
Appendices……….53
Appendix A. SF Performance Category Q-sort Instrument………..54
Appendix B. Performance Ratings (Whole Sample): Correlation Matrix, Principal Components Eigenvalue Table, Principal Factors Eigenvalue Table, and Two, Three, and Four –Factor Rotated Factor Patterns………...…….60
Appendix C. Attribute Requirement Ratings: Correlation Matrix, Principal Components Eigenvalue Table, Principal Factors Eigenvalue Table, and Two, Three, and Four-Factor Rotated Factor Patterns………...………...70
Appendix E. Performance Ratings Sub-Sample Two (Even): Correlation Matrix, Eigenvalue Table, and Two, Three, and
Four-Factor Rotated Factor Patterns………...……...89 Appendix F. Job Analyst Four-Group Sorting Data: Correlation
Matrix of the 17 Analysts………...………...98 Appendix G. Performance Ratings: Two, Three, and Four-
Cluster Solutions………..…104
Appendix H. Attribute Requirement Ratings: Two, Three, and
Four-Cluster Solutions……….113
Appendix I. Job Analyst Three-Group Sorting Data: Two, Three,
and Four-Cluster Solutions………..122
Appendix J. Job Analyst Four-Group Sorting Data: Two, Three,
LIST OF TABLES
Table 1. Special Forces Job Performances Categories……….31 Table 2. Human Attributes Required in the SF………...….32 Table 3. Descriptive Statistics for the Performance Ratings of SF Soldiers………34 Table 4. SME Mean Attribute Requirement Ratings for the 15
Performance Categories……….35
Table 5. SF Performance Rating Factor Analysis (Three-Factor
Orthogonal Rotation): Factor Title, Salient Performance Categories, R-Square with Own Cluster, % Variance Explained, and
Congruence Coefficient……….36
Table 6. SF Attribute Requirement Rating Factor Analysis (Four-Factor Orthogonal Rotation): Factor Title, Salient Performance Categories,
R-Square with Own Cluster, and % Variance Explained………..…37 Table 7. Congruence Coefficients for Orthogonal Rotations of Two, Three,
and Four Factors………....38 Table 8. Congruence Coefficient for Oblique Rotations of Two, Three,
and Four Factors………39
Table 9. Three-Cluster Solution Generated from SF Performance Ratings………….…40 Table 10. Four-Cluster Solution Generated from Attribute
Table 11. Three-Cluster Solution Generated from the Three-Group Analyst
Sorting Data………...42
Table 12. Four-Cluster Solution Generated from the Three-Group Analyst
Sorting Data………...43
Table 13. Three-Cluster Solution Generated from the Four-Group Analyst
Sorting Data………...44
Table 14. Four-Cluster Solution Generated from the Four-Group Analyst
Sorting Data………...45
Table 15. Cluster Overlap Indices Between Performance Ratings and
Three and Four-Group Analyst Sorting Data………...…………..46 Table 16. Cluster Overlap Indices Between Attribute Requirement Ratings
and Three and Four-Group Analyst Sorting Data………..47 Table 17. Cluster Overlap Indices Between Performance Ratings and
LIST OF FIGURES
Exploring the Dimensionality of Performance in the Army Special Forces Researchers and practitioners are continually attempting to accurately define and measure job performance in organizational settings. From a human resource standpoint, the ability to do so is extremely valuable in that it can allow for better assessment of selection devices, training programs, and interventions. However, accurately defining job performance, particularly the underlying structure, is not as straightforward as one might assume. Performance is regarded by many researchers as being multidimensional and complex (Austin & Villanova, 1992; Campbell, 1992). Identifying these multiple underlying dimensions is critical in that it is a key step prior to developing appropriate criterion measures. Furthermore, isolating the underlying facets of performance can allow practitioners to develop performance appraisal instruments that pose less of a response burden on the rater without sacrificing the validity of the instrument.
1994). Cluster analysis also examines the correlations between variables, comparing the patterns or profiles of correlations with other variables (Guion, 1998).
The purpose of the present study was to explore the dimensionality of
performance within the Army Special Forces (SF) by analyzing three separate data sets: actual performance ratings of SF soldiers (Diana, Kilcullen, & Goodwin, 1997), attribute requirement ratings obtained from a recent job analysis (Russell, Crafts, Tagliareni, McCloy, & Barkley, 1996), and job analyst sorting data of SF job performance categories. Each of these data sets was analyzed separately, with subsequent
comparisons being made to determine agreement. The following review will first draw attention to previously developed models of performance dimensionality, in addition to a previous analysis of the sample under study. Secondly, the rationale for using attribute requirement ratings for identifying performance dimensions will be discussed. Finally, the use of job analyst sorting data will be proposed as an additional source for
determining performance dimensions. Two-Factor Model of Performance
are carried out, and the source of variation in contextual activities is volition and
predisposition; and (4) task activities are role-prescribed and contextual activities are not (Borman & Motowidlo, 1993, p. 73-74). Although there are distinct differences,
contextual performance (as defined) is similar to what other researchers have called extrarole behavior (Werner, 1994), organizational citizenship behavior (Organ, 1988), and motivation (Campbell, 1992). Contextual behavior would include such behaviors as volunteering, exercising extra effort, and helping.
Motowidlo and Van Scotter (1994) provided empirical support for this two-factor (task and contextual) conception of performance. In their study, a sample of supervisors rated Air Force mechanics on task, contextual, and overall performance. Task
performance was operationalized as ratings of effectiveness on tasks such as inspecting, testing, and detecting problems with equipment. Contextual performance was measured using a 16-item scale developed to identify the likelihood of an individual performing behaviors such as complying with instructions and cooperating with others. Overall performance was measured using three scales of high, moderate, and low overall
performance. Results supported a task/contextual performance distinction, in that ratings on each dimension independently contributed to ratings of overall performance.
overall performance. Werner (1994) recorded the influence of both types of information on overall performance ratings, in addition to the order in which the information was searched. Results indicated that although supervisors used inrole information first when assessing performance, both inrole and extrarole behaviors were significantly related to overall performance ratings. Both of the previously described studies provide support for a two-factor model of performance. A graphical display of the two-factor model is depicted in Figure 1.
Eight-Factor Model of Performance
Campbell (1992) provided an additional model of performance with his taxonomy of major job performance components. His eight-factor model includes: job-specific task proficiency, non job-specific task proficiency, written and oral communication tasks, demonstrating effort, maintaining personal discipline, facilitating peer and team
performance, supervision, and management/administration. Job-specific task behaviors are considered the performance behaviors that discriminate the content of one job from another. Non job-specific task behaviors are more general in that individuals across several jobs may all be responsible for the same behaviors. Campbell (1992) provided the example of first aid in military settings; everyone is responsible for performing these types of tasks. Written and oral communication includes tasks such as making
others in the organization. Supervision includes behaviors that impact the performance of subordinates. Finally, the management/administration factor is characterized by behaviors such as organizing people and resources and expressing goals.
Campbell (1992) described these eight factors as “the highest order latent variables for every job in the occupational domain” (p. 710). However, it was
acknowledged that not all jobs include all eight of these factors, but that any job could be described by some subset. Campbell (1992) also distinguished between the factors or components of job performance, and the “determinants” of these factors. “Individual differences on a specific performance component are viewed as a function of three, and only three, major determinants – declarative knowledge, procedural knowledge and skill, and motivation” (Campbell, 1992, p. 705). Declarative knowledge refers to an
individual’s understanding of a particular task’s requirements. When this information is combined with the knowledge of “how to” do the task, it is referred to as procedural knowledge and skill. Finally, Campbell (1992) defined motivation as the combined effect of three choice behaviors – “choice to expend effort, choice of level of effort to expend, and choice to persist in the expenditure of that level of effort” (p. 706). Figure 2 provides a graphical depiction of Campbell’s (1992) eight-factor model.
Three-Factor Model of Performance
perceptions of the importance of 19 task groups (i.e., dimensions) identified in a job analysis. Structural covariance analysis was employed to determine how well the various models “fit” the observed data. Analyses indicated that each of the three existing models failed to achieve acceptable fit. However, a revised model derived from an exploratory factor analysis of the data suggested three interpretable factors underlying the officer’s ratings (Grant, 1996).
The factors suggested in the revised model were interpreted and named Do Inrole, Know Inrole, and Extrarole performance. Grant (1996) noted the apparent correspondence of the revised model to other existing models of performance. More specifically, concurrent with studies supporting a task/contextual (i.e., inrole/extrarole) performance model (Borman & Motowidlo, 1993; Motowidlo & Van Scotter, 1994; Werner, 1994), the revised model suggested a distinction between inrole and extrarole performance. However, the revised three-factor model suggested a distinction between two types of inrole performance, knowing the job and doing the job (Grant, 1996). Furthermore, the factors in the revised model corresponded with several of Campbell’s (1992) eight factors. For example, Grant (1996) noted that the “Do Inrole factor may represent Campbell’s (1992) Job Specific factor; the Know Inrole dimension may correspond to the Non-Job Specific factor; the Extrarole factor appears to capture
skill, and motivation). Figure 3 provides a graphical depiction of Grant’s (1996) three-factor model.
SF Performance Dimensionality
Previous research on performance dimensionality has also been conducted within the population of interest for the present study – the Army Special Forces (SF). A previously conducted job analysis of the SF (Russell et al., 1996) identified 26 SF performance categories, 15 of which were common to all SF soldiers. These 15 categories are illustrated in Table 1. For each performance category a behaviorally anchored rating scale (BARS) was developed. Each category was measured on a 7-point scale consisting of behavioral summary statements anchoring different levels of
effectiveness within the category, with one or two critical incidents for each level of effectiveness. The developed scales were then used in the performance ratings of over 300 enlisted SF personnel, with 220 complete data sets resulting (Diana et al., 1997). Cunningham (1999) proposed that the 15 categories of SF performance be condensed to a more manageable number in order to allow more practical application in the field.
Subsequently, Zazanis, Carpenter, and Kilcullen (1999) factor analyzed the SF
performance ratings on the 15 performance categories in order to identify the underlying performance dimensions to be utilized in a reduced effort performance rating form. Analyses revealed two primary dimensions, which were named “Overall Performance” and “Intercultural Skills.” It should be noted that this two-factor solution did not
behaviors loaded on the same factor. The ratings for the categories that loaded on the primary factor (Overall Performance) were then cluster analyzed, revealing five clusters. These clusters were named Reasoning Skills, Facility with Others, General Soldiering, Physical Fitness, and Effort.
Congruent with Cunningham’s (1999) proposal, the study outlined here also subjected these previously collected performance ratings (Diana et al., 1997) to factor and cluster analyses in order to examine the performance dimensionality. The resulting factors were also tested for stability in order to determine if the factor structure was “repeatable.” Given the use of the same data as analyzed by Zazanis et al. (1999), it was expected that a factor solution similar to that previously discovered would be obtained (e.g., two or three factors). However, in military settings, range restriction in
performance ratings has presented a problem (Berkshire & Highland, 1953). Furthermore, in regard to the data under study, Diana et al. (1997, p. 58) reported: “analysis of the performance ratings revealed that there were very few ‘poor’ performers in the SF.” In light of this restriction of range in the ratings of SF performance, it was recommended that alternate sets of data also be analyzed to allow for comparison with the dimensions obtained from the performance ratings.
SF Attribute Requirements
total of 47 attribute definitions subsumed under the following headings: (a) General Attributes, (b) Communication Attributes, (c) Interpersonal Skills, Motivation, and Character, (d) Physical and Psychomotor Abilities, (e) Interests, and (f) Conventional Army experiences. Two of the attributes were not well defined, and hence were excluded from analyses (i.e., Other Combat MOS Technical Proficiency and Other Non-Combat MOS Technical Proficiency). The 45 relevant attributes are presented in Table 2. Using a 6-point importance scale, a group of SMEs and researchers rated each of the 15
performance categories on its requirement for each of the 45 defined attributes. Each performance category can therefore be described in terms of its underlying attribute prerequisites. Furthermore, it could be expected that performance categories with similar underlying attribute requirements, have common behaviors needed for successful
performance.
analyses be conducted on SF attribute requirement ratings, resulting in a second factor structure and cluster solution of SF performance.
Job Analyst Agreement
When defining the structure of job performance, it is important that statistical support be evident for the performance model. However, it is also important that the model also be theoretically sound. In other words, one should not adhere to a statistically derived model that is deemed counterintuitive or irrelevant. If a model is not accepted as relevant by those who will actually be affected by its use, it is of little value. As a means of providing a third data source to analyze and compare against the performance
structures obtained from the performance ratings and attribute requirement ratings, it was proposed that job analysts be utilized to group or assign each of the 15 performance categories into the number of dimensions identified in each of the prior analyses (i.e., performance rating based and attribute requirement rating based). This Q-sort method was proposed to allow for a comparison based on analyst agreement as to what categories should comprise each dimension. Responses were cluster analyzed and the resulting clusters were compared with the clusters obtained from the previous analyses to determine if agreement existed between the various cluster solutions.
Research Questions
performance, consistent results across any of three different data sources would provide at least partial support for a SF model of performance. This primary question was initially addressed through factor and cluster analyses of both job performance ratings (Diana et al., 1997), and attribute requirement ratings (Russell et al., 1994). However, further analyses were conducted on job analyst sorting data of job performance categories in order to provide a third source for comparison. Job analysts sorted the performance categories into predefined numbers of groups, and the data were compiled in a
co-assignment matrix and cluster analyzed. A secondary question of interest focused on the first data source: how stable is the factor structure underlying the sample of performance ratings? This question was addressed by dividing the sample into two comparable samples, and testing the equality of the covariance matrices associated with each sub-sample. In addition, each sub-sample was factor analyzed, and Tucker’s (1951) coefficients of congruence were computed in order to determine if the resulting factors were comparable. The stability of the factor structure underlying the attribute
Method Participants
Three sources of data were analyzed in conducting this research. Participants associated with the first data source included 220 active duty enlisted SF soldiers, from 5 different SF Groups. Ratings of performance were previously collected for each
individual, typically by their team’s First Sergeant (enlisted soldier) and in some cases by their superiors-once-removed (officers) (Diana et al., 1997). Participants associated with the second data source included a panel of 14 SMEs (NCOs, officers, and researchers) previously asked to rate each of the 15 performance categories on its requirement for each of 47 defined attributes (Russell et al., 1994). Participants associated with the third data source included 17 industrial/organizational psychology graduate students and graduates who served as job analysts in order to complete the Q-sort procedure. Fourteen of the analysts held at least a master’s degree, and three held a doctorate degree in I/O psychology.
Materials
A questionnaire was developed in order to conduct the Q-sort procedure (see Appendix A). Each questionnaire included the list of titles and descriptions of the original 15 performance categories; the dimension memberships of these categories were not indicated. Spaces were provided for participants to sort performance categories into a specified number of groups based on commonalities between the categories.
Commonality was defined as (a) related in terms of responsibilities or mission objectives; (b) carried out jointly for a common purpose; and/or (c) requiring common knowledge, skills, or personal traits. Each participant sorted the categories into the number of groups identified in the structures derived from the performance ratings and the attribute
requirement ratings. Two versions of the questionnaire were administered in order to counterbalance the order of sorting into the different numbers of groups (i.e., either sorting into three groups first, or four groups first). Participants also sorted the categories into two groups, however this data was not analyzed and therefore will not be discussed further.
Procedure
Data were previously collected on performance ratings using the before mentioned BARS. Each SF soldier was evaluated and assigned a rating by their
Data were also collected from a panel of job analysts using the before mentioned Q-sort questionnaire. Participants completed one of two versions of the questionnaire, sorting each performance category into predefined numbers of groups. A 15 x 15 co-assignment matrix was compiled containing cell entries indicating the number of analysts assigning designated pairs of categories to common groups. The cell frequencies were then divided by the number of analysts, converting them to proportions. The proportions were standardized using Fisher’s z transformation.
Principal Components and Exploratory Factor Analyses. A principal components analysis was first conducted in order to examine eigenvalue patterns and determine the number of factors to subsequently rotate. Exploratory factor analyses were conducted on the sample (220 SF soldiers) of performance ratings (Diana et al., 1997). Orthogonal rotations were performed, with squared multiple correlations as prior communality estimates. This resulted in a set of performance dimensions based on the performance ratings of SF soldiers. The 15 performance categories were also intercorrelated based on their mean ratings on 45 defined attributes required for performance in the SF (Russell et al., 1996). This correlation matrix was subjected to the same principal components and factor analytic procedures described previously, resulting in a second set of performance dimensions based on the attribute requirement ratings. These factor solutions were also compared with subsequently generated cluster solutions in order to help clarify and interpret the dimensions.
of 220 was first randomly divided into two equal sub-samples. Each participant (row in the data set) was assigned a random number between 0 and 1 using the random number function (ranuni) in SAS version 8.01 (SAS Institute, 1999). Participants were then sorted (ascending) based on this random number. Finally, the sorted data were then divided into two equal sub-samples (n = 110) by alternating assignment to the two groups, assigning every other (even/odd) participant to a different group.
The factor structure stability was first tested by examining the equality of the covariance matrices associated with each sub-sample. The test was conducted using Proc IML, a matrix language program included in the SAS system version 8.01 (SAS Institute, 1999). The program allows the computation of covariance matrices from raw data sets, in addition to the actual testing of these matrices. In order to test the equality of two covariance matrices, a value for the chi-square (χ2) statistic is computed, in addition to the appropriate degrees of freedom (df) and significance value. Although this test did not directly compare the factors from each sub-sample, the equality of the covariance
matrices would imply a similar structure.
sub-sample, different numbers of factors were rotated to determine if factor stability was higher when comparing different factor solutions.
Job Analyst Reliability. The analyst performance category sorting data were also analyzed to determine the level of interrater agreement between the analysts. An
additional data matrix was compiled (based on the four-group analyst sorting data), consisting of the 17 analysts as columns, and the 105 paired comparisons between performance categories as rows. If a given analyst placed two categories in the same group, a “1” was inserted as the cell entry, if the two categories were not placed in the same group a “0” was inserted. This data matrix was analyzed and the coefficient alpha was computed as an estimate of analyst reliability (Cronbach, 1951). Though this
method makes the assumption that all raters are equal (which is not likely), it will at least provide an estimate as to how consistent the analysts were is grouping the performance categories.
were found to be virtually identical to the clusters generated using the VARCLUS procedure, the latter method was chosen so that the clustering method would be constant across data sources.
Index of Cluster Overlap. In order to determine the extent to which agreement existed between the various cluster solutions generated from the three data sources, a cluster overlap index was computed across clusters from each source,
PO = k/n
where PO = proportion of overlap, k = number of common members between the two clusters, and n = total number of unique members in the two clusters combined (i.e., number of common members + number of non-common members).
Results
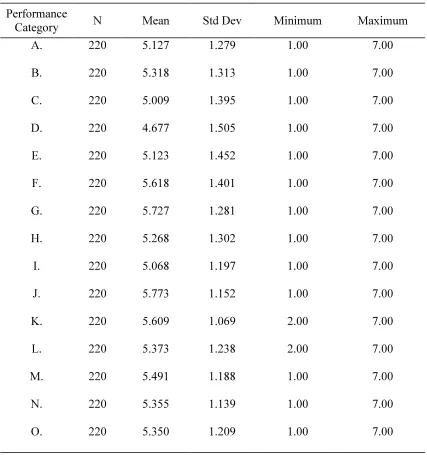
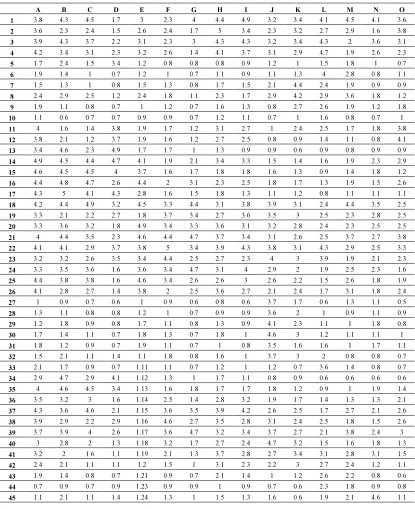
Table 3 presents descriptive statistics of the performance ratings of the sample of 220 SF soldiers, including the mean rating and standard deviation for each of the 15 categories of performance. Table 4 presents the SME mean attribute requirement rating for each of the 15 categories of performance.
Principal Components and Exploratory Factor Analyses
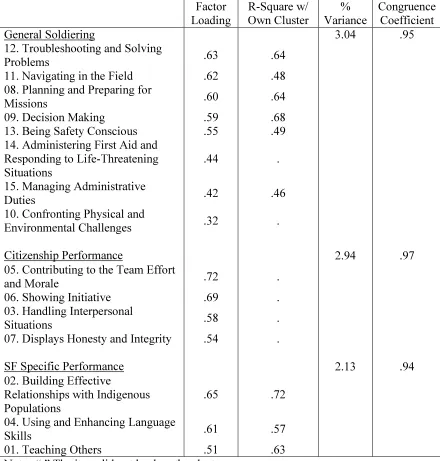
eigenvalues, scree plots, and rotated factor patterns, the three-factor solution was deemed the most interpretable and meaningful. These factors were interpreted and named. Table 5 summarizes the three-factor solution by presenting the salient performance categories, percentage of variance explained, cluster membership, and congruence coefficient associated with each factor. See Appendix B for the correlation matrix, principal components eigenvalue table, principal axes eigenvalue table, and two, three, and four-factor rotated four-factor patterns for the whole sample of performance ratings.
A principal components analysis was also performed on the attribute requirement ratings. Based on Kaiser’s (1970) and an examination of the scree plot it was decided that two, three, and four-factor solutions be generated. The attribute requirement ratings were then factor analyzed, with orthogonal rotations generating two, three, and four-factor solutions. Based on examination of the eigenvalues, scree plots, and rotated four-factor patterns, the four-factor solution was deemed the most interpretable and meaningful. The resulting factors were interpreted and named. Table 6 summarizes the four-factor
solution. See Appendix C for the correlation matrix, principal components eigenvalue table, principal axes eigenvalue table, and two, three, and four-factor rotated factor patterns for the sample of mean attribute requirement ratings.
Factor Structure Stability
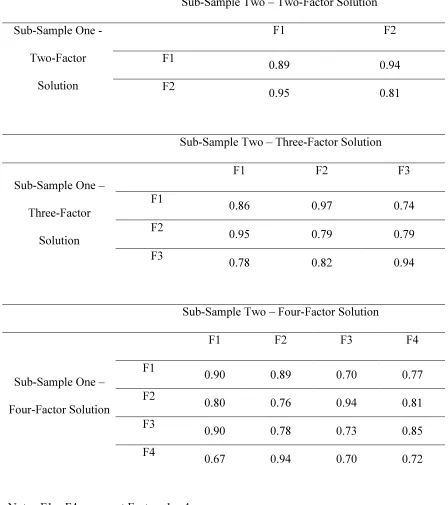
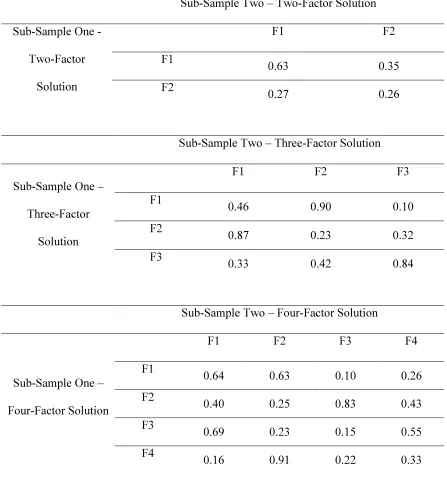
In order to further test the stability of the factor structure underlying the sample of performance ratings, the two randomly generated sub-samples were each factor analyzed. Both orthogonal and oblique rotations were incorporated in rotating two, three, and four-factor solutions. For each rotation and four-factor solution a matrix was generated with cell entries consisting of coefficients of congruence between two factors generated from the two sub-samples. Table 7 presents the complete matrix of cross-sample coefficients for the orthogonal rotations, and Table 8 presents the coefficients for the oblique rotations. The congruence coefficients were generally higher for the factors subjected to orthogonal rotations. The matched sub-sample coefficients for the oblique rotations were .63 and .26 for the two-factor solution, ranged from .84 to .90 for the three-factor solution, and ranged from .55 to .91 for the four-factor solution. Matched coefficients for the
orthogonal rotations were .94 and .95 for the two-factor solution, ranged from .94 to .97 for the three-factor solution, and ranged from .85 to .94 for the four-factor solution. Table 5 presents the whole sample factors associated with each matched sub-sample congruence coefficient. See Appendices D and E for the correlation matrices, eigenvalue tables, and two, three, and four-factor orthogonal rotated factor patterns for each sub-sample.
Job Analyst Reliability
Cluster Analyses
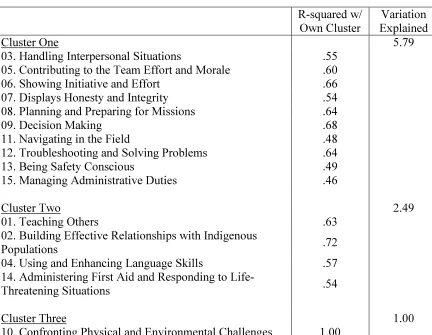
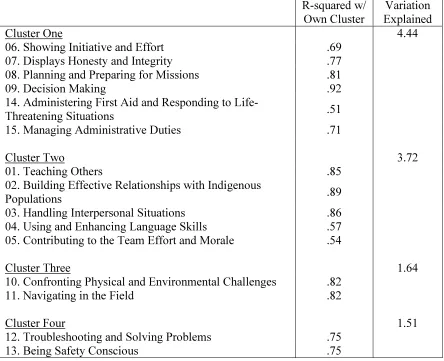
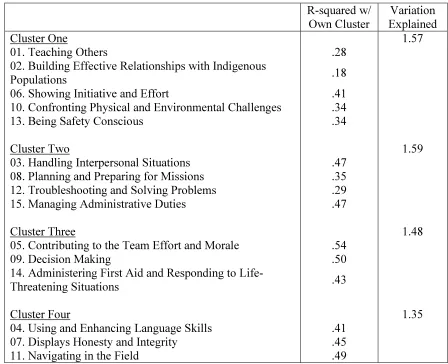
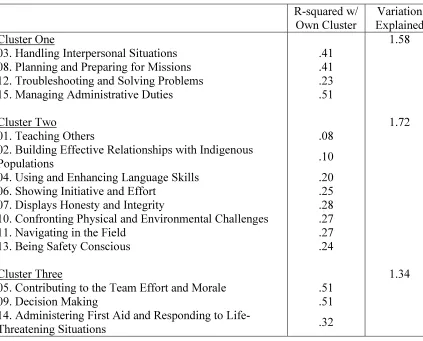
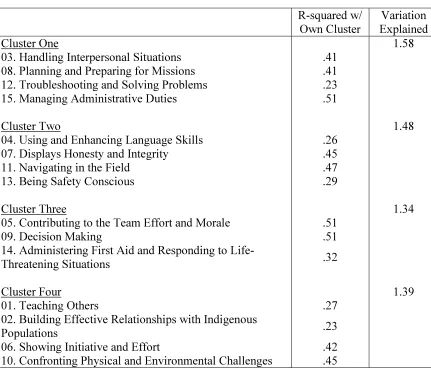
All three data sources were analyzed using the VARCLUS method of clustering. The clusters generated from the performance ratings and attribute requirement ratings were also matched with the factors generated from the previous factor analyses of these data sets. In most cases the clusters and factors were highly similar. See Tables 5 and 6 for summaries of the factor solutions chosen from each of the two data sets, which include cluster membership. Table 9 presents the three-cluster solution generated from the performance ratings, and Table 10 presents the four-cluster solution generated from the attribute requirement ratings. Appendices G and H present the complete results associated with the two, three, and four-cluster solutions generated from the performance ratings and attribute requirement ratings. The job analyst sorting data of the performance categories was transformed using the previously discussed procedure, and was also subjected to cluster analyses. Tables 11 and 12 present the three and four-cluster solutions generated from the analyst three-group sorting data. Tables 13 and 14 present the three and four-cluster solutions generated from the four-group sorting data.
Appendices I and J present the complete results associated with the two, three, and four-cluster solutions from three and four-group analyst sorting data.
Index of Cluster Overlap
revealed indices ranging from .33 to .58 for the three-cluster solutions, and .37 to .50 for the four-cluster solutions. Overlap indices were lower for cluster comparisons between the analyst sorting data clusters (both three-group and four-group) and the clusters generated from both of the other data sources. Table 15 presents the overlap indices between the clusters generated from the performance ratings and the three and four-group analyst sorting data. Table 16 presents the indices between attribute requirement clusters and the three and four-group analyst sorting data. Finally, Table 17 presents overlap indices between the clusters generated from the performance ratings and attribute requirement ratings.
Discussion
This research was conducted in order to explore the dimensionality of
performance in the Army Special Forces. Specifically, the goals were to analyze three separate data sets and to then make comparisons between the various performance dimensions produced in these analyses in order to determine the extent to which agreement existed between the dimensions. For the most part, agreement was low
between the various clusters derived from each data source, however further discussion is warranted.
congruence coefficients associated with the orthogonal rotations. The three factors derived from this analysis were interpreted and named General Soldiering, Citizenship Performance, and SF Specific Performance. Although the three-cluster solution
generated from the performance ratings was not identical to the three-factor solution, the two were similar. One notable exception included a one-item cluster (which was not the case with any of the factors), with the performance category “Confronting Physical and Environmental Challenges” forming its own cluster. These dimensions derived from the analyses of the performance ratings are based on covariation in the way SF supervisors rate their subordinates on the 15 performance categories.
Similarities also existed between the three dimensions derived from the
performance ratings, and previous models of performance. First of all, a task/contextual distinction can be seen in that the Citizenship Performance factor might represent what has been conceptualized as contextual performance, and the General Soldiering and SF Specific Performance factors represent a distinction between two types of task
performance factor. The other two dimensions are similar to Grant’s (1996) in that they both deal with task behaviors.
The attribute requirement ratings were also factor analyzed, with a four-factor solution being deemed the most meaningful and interpretable. The four factors were interpreted and named Interpersonal Activities, Management and Planning, Field
Endurance and Orientation, and Safety and First Aid. The four-cluster solution generated from this same data was highly similar to the derived factor solution. These dimensions are then based on covariation in the way the panel of SMEs rated each performance category on its requirement for certain human attributes. Though the dimensions derived from this data source were not as meaningful as those derived from the performance ratings in the opinion of the researcher, these dimensions may be appropriate in certain contexts to be discussed subsequently. Furthermore, these dimensions also showed similarities to the previously described performance models. The Interpersonal Activities dimension may represent contextual performance while the other three dimensions
represent three types of task performance (Borman & Motowidlo, 1993; Motowidlo & Van Scotter, 1994; Werner, 1994). The Interpersonal Activities dimension is also similar to Campbell’s (1992) Demonstrating Effort factor, and the other three dimensions may represent a mixture of the Job Specific and Non-Job Specific factors.
estimate may suggest that the analysts were consistent, however the dimensions seemed less meaningful than those derived from the performance and attribute requirement ratings. There also did not seem to be high degree of overlap between the derived clusters and the previously developed models of performance. Though the analysts were given a predefined number of groups in which to place the categories, the dimensions derived from this data are based on the job analyst’s “mental models” of what
performance categories were similar to each other. It is however possible that having the analysts perform more than one sort of the categories distorted the results. Specifically, each previous sort may have confounded the way the analysts grouped the categories subsequently. Though the order of the sorts was counterbalanced (i.e., three first or four first) to help control for these influences, it is likely that order effects played a role in the groupings. It should also be noted that the original proposal for this research included the use of actual SF soldiers as opposed to job analysts for completing the Q-sort procedure. Though the analysts were certainly capable of grouping the performance categories based on their descriptions, it would have been preferable to derive dimensions based on the mental models of individuals who actually perform the behaviors associated with the categories.
The final research question of interest focused on agreement between the
dimensions derived from the three data sources. While there was no cutoff established as to an “acceptable” level of overlap between cluster solutions, the overlap indices
performance rating and attribute requirement rating clusters. Matched clusters from these two data sources revealed indices ranging from .33 to .58 for the three-cluster solutions, and .37 to .50 for the four-cluster solutions. Overlap indices were lower for cluster comparisons between the analyst sorting data clusters (both three-group and four-group) and the clusters generated from both of the other data sources. Concurrently, it was very difficult to match clusters from the analyst sorting data with the clusters from the
performance ratings and attribute requirement ratings. Based on these cluster comparisons, it would seem that the job analyst’s groupings of the performance
categories do not closely resemble the dimensions based on covariation in SF supervisor ratings or covariation in SME attribute requirement ratings. It is however highly possible that this finding stems from methodological differences in way the data were collected. In both the performance ratings and attribute ratings, participants provided a rating of some stimulus (i.e., either a person or a performance category), while the job analysts performed the distinctly different task of putting stimuli into groups. Nevertheless, given the interpretability of the three-dimension solution generated from performance ratings, and the relative agreement with the dimensions generated from the attribute requirement ratings, this may provide partial support for a three-dimension conception of SF job performance.
derived based on covariation in actual performance ratings may be more appropriate. However, it could be that in human resource contexts such selection or training, using dimensions derived based on covariation in ratings on human attribute prerequisites may be preferable. For example, the attribute requirement based dimensions could prove useful in the estimation of the attribute requirements of jobs or missions. The factor coefficients could serve as weights in using the job component method to estimate the requirements indirectly (Cunningham, Powell, Wimpee, & Wilson, 1996). In other words, the context and purpose of application should be considered when selecting the data source from which to derive dimensions.
Future research should address several issues to improve upon this research. First of all, an additional job analysis of the SF could be valuable. The previous job analysis was conducted eight years ago (Russell et al., 1994), and it is possible that new
performance categories should be added. Furthermore, additional performance data would be valuable for cross-validating the structure derived from the previously collected data (Diana et al., 1997). Furthermore, tests using structural models of SF performance might provide a more thorough investigation. Researchers should also investigate the context specificity of SF performance models. Different SF groups perform their jobs in highly diverse geographic regions of the world. Therefore it could be that SF
determine differences in the mental models of performance that different types of raters possess.
The Q-sort method incorporated in this research could also be improved upon. In the event that a larger sample was available, it would be ideal to have participants sort the performance categories only once, to eliminate the potential order effects. More
information could have been provided to the analysts regarding each performance category, such as an example of the BARS associated with each category. This would have provided a more thorough description of each category, and perhaps provided more context for individuals who were not familiar with the job of a SF soldier. Ideally, a future study would have actual SF soldiers perform the Q-sort procedure, as was originally proposed.
References
Austin, J. T., & Villanova, P. (1992). The criterion problem: 1917 – 1992. Journal of Applied Psychology, 77, 836-874.
Berkshire, J. R., & Highland, R. W. (1953). Forced-choice performance rating – A methodological study. Personnel Psychology, 6, 355-378.
Borman, W. C., & Motowidlo, S. J. (1993). Expanding the criterion domain to include elements of contextual performance. In W. C. Borman (Ed.), Personnel Selection in Organizations. San Francisco: Jossey-Bass (pp. 71-98).
Campbell, J. P. (1992). Modeling the performance prediction problem in Industrial and Organizational Psychology. In M. D. Dunnette & L. M. Hough (Eds.), Handbook of Industrial and Organizational Psychology. Palo Alto, CA: Consulting Psychologists Press (pp. 687-732).
Cronbach, L. J. (1951). Coefficient alpha and the internal structure of tests. Psychometrika, 16, 297-334.
Cunningham, J. W. (1999). Development of an integrated system for assessment of Special Forces job requirements and performance: A proposal. Unpublished
manuscript.
Cunningham, J. W., Powell, T. E., Wimpee, W. E., & Wilson, M. A. (1996). Ability requirement factors for general job elements. Military Psychology, 8, 219-234.
Research and Applications (ARI report No. 33, pp. 53-66). Alexandria, VA: U.S. Army Research Institute for the Behavioral and Social Sciences.
Grant, L. D. (1996). A comprehensive examination of the latent structure of job performance. Unpublished doctoral dissertation, North Carolina State University, Raleigh.
Guion, R. M. (1998). Assessment, measurement, and prediction for personnel decisions. Mahway, NJ: Lawrence Erlbaum Associates.
Hatcher, L. (1994). A step-by-step approach to using the SAS system for factor analysis and structural equation modeling. Cary, NC: SAS Institute, Inc.
Kaiser, H. F. (1970). A second generation little jiffy. Psychometrika, 35, 401. Motowidlo, S. J., & Van Scotter, J. R. (1994). Evidence that task performance should be distinguished from contextual performance. Journal of Applied Psychology, 79, 475-480.
Nunnally, J. C., & Bernstein, I. H. (1994). Psychometric Theory (3rd ed.). New York, NY: McGraw-Hill.
Rummel, R. J. (1970). Applied Factor Analysis. Evanston: Northwestern University Press.
Russell, T. L., Crafts, J. L., Tagliareni, F. A., McCloy, R. A., & Barkley, P. (1996). Job Analysis of Special Forces Jobs (ARI Research Note 96-76). Alexandria, VA: U.S. Army Research Institute for the Behavioral and Social Sciences.
Tucker, L.R. (1951). A method for synthesis of factor analysis studies. Personnel Research Section Report #984. Washington, D.C.: US. Department of the Army.
Werner, J. M. (1994). Dimensions that make a difference: Examining the impact of in-role and extra-role behaviors on supervisory ratings. Journal of Applied
Psychology, 79, 98-107.
Table 1
Special Forces Job Performance Categories
Performance Category
A. Teaching Others
B. Building Effective Relationships with Indigenous Populations C. Handling Interpersonal Situations
D. Using and Enhancing Language Skills E. Contributing to the Team Effort and Morale F. Showing Initiative and Effort
G. Displays Honesty and Integrity H. Planning and Preparing for Missions I. Decision Making
J. Confronting Physical and Environmental Challenges K. Navigating in the Field
L. Troubleshooting and Solving Problems M. Being Safety Conscious
N. Administering First Aid and Responding to Life-Threatening Situations O. Managing Administrative Duties
Table 2 (Page 1 of 2)
Human Attributes Required in the SF
Attribute
1. Judgment 2. Planning 3. Adaptability 4. Creativity 5. Auditory Ability 6. Mechanical Ability 7. Spatial Ability 8. Perceptual Ability 9. Basic Math 10. Advanced Math 11. Reading Ability 12. Writing Ability 13. Language Ability 14. Communication
15. Non-Verbal Communication 16. Persuasiveness
17. Cultural/Interpersonal Adaptability 18. Maturity
19. Autonomy 20. Team Playership 21. Dependability 22. Initiative 23. Perseverance 24. Moral Courage 25. Motivating Others 26. Supervising 27. Swimming
28. Physical Flexibility and Balance 29. Physical Strength
30. Physical Endurance 31. Psychomotor Ability
32. Interest in Adventure and Outdoor Activities 33. Interest in Skilled Trades
Table 2 (Page 2 of 2)
36. Enterprising Interests 37. Leadership
38. Achievement and Effort 39. Personal Discipline
40. Physical Fitness and Military Bearing 41. General Soldiering Proficiency 42. Infantry Core Technical Proficiency 43. Combat Engineer Technical Proficiency
Table 3
Descriptive Statistics for the Performance Ratings of SF Soldiers Performance
Category N Mean Std Dev Minimum Maximum
A. 220 5.127 1.279 1.00 7.00
B. 220 5.318 1.313 1.00 7.00
C. 220 5.009 1.395 1.00 7.00
D. 220 4.677 1.505 1.00 7.00
E. 220 5.123 1.452 1.00 7.00
F. 220 5.618 1.401 1.00 7.00
G. 220 5.727 1.281 1.00 7.00
H. 220 5.268 1.302 1.00 7.00
I. 220 5.068 1.197 1.00 7.00
J. 220 5.773 1.152 1.00 7.00
K. 220 5.609 1.069 2.00 7.00
L. 220 5.373 1.238 2.00 7.00
M. 220 5.491 1.188 1.00 7.00
N. 220 5.355 1.139 1.00 7.00
O. 220 5.350 1.209 1.00 7.00
Table 4
SME Mean Attribute Requirement Ratings for the 15 Performance Categories
A B C D E F G H I J K L M N O 1 3.8 4.3 4.5 1.7 3 2.3 4 4.4 4.9 3.2 3.4 4.1 4.5 4.1 3.6
2 3.6 2.3 2.4 1.5 2.6 2.4 1.7 5 3.4 2.3 3.2 2.7 2.9 1.6 3.8
3 3.9 4.3 3.7 2.2 3.1 2.3 3 4.3 4.3 3.2 3.4 4.3 2 3.6 3.1
4 4.2 3.4 3.1 2.3 3.2 2.6 1.4 4.1 3.7 3.1 2.9 4.7 1.9 2.6 2.3
5 1.7 2.4 1.5 3.4 1.2 0.8 0.8 0.8 0.9 1.2 1 1.5 1.8 1 0.7
6 1.9 1.4 1 0.7 1.2 1 0.7 1.1 0.9 1.1 1.3 4 2.8 0.8 1.1
7 1.5 1.3 1 0.8 1.5 1.3 0.8 1.7 1.5 2.1 4.4 2.4 1.9 0.9 0.9
8 2.4 2.9 2.5 1.2 2.4 1.8 1.1 2.3 1.7 2.9 4.2 2.9 3.6 1.8 1.2
9 1.9 1.1 0.8 0.7 1 1.2 0.7 1.6 1.3 0.8 2.7 2.6 1.9 1.2 1.8
10 1.1 0.6 0.7 0.7 0.9 0.9 0.7 1.2 1.1 0.7 1 1.6 0.8 0.7 1
11 4 1.6 1.4 3.8 1.9 1.7 1.2 3.1 2.7 1 2.4 2.5 1.7 1.8 3.8
12 3.8 2.1 1.2 3.7 1.9 1.6 1.2 2.7 2.5 0.8 0.9 1.4 1.1 0.8 4.1
13 3.4 4.6 2.3 4.9 1.7 1.7 1 1.3 0.9 0.9 0.6 0.9 0.8 0.9 0.9
14 4.9 4.5 4.4 4.7 4.1 1.9 2.1 3.4 3.3 1.5 1.4 1.6 1.9 2.3 2.9
15 4.6 4.5 4.5 4 3.7 1.6 1.7 1.8 1.8 1.6 1.3 0.9 1.4 1.8 1.2
16 4.4 4.8 4.7 2.6 4.4 2 3.1 2.3 2.5 1.8 1.7 1.3 1.9 1.5 2.6
17 4.3 5 4.1 4.3 2.8 1.6 1.5 1.8 1.3 1.1 1.2 0.8 1.1 1.1 1.1
18 4.2 4.4 4.9 3.2 4.5 3.3 4.4 3.1 3.8 3.9 3.1 2.4 4.4 3.5 2.5
19 3.3 2.1 2.2 2.7 1.8 3.7 3.4 2.7 3.6 3.5 3 2.5 2.3 2.8 2.5
20 3.3 3.6 3.2 1.8 4.9 3.4 3.3 3.6 3.1 3.2 2.8 2.4 2.3 2.5 2.5
21 4 4.4 3.5 2.3 4.6 4.4 4.7 3.7 3.4 3.1 2.6 2.5 3.7 2.7 3.8
22 4.1 4.1 2.9 3.7 3.8 5 3.4 3.9 4.3 3.8 3.1 4.3 2.9 2.5 3.3
23 3.2 3.2 2.6 3.5 3.4 4.4 2.5 2.7 2.3 4 3 3.9 1.9 2.1 2.3
24 3.3 3.5 3.6 1.6 3.6 3.4 4.7 3.1 4 2.9 2 1.9 2.5 2.3 1.6
25 4.4 3.8 3.8 1.6 4.6 3.4 2.6 2.6 3 2.6 2.2 1.5 2.6 1.8 1.9
26 4.1 2.8 2.7 1.4 3.8 2 2.5 3.6 2.7 2.1 2.4 1.7 3.1 1.8 2.4
27 1 0.9 0.7 0.6 1 0.9 0.6 0.8 0.6 3.7 1.7 0.6 1.3 1.1 0.5
28 1.3 1.1 0.8 0.8 1.2 1 0.7 0.9 0.9 3.6 2 1 0.9 1.1 0.9
29 1.2 1.8 0.9 0.8 1.7 1.1 0.8 1.3 0.9 4.1 2.3 1.1 1 1.8 0.8
30 1.7 1.4 1.1 0.7 1.8 1.3 0.7 1.8 1 4.6 3 1.2 1.1 1.1 1
31 1.8 1.2 0.9 0.7 1.9 1.1 0.7 1 0.8 3.5 1.6 1.6 1 1.7 1.1
32 1.5 2.1 1.1 1.4 1.1 1.8 0.8 1.6 1 3.7 3 2 0.8 0.8 0.7
33 2.1 1.7 0.9 0.7 1.11 1.1 0.7 1.2 1 1.2 0.7 3.6 1.4 0.8 0.7
34 2.9 4.7 2.9 4.1 1.12 1.3 1 1.7 1.1 0.8 0.9 0.6 0.6 0.6 0.6
35 4 4.6 4.5 3.4 1.13 1.6 1.8 1.7 1.7 1.8 1.2 0.9 1 1.9 1.4
36 3.5 3.2 3 1.6 1.14 2.5 1.4 2.8 3.2 1.9 1.7 1.4 1.3 1.3 2.1
37 4.3 3.6 4.6 2.1 1.15 3.6 3.5 3.9 4.2 2.6 2.5 1.7 2.7 2.1 2.6
38 3.9 2.9 2.2 2.9 1.16 4.6 2.7 3.5 2.8 3.1 2.4 2.5 1.8 1.5 2.6
39 3.7 3.9 4 2.6 1.17 3.6 4.7 3.2 3.4 3.7 2.7 2.1 3.8 2.4 3
40 3 2.8 2 1.3 1.18 3.2 1.7 2.7 2.4 4.7 3.2 1.5 1.6 1.8 1.3
41 3.2 2 1.6 1.1 1.19 2.1 1.3 3.7 2.8 2.7 3.4 3.1 2.8 3.1 1.5
42 2.4 2.1 1.1 1.1 1.2 1.5 1 3.1 2.3 2.2 3 2.7 2.4 1.2 1.1
43 1.9 1.4 0.8 0.7 1.21 0.9 0.7 2.1 1.4 1 1.2 2.6 2.2 0.8 0.6
44 0.7 0.9 0.7 0.9 1.23 0.9 0.9 1 0.9 0.7 0.6 2.3 1.8 0.9 0.8
Table 5
SF Performance Rating Factor Analysis (Three-Factor Orthogonal Rotation): Factor Title, Salient Performance Categories, R-Square With Own Cluster, % Variance Explained, and Congruence Coefficient
Factor Loading R-Square w/ Own Cluster % Variance Congruence Coefficient
General Soldiering 3.04 .95
12. Troubleshooting and Solving
Problems .63 .64
11. Navigating in the Field .62 .48 08. Planning and Preparing for
Missions .60 .64
09. Decision Making .59 .68
13. Being Safety Conscious .55 .49 14. Administering First Aid and
Responding to Life-Threatening Situations
.44 . 15. Managing Administrative
Duties .42 .46
10. Confronting Physical and
Environmental Challenges .32 .
Citizenship Performance 2.94 .97
05. Contributing to the Team Effort
and Morale .72 .
06. Showing Initiative .69 . 03. Handling Interpersonal
Situations .58 .
07. Displays Honesty and Integrity .54 .
SF Specific Performance 2.13 .94
02. Building Effective
Relationships with Indigenous Populations
.65 .72 04. Using and Enhancing Language
Skills .61 .57
01. Teaching Others .51 .63
Table 6
SF Attribute Requirement Rating Factor Analysis (4-Factor Orthogonal Rotation): Factor Title, Salient Performance Categories, R-Square With Own Cluster, and % Variance Explained Factor Loading R-Square w/ Own Cluster % Variance
Interpersonal Activities 4.61
02. Building Effective
Relationships with Indigenous Populations
.92 .89 03. Handling Interpersonal
Situations .88 .86
01. Teaching Others .84 .85
04. Using and Enhancing Language
Skills .78 .57
07. Displays Honesty and Integrity .61 . 05. Contributing to the Team Effort
and Morale .57 .54
Management and Planning 3.06
08. Planning and Preparing for
Missions .79 .81
15. Managing Administrative
Duties .75 .71
09. Decision Making .69 .92
12. Troubleshooting and Solving
Problems .58 .
Field Endurance and Orientation 1.97
10. Confronting Physical and
Environmental Challenges .85 .82
11. Navigating in the Field .64 .82 06. Showing Initiative and Effort .55 .
Safety and First Aid 1.75
13. Being Safety Conscious .69 . 14. Administering First Aid and
Responding to Life-Threatening Situations
Table 7
Congruence Coefficients for Orthogonal Rotations of Two, Three, and Four Factors
Sub-Sample Two – Two-Factor Solution
F1 F2
F1
0.89 0.94 Sub-Sample One -
Two-Factor
Solution F2
0.95 0.81
Sub-Sample Two – Three-Factor Solution
F1 F2 F3
F1
0.86 0.97 0.74 F2
0.95 0.79 0.79 Sub-Sample One –
Three-Factor Solution
F3
0.78 0.82 0.94
Sub-Sample Two – Four-Factor Solution
F1 F2 F3 F4 F1
0.90 0.89 0.70 0.77 F2
0.80 0.76 0.94 0.81 F3
0.90 0.78 0.73 0.85 Sub-Sample One –
Four-Factor Solution
F4
0.67 0.94 0.70 0.72
Table 8
Congruence Coefficients for Oblique Rotations of Two, Three, and Four Factors
Sub-Sample Two – Two-Factor Solution
F1 F2
F1
0.63 0.35 Sub-Sample One -
Two-Factor
Solution F2
0.27 0.26
Sub-Sample Two – Three-Factor Solution
F1 F2 F3
F1
0.46 0.90 0.10 F2
0.87 0.23 0.32 Sub-Sample One –
Three-Factor Solution
F3
0.33 0.42 0.84
Sub-Sample Two – Four-Factor Solution
F1 F2 F3 F4 F1
0.64 0.63 0.10 0.26 F2
0.40 0.25 0.83 0.43 F3
0.69 0.23 0.15 0.55 Sub-Sample One –
Four-Factor Solution
F4
0.16 0.91 0.22 0.33
Table 9
Three-Cluster Solution Generated from SF Performance Ratings
R-squared w/ Own Cluster
Variation Explained
Cluster One 5.79
03. Handling Interpersonal Situations .55 05. Contributing to the Team Effort and Morale .60 06. Showing Initiative and Effort .66 07. Displays Honesty and Integrity .54 08. Planning and Preparing for Missions .64
09. Decision Making .68
11. Navigating in the Field .48
12. Troubleshooting and Solving Problems .64
13. Being Safety Conscious .49
15. Managing Administrative Duties .46
Cluster Two 2.49
01. Teaching Others .63
02. Building Effective Relationships with Indigenous
Populations .72
04. Using and Enhancing Language Skills .57 14. Administering First Aid and Responding to
Life-Threatening Situations .54
Cluster Three 1.00
Table 10
Four-Cluster Solution Generated from Attribute Requirement Ratings R-squared w/
Own Cluster
Variation Explained
Cluster One 4.44
06. Showing Initiative and Effort .69 07. Displays Honesty and Integrity .77 08. Planning and Preparing for Missions .81
09. Decision Making .92
14. Administering First Aid and Responding to
Life-Threatening Situations .51
15. Managing Administrative Duties .71
Cluster Two 3.72
01. Teaching Others .85
02. Building Effective Relationships with Indigenous
Populations .89
03. Handling Interpersonal Situations .86 04. Using and Enhancing Language Skills .57 05. Contributing to the Team Effort and Morale .54
Cluster Three 1.64
10. Confronting Physical and Environmental Challenges .82
11. Navigating in the Field .82
Cluster Four 1.51
12. Troubleshooting and Solving Problems .75
Table 11
Three-Cluster Solution Generated from the Three-Group Analyst Sorting Data R-squared w/
Own Cluster
Variation Explained
Cluster One 1.89
01. Teaching Others .20
02. Building Effective Relationships with Indigenous
Populations .15
04. Using and Enhancing Language Skills .21 06. Showing Initiative and Effort .26 07. Displays Honesty and Integrity .25 10. Confronting Physical and Environmental Challenges .25
11. Navigating in the Field .23
13. Being Safety Conscious .30
Cluster Two 1.59
03. Handling Interpersonal Situations .47 08. Planning and Preparing for Missions .35 12. Troubleshooting and Solving Problems .29 15. Managing Administrative Duties .47
Cluster Three 1.48
05. Contributing to the Team Effort and Morale .54
09. Decision Making .50
14. Administering First Aid and Responding to
Table 12
Four-Cluster Solution Generated from the Three-Group Analyst Sorting Data R-squared w/
Own Cluster
Variation Explained
Cluster One 1.57
01. Teaching Others .28
02. Building Effective Relationships with Indigenous
Populations .18
06. Showing Initiative and Effort .41 10. Confronting Physical and Environmental Challenges .34
13. Being Safety Conscious .34
Cluster Two 1.59
03. Handling Interpersonal Situations .47 08. Planning and Preparing for Missions .35 12. Troubleshooting and Solving Problems .29 15. Managing Administrative Duties .47
Cluster Three 1.48
05. Contributing to the Team Effort and Morale .54
09. Decision Making .50
14. Administering First Aid and Responding to
Life-Threatening Situations .43
Cluster Four 1.35
04. Using and Enhancing Language Skills .41 07. Displays Honesty and Integrity .45
Table 13
Three-Cluster Solution Generated from the Four-Group Analyst Sorting Data R-squared w/
Own Cluster
Variation Explained
Cluster One 1.58
03. Handling Interpersonal Situations .41 08. Planning and Preparing for Missions .41 12. Troubleshooting and Solving Problems .23 15. Managing Administrative Duties .51
Cluster Two 1.72
01. Teaching Others .08
02. Building Effective Relationships with Indigenous
Populations .10
04. Using and Enhancing Language Skills .20 06. Showing Initiative and Effort .25 07. Displays Honesty and Integrity .28 10. Confronting Physical and Environmental Challenges .27
11. Navigating in the Field .27
13. Being Safety Conscious .24
Cluster Three 1.34
05. Contributing to the Team Effort and Morale .51
09. Decision Making .51
14. Administering First Aid and Responding to
Table 14
Four-Cluster Solution Generated from the Four-Group Analyst Sorting Data R-squared w/
Own Cluster
Variation Explained
Cluster One 1.58
03. Handling Interpersonal Situations .41 08. Planning and Preparing for Missions .41 12. Troubleshooting and Solving Problems .23 15. Managing Administrative Duties .51
Cluster Two 1.48
04. Using and Enhancing Language Skills .26 07. Displays Honesty and Integrity .45
11. Navigating in the Field .47
13. Being Safety Conscious .29
Cluster Three 1.34
05. Contributing to the Team Effort and Morale .51
09. Decision Making .51
14. Administering First Aid and Responding to
Life-Threatening Situations .32
Cluster Four 1.39
01. Teaching Others .27
02. Building Effective Relationships with Indigenous
Populations .23
Table 15
Cluster Overlap Indices Between Performance Ratings and Three and Four-Group Analyst Sort Data
Performance Ratings – 2 Cluster Solution
1 2
1 .3571 .3333
Three-Group Sort Data
2 .5000 .1000
Performance Ratings – 3 Cluster Solution
1 2 3 1 .3571 .2222 .1250 2 .3636 0 0 Three-Group
Sort Data
3 .1666 .2000 0
Performance Ratings – 4 Cluster Solution
1 2 3 4 1 .1111 .2857 .2000 .1111 2 .2857 0 0 .2857
3 .1428 .1666 0 .1428
Three-Group Sort Data
4 .1428 .1666 0 .1428
Performance Ratings – 2 Cluster Solution
1 2
1 .5000 .1000
Four-Group Sort Data
2 .3571 .3333
Performance Ratings – 3 Cluster Solution
1 2 3 1 .3636 0 0 2 .3571 .2222 .1250 Four-Group
Sort Data
3 .1666 .2000 0
Performance Ratings – 4 Cluster Solution
1 2 3 4 1 .2857 0 0 .2857
2 .1250 .1428 0 .2857
3 .1428 .1666 0 .1428
Four-Group Sort Data
Table 16
Cluster Overlap Indices Between Attribute Requirement Ratings and Three and Four-Group Analyst Sort Data
Attribute Requirement Ratings – 2 Cluster Solution
1 2
1 .3846 .3000
Three-Group Sort Data
2 .4166 .2000
Attribute Requirement Ratings – 3 Cluster Solution
1 2 3 1 .2307 .3000 .2500
2 .3333 .1250 0
Three-Group Sort Data
3 .2222 .1428 0
Attribute Requirement Ratings – 4 Cluster Solution
1 2 3 4 1 .1000 .2500 .1666 .1666
2 .2500 .1250 0 .2000
3 .2857 .1428 0 0
Three-Group Sort Data
4 .1250 .1428 .2500 0 Attribute Requirement Ratings – 2 Cluster Solution
1 2
1 .4166 .2000
Four-Group Sort Data
2 .3846 .3000
Attribute Requirement Ratings – 3 Cluster Solution
1 2 3
1 .3333 .1250 0
2 .2307 .3000 .2500 Four-Group
Sort Data
3 .2222 .1428 0
Attribute RequirementRatings – 4 Cluster Solution
1 2 3 4
1 .2500 .1250 0 .2000
2 .1111 .1250 .2000 .2000
3 .2857 .1428 0 0
Four-Group Sort Data
Table 17
Cluster Overlap Indices Between Performance Ratings and Attribute Requirement Ratings
Attribute Requirement Ratings – 2 Cluster Solution
1 2
1 .6153 .2307
Performance Rating – 2 Cluster Solution
2 .1666 .2857
Attribute Requirement Ratings – 3 Cluster Solution
1 2 3 1 .5833 .2307 .0833
2 .1000 .3333 0
Performance Rating – 3
Cluster
Solution 3 0 0 .5000
Attribute Requirement Ratings – 4 Cluster Solution
1 2 3 4
1 .3750 .2500 0 0
2 .1111 .5000 0 0
3 0 0 .5000 0
Performance Rating – 4
Cluster Solution
Figure 1
The Task/Contextual Model of Job Performance
Task Performance
Task Measure 4 Task Measure 3 Task Measure 2 Task Measure 1
Contextual Performance
Figure 2 (Page 1 of 2)
Campbell’s (1992) Eight-Factor Model of Job Performance
Job-specific Task Proficiency
Job-specific Measure 4 Job-specific Measure 3 Job-specific Measure 2 Job-specific Measure 1
Non Job-specific Task
Proficiency
Non Job-specific Measure 4 Non Job-specific Measure 3 Non Job-specific Measure 2 Non Job-specific Measure 1
Written and Oral Communication
Written and Oral Measure 4 Written and Oral Measure 3 Written and Oral Measure 2 Written and Oral Measure 1
Demonstrating Effort
Figure 2 (Page 2 of 2)
Maintaining Personal Discipline
Maintaining Personal Discipline Measure 4 Maintaining Personal Discipline Measure 3 Maintaining Personal Discipline Measure 2 Maintaining Personal Discipline Measure 1
Facilitating Peer and Team Performance
Facilitating Peer and Team Measure 4 Facilitating Peer and Team Measure 3 Facilitating Peer and Team Measure 2 Facilitating Peer and Team Measure 1
Supervision
Supervision Measure 4 Supervision Measure 3 Supervision Measure 2 Supervision Measure 1
Management/ Administrative
Figure 3
Grant’s (1996) Three-Factor Model of Performance
Do Inrole Performance
Do Inrole Measure 4 Do Inrole Measure 3 Do Inrole Measure 2 Do Inrole Measure 1
Know Inrole Performance
Know Inrole Measure 4 Know Inrole Measure 3 Know Inrole Measure 2 Know Inrole Measure 1
Extrarole Performance
Appendix A
SPECIAL FORCES PERFORMANCE CATEGORIES
Background
A previous job analysis study has identified 15 “performance categories” representing different kinds of tasks that are performed within the Special Forces. These performance categories are intended to represent common requirements across all SF MOSs. A list of the 15 categories, along with their descriptions, is shown on Page 2.
Purpose of this Exercise
It would be useful for certain purposes, such as performance and training assessment, to condense the 15 performance categories to a smaller number of basic groups. We are asking for your help, as a subject-matter expert, in accomplishing this objective.
General Instructions
It is important to have each subject-matter expert’s individual judgment about how the performance categories should be grouped. For that reason, we ask that you carry out this exercise independently rather than in conference with others. All of the independent expert judgments will be processed statistically, and only the composite results will be reported. Your individual responses will not be divulged.
(1) First, please read and familiarize yourself with the entire list of 15 performance categories on Page 2.
(2) Next, read and carry out the instructions on Page 3. (3) Next, read and carry out the instructions on Page 4. (4) Finally, read and carry out the instructions on Page 5.