Division VIII
FACTORS AFFECTING PREDICTED NUMBER OF STRESS
CORROSION CRACKING TUBES IN STEAM GENERATOR
Kuk-Hee Lee1 and Yong-Seok Kang2
1 Senior Research Engineer, Central Research Institute, Korea Hydro & Nuclear Power, Korea 2 Principal Research Engineer, Central Research Institute, Korea Hydro & Nuclear Power, Korea
ABSTRACT
Outside diameter stress corrosion cracks have been detected in steam generator Alloy 600HTMA tubes as increasing operation time of nuclear power plants. Since steam generator chemical cleaning (SGCC) improves the performance of the eddy current inspection, there are significant jumps in the number of cracks detected by in-service inspection after SGCC. In this study, Monte Carlo simulations are performed to predict the number of detected cracks after SGCC. The input parameters are crack initiation model, crack growth rate model and probability of detection model. The improvement effect of SGCC on POD is also considered. After SGCC, a large number of sallow cracks can be detected due to improvement of POD and the number of detected cracks increases significantly.
INTRODUCTION
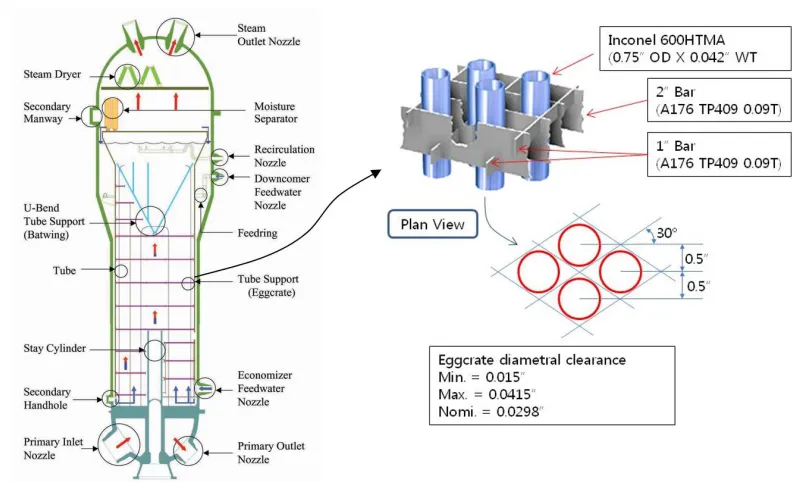
The Alloy 600HTMA tubes in steam generators are susceptible to outside diameter stress corrosion cracking (ODSCC) [Chung et al. (2013), Chung et al. (2014)]. It is assumed that the high residual stress of the Alloy 600HTMA tubes is principal cause of the susceptibility to ODSCC. Since more sludge is deposited in the between the tube and the tube support plate (TSP), most ODSCC were located at or near the line contacts between the tube and the TSP as shown in Figure 1. It is well known that heavy sludge in the secondary side of the steam generator causes ODSCC through the hide-out mechanism of impurities in the water [EPRI (2007), EPRI (2009)]. Steam generator chemical cleaning (SGCC) is implemented in order to reduce the sludge in secondary side of steam generator and mitigate ODSCC. Another important benefit of SGCC is the improvement of the performance of the eddy current inspection. Generally, there are big jumps in the number of cracks detected by in-service inspection after SGCC. The previous works [Chung et al. (2014), Intertek AIM (2014)] have carried out to understand this phenomenon in view of corrosion and in-service inspection.
In this study, Monte Carlo simulations are performed to calculate the number of detected ODSCCs after SGCC. The input parameters for the Monte Carlo simulations are crack initiation model, crack growth rate model and probability of detection (POD) model. The improvement effect of SGCC on POD is considered.
MONTE CARLO SIMULATION AND INPUT PARAMERTERS
Monte Carlo Simulation
24th Conference on Structural Mechanics in Reactor Technology
BEXCO, Busan, Korea - August 20-25, 2017 Division VIII
Figure 1. Structure of CE-type steam generator
The probability model used in OPCON for ODSCC with plug on detection consists of a Monte Carlo simulation of the processes for crack initiation, crack growth and POD. The state of crack of tubing is simulated in the model by total crack population that is defined by several attributes. First, number of initiated crack is calculated for the entire period of the analysis trial. And then, growth of the cracks for the cycle by random sampling from the crack growth rate distribution for the prescribed operational period for the cycle. Finally, a specific POD is applied to the crack depth and the population of detected cracks is calculated. The operating time is expressed in effective full power years (EFPY).
Factors affecting number of detected ODSCC are the crack initiation, the crack growth rate, the POD and size measurement error of the eddy current inspection. In order to predict the accurate number of ODSCC tubes, the above factors should be reflected in a prediction work. Generally, there are big jumps in the number of cracks detected by ECT after SGCC. To understanding this phenomenon, Monte Carlo simulation is performed in this study.
Crack Initiation
EPRI SGMP IAG (steam generator integrity assessment guidelines) does not present a crack initiation model. However, the Weibull function is generally used to predict number of initiated flaw in steam generator tubes. The two-parameter Weibull function is given as:
( ) 1 exp
b t F t
(1)
where
F(t) : cumulative fraction of tubes cracked
t : time (EFPY)
: scale parameter , equal to the time to 63.2% cracked
(a) Effect of b on crack initiation
(b) Effect of on crack initiation
24th Conference on Structural Mechanics in Reactor Technology
BEXCO, Busan, Korea - August 20-25, 2017 Division VIII
Figure 2(a) shows the effect of shape parameter, b, on variations of the Weibull function. Figure 2(b) shows the effect of scale parameter, on variations of the Weibull function at b = 6. At the time before time = , crack initiation decreases with increasing b. At the time after time = , crack initiation increases with increasing b. If b is constant, crack initiation is delayed as increasing .
Crack Growth Rate
The crack growth rate is necessary in order to project crack depth distributions in the Monte Carlo simulations. The initiated ODSCCs are growth into thickness direction and crack growth rate can be defined by changes in depth in terms of %TW/EFPY. EPRI SGMP IAG [EPRI (2016)] suggests the log-normal distribution to quantify crack growth rates, which is given as:
1 1 ln( )
exp ( 0)
( ) 2 2
0 ( 0)
x
x
f x x
x
(2)
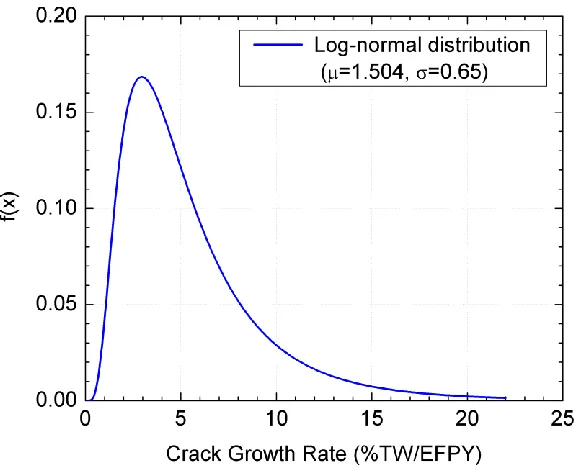
where and are the mean and the standard deviation of ln(X), respectively. In this study, the values = 1.504 and = 0.65, which is typical crack growth rate suggested in EPRI SGMP IAG, are used. The shape of function is shown in Figure 3. The maximum crack growth rate is limited by 22%TW/EFPY.
(a) Effect of a/b on POD
(b) Effect of a on POD
24th Conference on Structural Mechanics in Reactor Technology
BEXCO, Busan, Korea - August 20-25, 2017 Division VIII
Figure 5. Crack depth at POD=0.5
Probability of Detection (POD)
The detection performance of eddy-current-test (ECT) is quantified by the POD. The log-logistic function was determined to be the most appropriate for generic use [EPRI (2016)].
1 ( )
1 exp[ ( log )]
POD S
a b S
(3)
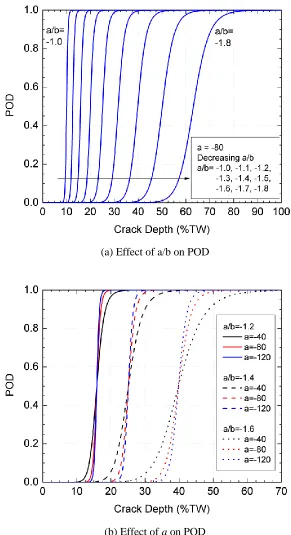
where S is crack depth (0 ~ 100%TW); a and b are mode parameters. The range of POD is from 0 to 1. As shown in Figure 4(a), the effect of the ratio a/b on POD is significant. If the value of a is constant, POD increases with a/b. Figure 4(b) shows the effect of a on POD. For constant a/b, the slope of log-logistic function decreases with a. The crack depth at POD = 0.5 is depending on a/b as follow relation (Figure 5):
b a
S10 / (4)
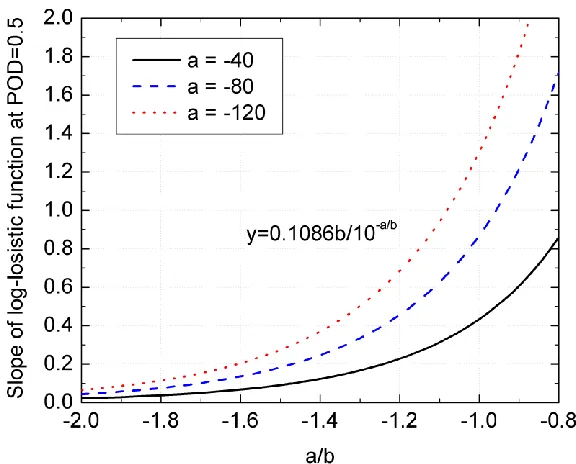
The slope at POD = 0.5 is depending on a and b as follow relation (Figure 6):
b a b ΔS Δ / 10 1086 . 0 (POD)
(5)
ECT sizing uncertainty
The ECT sizing uncertainty was not considered in the study.
INPUT PARAMETERS FOR SIMULATION
To calculate the number of initiated cracks using Weibull function, the value of b and are assumed by 6 and 13, respectively. The POD function of before-SGCC are assumed by a/b = -1.6 and a = -80, and the POD function of after-SGCC are assumed by a/b = -1.4 and a = -65. These POD function can be shown in Figure 7. Four simulations are performed for each chemical cleaning times which are 10.2, 12.8, 15.4 and 18.0 EFPY. The period of one operation cycle is assumed by 1.3 EFPY and ECT is performed for full bundle of tubes every outage.
SIMULATION RESULT AND EFFECT OF SGCC ON DETECTED CRACK POPULATION
Effect of SGCC on Detected Crack Population
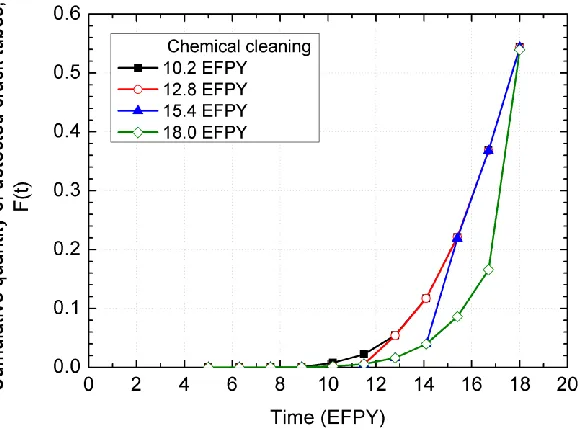
Figure 8 shows the cumulative number of cracks detected according to the time of SGCC. The POD is improved after SGCC, thus the number of detected cracks is increased markedly at the post SGCC inspection. Figure 9 shows the cumulative depth distribution of in-service cracks at the time SGCC. Figure 10 shows the cumulative depth distribution of detected cracks at the time SGCC. There is small variation among the POD curves.
24th Conference on Structural Mechanics in Reactor Technology
BEXCO, Busan, Korea - August 20-25, 2017 Division VIII
Figure 7. POD functions before/after chemical cleaning
Figure 9. Cumulative number of initiated (in-service) crack depth
24th Conference on Structural Mechanics in Reactor Technology
BEXCO, Busan, Korea - August 20-25, 2017 Division VIII
CONCLUSIONS
Generally, the number of cracks detected after SGCC increases significantly. In this study, Monte Carlo simulation is performed to understand these phenomena. SGCC can improve the performance of the eddy current inspection. The probability of detection of crack is enhanced substantially after SGCC. After SGCC, however, a large number of sallow cracks can be detected. This phenomenon increases with SGCC time delay.
REFERENCES
Chung, H et al. (2013). “A review on the ODSCC of steam generator tubes in Korean NPPs,” Nuclear
Engineering and Technology, 45 513-000.
Chung, H et al. (2014). “Swallow cracks masked undetected by sludge deposit at nuclear steam generator tubes,” Proc., International Corrosion Conference, Jeju, Korea.
EPRI (2009). Pressurized Water Reactor Secondary Water Chemistry Guidelines, Revision 7, Electric Power Research Institute.
EPRI (2007). Pressurized Water Reactor Hideout Return Sourcebook Prediction of Crevice Solution
Chemistry in PWR Steam Generators, Electric Power Research Institute.
Intertek AIM (2014). Operational Assessment for the Hanbit Unit 4 Steam Generators for Axial ODSCC
at Eggcrate Tube Supports Based on KHNP Eddy Current Examination Data for End of Cycle 14,
Intertek AIM.
EPRI (2016). Steam Generator Management Program: Steam Generator Integrity Assessment Guidelines,