GHIASI GHORVEH, MOHSEN. Does Street Quality Affect Transit Users’ Route Choice?
(Under the direction of Professor Robin C. Moore).
As a contribution to counteract the reduction of adult physical activity, and to better understand pedestrians’ preferences for streetscape quality, this investigation examined the micro‐spatial attributes of routes that may attract a commuting pedestrian to choose one route over another. Route choice is a novel methodology that reduces self‐selection bias and provides variations in settings. Until now, studies of the association between street attributes and route choice have produced mixed results. Some suggest that walkers consider the shortest path to minimize distance or walking time. Other studies found route quality to be a predictor of route choice. However, no studies have been identified that included both physical features and perception.
To achieve an explicit transaction between environmental attributes and walking behavior, three studies were conducted. The first study examined the relationship between route choices and streets design characteristics. The Walkability Index was used to randomly select four light rail stations in Charlotte, NC. Fifty‐one transit users were recruited to identify their actual walking routes. To generate route alternatives not picked, the ‐shortest path algorithm produced 112 alternative routes. Objective environmental data were gathered by using the Pedestrian Environmental Data Scan audit tool at the street‐segment level. Results of a conditional logistic regression across routes chosen and not chosen confirmed that distance is a dominant attribute of routes. However, sloping terrain was negatively associated and crossing aids (traffic control devices and pedestrian facilities to cross streets) were positively associated with route choice. Similarly, number of trees and sidewalk width were positively associated with route choice. Results suggest that pedestrians in the sample area were willing to walk 562.7 feet (171.5 meters or about 3 minutes walking time) ‐ longer if the sidewalk had more trees and shade. Furthermore, the coefficient of slope indicated that the odds of not being selected for a slight and steep route was 6‐times higher than for flat routes. Furthermore, pedestrians were willing to walk 302.8 feet (92.3 meters or 1.5 minutes) more if the route was flat.
factors: route safety and sidewalk safety. Route slope, number of turns, and average amount of greenery along routes were correlated with route attractiveness.
The third study compared the number of times segments were walked by participants. The number of pedestrians along a route was estimated using Urban Network Analysis. The findings of a conditional Poisson regression confirm, however, that segment distance is significantly associated with segment frequency of use. Furthermore, sidewalk width is a salient variable and positively correlated with the dependent variable, segment frequency of use. The results also reveal that for a one‐unit increase in sidewalk width among segments, the estimated number of segment use may increase 58%. For segments with crossing aid facilities, the increase may be 42%. Moreover, by controlling for spatial autocorrelation between segments, results of a conditional logistic regression show that transit users prefer to use segments with less slope, higher number of crossing aids, and fewer number of three and four‐way intersections in walking from origin (home/workplace) to light rail stations.
Taken together, the study results suggest that an increase in streetscape quality and provision of stimulating street segments and routes may affect pedestrian walking experience and thereby encourage pedestrians to walk farther, to trade‐off increased distance for improved street qualities.
by
Mohsen Ghiasi Ghorveh
A dissertation submitted to the Graduate Faculty of
North Carolina State University
in partial fulfillment of the
requirements for the degree of
Doctor of Philosophy
Design
Raleigh, North Carolina
2017
APPROVED BY:
_______________________________
_______________________________
Prof. Robin Moore
Dr. Douglas Gillan
Chair of the Advisory Committee
_______________________________
_______________________________
Dr. Robin Abrams
Dr. Daniel Rodriguez
DEDICATION
To my love and my beloved parents;
Without their support, encouragement and love none of this would be possible.
BIOGRAPHY
Mohsen was born in 1978 in Karaj, Iran. He received his Diploma in Architecture in 2003 and his master’s degree in Urban Design from Iran University of Science and Technology in 2007. He worked more than a decade in design practice and the construction site, which afforded him the opportunity to be involved in designing, building, and coordinating various award‐winning projects ranging from residential to public buildings, and street design to master and detailed plans. In the fall semester of 2012, Mohsen returned to the graduate school and joined the Ph.D. in Design program in the College of Design at North Carolina State University. During his studies, Mohsen pursued academic, pedagogical and professional experiences that enhanced his understanding of built environment and developed his design, planning and analytical skills.
After joining the doctoral program as a research assistant, design associate, geospatial and data analyst in the Natural Learning Initiative (NLI), he was involved in research and design projects on children’s outdoor activities and preventing obesity by design. In 2013, he was a summer intern with the City of Raleigh, Urban Design Center where he prepared the Raleigh Parklet Feasibility Study report and collaborated in Raleigh‐Durham Light Rail Project.
During his graduate training, Mohsen’s coursework has covered a wide range of topics in urban design, urban planning, statistic, and GIS. In addition to the numerous courses that he took at NC State, he took and audited planning courses at the University of North Carolina (UNC) at Chapel Hill, Department of City and Regional Planning. He also earned his Minor in Geographic Information System (GIS) from the Center for Geospatial Analytics at NC State. Moreover, he has presented his dissertation research at several conferences such as UAA, ALR, EDRA, CELA.
ACKNOWLEDGMENTS
I would like to express my sincere appreciation to my doctoral committee members, Dr. Robin Abrams, Dr. Perver Baran, Dr. Douglas Gillan, and Dr. Daniel Rodriguez for their extremely insightful comments, assistance, and willingness to spare their valuable time for ongoing meetings and to review my doctoral research and dissertation. Professor Robin Moore, my committee chair, has always been extraordinarily helpful and understanding during every step of the investigation and preparation of the dissertation document. I am thoroughly grateful for his intellectual insights and being understanding.
I would like to express my gratitude to Dr. Nikhil Kaza and Dr. William Rohe at UNC Department of City and Regional Planning for their advices and supports. I would like to extend my thanks to Dr. Celen Pasalar and Professor Art Rice for their trust and encouragement at the very beginning of my Ph.D. I want to express my special thanks to Mr. Reza Amindarbari, my colleague, who has always been there to support and encourage me in every step of my research. I am also thankful to my fellow members in PhD in design program, Dr. Ahoo Malekafzali, Dr. Ece Altinbasak, Dr. George Hallowell, Dr. Robby Layton, Dr. Nooshafrin Mohamdzadeh, Dr. Ozlem Demir, Dr. Nasim Mirian, Dr. Andres Tellez, Mr. Payam Tabrizian, Mrs. Atieh Ameri, Mrs. Simin Imanirad, Mr. Sahand Azarby, Mr. Ehsan Sheikholharam, Mr. Saeed Ahmadi, and finally my dear friends, Dr. Peiman Shahbeigi Roodposhti, Dr. Ali Mobalegh, Dr. Mehran Eslaminia, Mr. Ali Behseresht, Mr. Misagh Falahi, Dr. Ali Abedini, Dr. Mohammad Sabouri, Dr. Shoeyb Ziaee, Dr. Arya Shafieefarhoud, Dr. Arash Dehghan, Dr. Morteza Ashouri, Mrs. Afsoon Kangarlou, Mrs. Ladan Ghahramani, Mr. Amin Masoudi, Mr. Sasan Salem, Mrs. Afsaneh Mokhtari, Mr. Reza Ahrabian, and Mrs. Shooka Minouee.
It also has been a pleasure to work with the Natural Learning Initiative (NLI), and it provided me the opportunity to collaborate with so many knowledgeable people. My sincere gratitude goes to NLI family for providing such a friendly and pleasant atmosphere.
TABLE OF CONTENTS
LIST OF TABLES ... ix
LIST OF FIGURES ... xi
CHAPTER 1: INTRODUCTION ... 1
1. FACTS ABOUT LIFE STYLE AND HEALTH IN THE U.S. ... 1
2. INFLUENCE OF BUILT ENVIRONMENT ON ROUTE CHOICE ... 2
3. RESEARCH PURPOSE ... 4
CHAPTER 2: RESEARCH OVERVIEW ... 5
1. CONCEPTUAL FRAMEWORK AND RESEARCH QUESTIONS ... 5
1.1. SOCIAL ECOLOGICAL MODEL ... 5
1.2. CONCEPTUAL FRAMEWORK ... 10
1.3. RESEARCH QUESTIONS ... 12
2. RESEARCH DESIGN ... 13
2.1. CASE‐CONTROL METHODOLOGY ... 13
2.2. RESEARCH SITE ... 13
2.3. RESEARCH PARTICIPANTS ... 14
3. DEFINITION OF TERMS ... 15
CHAPTER 3: EXAMINING THE ASSOCIATION BETWEEN MICRO‐SPATIAL ATTRIBUTES OF STREETS WITH ROUTE CHOICE (ARTICLE 1) ... 16
1. ABSTRACT ... 16
2. INTRODUCTION ... 17
2.1. ROUTE CHOICE ... 17
3. LITERATURE REVIEW ... 18
3.1. BUILT ENVIRONMENT ... 18
4. RESEARCH DESIGN ... 33
4.1. SITE SELECTION ... 34
4.2. PARTICIPANT SELECTION ... 38
4.3. BUILT ENVIRONMENT AUDIT... 44
5. GENERATING CHOICE‐SET ... 52
5.1. CHOICE MODELING APPROACHES ... 54
6. STATISTICAL METHODS ... 67
7. RESULTS ... 69
7.1. DESCRIPTIVE STATISTICS ... 69
7.2. T‐TEST ... 77
7.3. CONDITIONAL LOGISTIC REGRESSION ... 78
7.4. DISCUSSION ... 81
8. CONCLUSION ... 87
CHAPTER 4: EXAMINING THE ASSOCIATION BETWEEN MICRO‐SPATIAL ATTRIBUTES OF STREETS WITH TRANSIT USERS’ PERCEPTION (ARTICLE 2)... 88
1. ABSTRACT ... 88
2. INTRODUCTION ... 88
3. LITERATURE REVIEW ... 89
3.1. PEDESTRIAN PERCEPTION ... 89
3.2. PERCEPTION AND ROUTE CHOICE ... 93
3.3. PERCEPTUAL SCHEMA AND AFFORDANCE ... 94
4. METHOD ... 96
4.1. SURVEY INSTRUMENT ... 96
4.2. PARTICIPANT SELECTION ... 97
5. STATISTICAL METHODS ... 100
6. RESULTS ... 100
6.1. DESCRIPTIVE STATISTICS: ... 100
6.2. CONTINGENCY ANALYSES: ... 110
6.3. ONEWAY ANOVA ... 111
6.4. FATOR ANALYSIS AND PRINCIPAL COMPONENET ANALYSIS: ... 115
6.5. DISCUSSION ... 119
7. CONCLUSION ... 125
CHAPTER 5: EXAMINING THE ASSOCIATION OF STREET SEGMENTS’ ATTRIBUTES WITH SEGMENT DETERMINING CHOICE (ARTICLE 3) ... 126
1. ABSTRACT ... 126
3. LITERATURE REVIEW ... 127
3.1. COMPARE: SIMILARITIES AND CONTRASTS ... 128
3.2. Advantageous and Disadvantageous of Measures Relevance for Policy and Practice ... 132
4. METHODS ... 134
4.1. RESEARCH DESIGN ... 134
4.2. BUILT ENVIRONMNET VARIABLES ... 134
4.3. BETWEENNESS VALUE: ... 136
5. STATISTICAL METHODS ... 139
6. RESULTS: ... 143
6.1. DESCRIPTIVE STATISTIC ... 143
6.2. T‐TEST ... 147
6.3. SPATIAL AUTOCORRELATION ... 149
6.4. CONDITIONAL POISSON REGRESSION ... 152
6.5. CONDITIONAL LOGISTIC REGRESSION ... 155
6.6. DISCUSSION ... 159
7. CONCLUSION ... 164
CHAPTER 6: SUMMARY OF FINDINGS/IMPLICATIONS ... 165
CHAPTER 7: FUTURE RESEARCH ... 170
REFERENCES ... 171
APPENDICES ... 183
Appendix A. Notice/Consent Form ... 183
Appendix B. Sample of A Taken Route ... 184
Appendix C. Pedestrian Environmental Data Scan Tool (PEDS) ... 185
Appendix D. Code for R to Compute the Conditional Logistic Regression Model ... 186
Appendix E. Online Survey Instrument: Street Design and Route Choice ... 187
LIST OF TABLES
CHAPTER 3: EXAMINING THE ASSOCIATION BETWEEN MICRO‐SPATIAL ATTRIBUTES OF STREETS
WITH ROUTE CHOICE (ARTICLE 1)……….……..……….… 16
Table 3.1: Built Environment 5D Framework Variables of Interest, Review of Prior Studies ... 25
Table 3.2. The Built Environment Variables Based on Pikora et al. (2006) ... 26
Table 3.3. Meso‐ and Micro‐Variables of Interest Related to Path Determination ... 32
Table 3.4: Walkability Index ... 37
Table 3.5. Computing Walkability Index for All 15 Light Rail Stations in Charlotte, NC ... 38
Table 3.6. Comparison of Audit Tools ... 50
Table 3.7. Transforming Segment Level Data to Route‐Level: Weighted Length ... 51
Table 3.8. Transforming segment level Data to Route‐Level: Difference Technique ... 51
Table 3.9. Built Environment Factors ... 52
Table 3.10. Built Environment Variables ... 53
Table 3.11. Label Attributes and Impedance Function Utilized by Ben‐Akiva et al. (1984) ... 61
Table 3.12. Demographic Descriptive Statistics (N=51) ... 70
Table 3.13. Demographic Descriptive Statistics Based on the Age Groups (N=51) ... 71
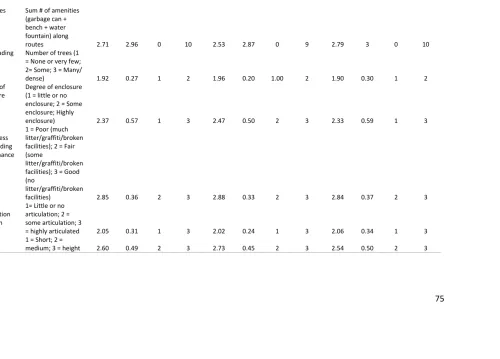
Table 3.14. Built Environment Descriptive Statistics (N=163) ... 73
Table 3.15: Descriptive Statistics of Route Distance in Taken Routes (N=51)... 72
Table 3.16. T‐test Analysis Results Between the Characteristics of Routes in Taken and Non‐ ... 77
Table 3.17. Bivariate Analysis of Built Environment Attributes with Route Choice (N=163) ... 80
Table 3.18. Association Between Built Environment Attributes and Route Choice, Conditional ... 81
Table 3.19. Association Between Built Environment Attributes and Route Choice, Binomial ... 81
CHAPTER 4: EXAMINING THE ASSOCIATION BETWEEN MICRO‐SPATIAL ATTRIBUTES OF STREETS WITH TRANSIT USERS’ PERCEPTION (ARTICLE 2)……… 88
Table 4.1. Summary of Survey Instrument ... 98
Table 4.2. Socio‐Demographic Descriptive Statistics (N=51) ... 101
Table 4.3. Hours of Using Light Rail During Hours of Weekdays and Weekends ... 104
Table 4.4. Purpose of Daily Trip (N=51) ... 105
Table 4.5. Purpose of Daily Trip in Rush Hours on Weekdays ... 105
Table 4.6. Participants’ House Status ... 106
Table 4.8. Participants’ Motivation for Moving to Neighborhood and House Type ... 106
Table 4.9. Participants’ Motivation for Moving to Neighborhood and Number of Vehicles ... 106
Table 4.10. Descriptive Analysis of Perceived Walking Time and Enjoying Walking Time ... 106
Table 4.11. I chose This Route Because There Are the Following Businesses and Facilities Along ... 109
Table 4.12. Amenities Provide Along the Routes ... 109
Table 4.13: Descriptive Statistics of Aesthetic Variables (N=51) ... 109
Table 4.14. Descriptive Statistics of Feeling Safety (N=51) ... 110
Table 4.15. Descriptive Statistics of Non‐Taken Routes ... 114
Table 4.16. Contingency Analysis Between Perceived Time and Perceived Distance (N=51) ... 112
Table 4.17. Contingency Analysis Between Perceived Distance and Attributes about the Width .... 113
Table 4.18. Perceived vs. Actutal Shortest Path ... 114
Table 4.19. Association Between Built Environment Attributes and Pedestrians’ Perception ... 120
Table 4.20. Association Between Built Environment Attributes and Pedestrians’ Perception ... 122
CHAPTER 5: EXAMINING THE ASSOCIATION OF STREET SEGMENTS’ ATTRIBUTES WITH SEGMENT DETERMINING CHOICE (ARTICLE 3)………..……… 126
Table 5.1: Similarities and Contrasts of Both Research ... 132
Table 5.2. The Specific Measure and the Street‐Level Features of Each Study ... 133
Table 5.3. Built Environment Factors ... 136
Table 5.4. Built Environment Variables ... 137
Table 5.5. Built Environment Descriptive Statistics (N=684) (1) ... 145
Table 5.6. Built Environment Descriptive Statistics (N=684) (2) ... 146
Table 5.7. T‐Test Analysis Results Between the Characteristics of Chosen and Non‐Chosen ... 148
Table 5.8. Frequency Response Variable Morans’I ... 150
Table 5.9. Association Between Built Environment Attributes and Segment Choice, Spatial ... 152
Table 5.10: Individual Association Between Built Environment Attributes and Segment ... 153
Table 5.11. Association Between Built Environment Attributes and Segment Frequency of Use, .... 154
Table 5.12. Association Between Built Environment Attributes and First Segment Choice ... 157
Table 5.13. Association Between Built Environment Attributes and Second or Third Segment ... 158
Table 5.14. Association Between Built Environment Attributes and First Segment Choice ... 158
LIST OF FIGURES
CHAPTER2: RESEARCH OVERVIEW……….………..……….….…5
Figure 2.1: Health Eduation Quarterly Model ... 9
Figure 2.2. Conceptual Framework ... 11
CHAPTER 3: EXAMINING THE ASSOCIATION BETWEEN MICRO‐SPATIAL ATTRIBUTES OF STREETS WITH ROUTE CHOICE (ARTICLE 1)……….……..……….… 16
Figure 3.1: Literature Structure ... 19
Figure 3.2: Conceptualizing Built Environment In 5Ds ... 20
Figure 3.3. Conceptual Framework ... 34
Figure 3.4. Walkability Index Measure ... 39
Figure 3.5. 7th Station Land Use Diversity ... 40
Figure 3.6. 3rd/Convention Station Land Use Diversity ... 41
Figure 3.7. Carson Station Land Use Diversity ... 42
Figure 3.8. East‐West Station Land Use Diversity ... 43
Figure 3.9. Different Methods of Generating Choice Set in Discrete Choice Modeling Framework ... 55
Figure 3.10. Choice‐Set of the Taken and Non‐Taken (Alternative) Routes ... 68
Figure 3.11: Two Sample T‐Test ... 78
CHAPTER 4: EXAMINING THE ASSOCIATION BETWEEN MICRO‐SPATIAL ATTRIBUTES OF STREETS WITH TRANSIT USERS’ PERCEPTION (ARTICLE 2)……… 88
Figure 4.1. Conceptual Framework ... 99
Figure 4.2. Mean BMI vs. Gender ... 103
Figure 4.3. Age Group vs. Enjoying Walking and the Feeling about 10 Minutes Walking ... 103
Figure 4.4. Hours of Using Light Rail During Hours of Weekdays and Weekends ... 104
Figure 4.5. Contingency Analysis of Walking Minutes to Light Rail (Perceived Time) and “I ... 112
Figure 4.6. Contingency Analysis Between Perceived Distance and Attributes about ... 113
Figure 4.7. Perceived Vs. Actual Shortest Path: Contingency Analysis ... 114
Figure 4.8. Prediction Profiler: Dif. Length vs. Non‐Taken Route: “There Are Shorter ... 116
Figure 4.9. Prediction Profiler: Dif. Length vs. Non‐Taken Route: “There Are Shorter ... 116
Figure 4.11. Prediction Profiler: Dif. # of Turn vs. Non‐Taken Route: “There Are Shorter ... 117
CHAPTER 5: EXAMINING THE ASSOCIATION OF STREET SEGMENTS’ ATTRIBUTES WITH SEGMENT DETERMINING CHOICE (ARTICLE 3)………..……… 126
Figure 5.1. Conceptual Framework ... 135
Figure 5.2. The Population Weighted Betweenness Value in One‐Mile Network Service Area ... 140
Figure 5.3. The Number of Employee Weighted Betweenness Value in One‐Mile Network ... 141
Figure 5.4. Poisson Distribution for the Frequency of Use as Dependent Variable ... 142
Figure 5.5. Two Sample T‐test Result ... 148
Figure 5.6. Frequency Use Response, Morans’ I ... 150
Figure 5.7. Lag Residual ... 151
Figure 5.8. Computing P‐Value ... 151
CHAPTER 1: INTRODUCTION
1.
FACTS ABOUT LIFE STYLE AND HEALTH IN THE U.S.
To better understand the association between walking and health, this study reviews the current evidences about the impact of American lifestyle on health. The sprawl structures and separated land uses of American cities have led the people to an automobile‐based lifestyle. Using cars for daily commuting and lack of physical activity have contributed in increasing obesity among Americans in recent years. However, the surprising findings of McGinnis and Foege (1993) and Mokdad et al. (2004) uncover that, the leading etiologies of mortality in 1990 and 2000 in US., rather than the organ failures (e.g., cancer, heart disease, stroke), are a set of behaviors that contribute to the development of diseases such as tobacco use, poor diet, physical activity, and alcohol consumption. The CDC (2010) facts demonstrate that more than one‐third of adults in U.S (35.7%) and approximately 17% (or 12.5 million) of children and adolescents (2‐19 aged) are obese. Also, findings show that boys and men over 12 years are less obese than girls and women. The results of self‐reported obesity among U.S adults, Behavioral Risk Factor Surveillance System‐BRFSS, in twenty years (from 1990 to 2010) disclose a massive increase in obesity around the nation. In a decade from 1990 to 2000, the obesity percentage of 10‐14%, has risen to 20%. Meanwhile, the greatest increase happened in South Atlantic region includes North Carolina (NC) that experienced 67.2% increase, between 1991‐1998, in the percentage of the overweight individuals (Mokdad et al., 1999). In 2010, the rate of obesity increased to more than 30% around the nation. However, these results depict a growth trend in the whole country, the eastern and southeastern states present higher rates of obesity. Many studies have proven the impact of obesity on heart disease. According to CDC (2014) evidence, 735,000 Americans (1 of 434 individuals) have a heart attack every year and 23.5% (614,348 or 1 in 4 individuals) of all deaths in the US. today are caused by heart diseases.
physical activity is associated with mitigation of depressive symptoms on people with depression; it improves cognitive functioning and helps emotional well‐being such as stress and anxiety reduction, and social interaction expansion.
2.
INFLUENCE OF BUILT ENVIRONMENT ON ROUTE CHOICE
To explore the relationship between walking and the urban environment, this study examines the association between built environment attributes in street level and pedestrians’ walking behavior in selecting their daily route. The National Household Transportation Survey (2010) report shows an increase of 3.2% (7.2% to 10.4%) in the percentage of both purposeful and recreational walking as a trip mode between 1990 to 2009. The results confirm that the rate of walking thanks to the increasing the number of new urbanist and neo‐traditional neighborhood, and their certain design features such as high density and proximity to primary activities and facilities like the grocery store is slowly increasing (Ewing and Cervero, 2010). The findings of a research by Rodriguez et al. (2006) divulge that the total number of walking and cycling trips in new urbanism neighborhood is 2.4 times higher than conventional communities.
Results of the National Bicycling and Walking Study, FHWA Case Study No.9. report (1992) indicate 53% of Americans live in the areas with maximum 2 miles to public transit stops. These numbers unfold an opportunity for changing the trip mode choice of individuals who live within walking distance of transit stops. Encouraging these groups of people to walk to stations is a critical point in accessibility and increasing physical activity, and reducing obesity. In reflecting this necessity, it is more than a decade that Transit Oriented Developments (TODs) have been a part of U.S. planning lexicon. TOD neighborhoods are a new tool to rectify the sprawl vicissitudes by focusing on transportation and dropping car dependency (Cervero & Sullivan, 2011a, 2011b). Besides, TODs emphasize on mixed‐use land and non‐motorized access to make livable neighborhoods.
shortcomings of the pre‐existing dataset, which captures micro‐level urban design and environmental design factors such as the presence of trees, the presence of crossing aids devices, sidewalks’ width, sidewalks’ material and condition, the street level studies were less paid attention (Weinstein Agrawal et al., 2008). Thus, current assessment methods either overlook the quantification of the utility of environmental features or rely on pedestrians’ subjective preferences (Rodriguez et al., 2014).
Litman (2012) points out that a paradigm shift in transportation planning is occurring, and accessibility‐based evaluation that focuses on the ability to access to services, places, and activities is a surrogate for mobility‐oriented evaluation, which evaluates transport system performance based on quantity and quality of physical travel. This context wants to consider the street segments as the unit of analysis for accessibility‐based evaluation because “the path‐based measure is sensitive enough to capture minor differences in the environment experienced by pedestrians” (Guo, 2009, p. 343).
To study the relationship between the micro‐level spatial attributes and pedestrians’ walking behavior, this study considers the pedestrian route choice as the dependent variable. Route choice examines the transit users’ decisions over multiple route options between the same origins and destinations. Route choice in definition is the “process of selection [a path] among alternative paths, on which the travel time is random.” (Sheffi, 1985, p. 262). Bovy and Stern (1990, p. 123) also describe route choice as “a matter of choosing from a set of known routes: the choice process is conditional on a given set of route opportunities. The active traveler chooses his route on familiar territory.” These definitions direct this research to utilize a case control strategy, in which the cases are the routes taken and those not taken are controls.
3.
RESEARCH PURPOSE
The focus of this study is on micro‐level features of street segments to examine how the street qualities are associated with transit users’ preferences in determining the choice of routes. The findings help policy makers, practitioners, planners, and designers to better understand how the micro‐environmental features influence on pedestrians’ perception, and how they select a route over its possible alternatives. In this respect, three studies were conducted. The general research question is: why some routes/segments are taken and preferred by transit users over their alternatives? This question leads the following studies to inspect the association of micro‐spatial attributes of streets ‐ in two levels of routes and segments – with pedestrian route choice, considering perception as mediator. The theory of ecological psychology is employed as the theoretical framework to explain the behavior of decision makers based on the receiving stimuli of the built environment in the micro‐ level.
Utilizing route choice as a promising methodology reflects the impacts of pedestrian environmental factors that facilitate or prevent pedestrians’ propensity to walk. This understanding will be obtained through a strategy that collects the subjectively stated preferences of transit users about the selected routes and compares the findings with the results of the objectively audited environmental factors in both selected and non‐selected (alternative) routes.
To collect data, the research gathered both subjective and objective primary data. In addition, the number of pedestrians in each single street segment estimated using the Urban Network Analysis toolbox in GIS.
CHAPTER 2: RESEARCH OVERVIEW
1. CONCEPTUAL FRAMEWORK AND RESEARCH QUESTIONS
1.1. SOCIAL ECOLOGICAL MODEL
This study is developed based on the social ecological model (SEM). Environment, in this model, is conceptualized as a multi‐layered framework that influences on individuals in two levels of intra and extra‐personal. The former are individual factors related to behavior modification such as beliefs, attitudes, and motivations; and the latter are external factors to the individuals, such as physical and social environments. So, the environment influence on individual behavior, directly and indirectly, mediated by cognitions and perceptions. To date, the direct effect of environment on behavior has examined using deterministic models of location – that is, theories of attraction based on the assumption that individuals aim to optimize their spatial behavior by minimizing distances in pursuit of any activit (Sallis, 2008).
The focus of this theoretical framework ‐which advanced by Edison Trickett and Rudolf Moos‐ is, understanding the role of environment in relation to behavior. Schneider and Stokols (2009, p. 90) mention that “social ecology is a meta‐theoretical perspective that encompasses several interrelated themes and research strategies…namely contextualist, system‐oriented, interdisciplinary, multilevel action research analyses incorporating both qualitative and quantitative research methods and a variety of experimental and nonexperimental research design.” This definition clarifies three main assumptions of this theory; first, it emphasizes on considering the transaction between physical and social environment with targeted population; second, it is derived from system theory with environment‐people interaction characterized by mutual influence (Bronfenbrenner, 1979); third, Interaction among factors within multiple levels are a function of SEM as well.
1‐ The SEM posits that there is an interaction among variables in multiple analytic levels, from micro to macro level. This multiplicative characteristic (Schneider & Stokols, 2009) is an impetus to examine the magnitude of each single variable’s effect on health and behavior heath.
2‐ The SEM emphasizes on the role of both social attributes and environmental conditions influences, subjective versus objective qualities of built and natural environment, on individuals or groups health status. In a proximal distance, independent attributes of environments are relevant (e.g., space arrangement, spatial configuration, lighting, and noise); In addition, characters of behavior settings and social climate may influence on these attributes as well (Barker, 1968) cf. (Schneider & Stokols, 2009).
3‐ The SEM assumes that individuals create settings and settings also create individuals (Glass & McAtee, 2006). To put other words, there is a dynamic interaction between people and environments’ dwellers and an inetrdependency between micro settings like home or workplace and other distal environments like school and workplace. Therefore, the environmental conditions (i.e., both physical and social attributes of settings) directly influence on well‐being. Mutually, the actions of individuals or groups are influential in the healthfulness of their surrounding environments.
4‐ The SEM is a system that all the features within the multiple levels of the system (i.e., micro‐, meso‐, exo‐, and micro‐) facilitate and inhibit the individuals’ health behavior. To a large extent, the peoples’ behavior is determined by social and environmental context (Schneider & Stokols, 2009); For instance, due to environmental qualities that do not support active living, the rate of physical activity in recent decades has been reduced and contributed to increase obesity among Americans (Rodriguez et al., 2006). The environmental obstacles reveal a partial power of choice among individuals for modifying their unhealthy behavior.
5‐ The SEM emphasizes on individuals’ attributes and differences. In addition to environmental qualities, a broad range of responses to physical and social environmental conditions stem from the individuals’ biogenetic. In this theoretical model, the persons’ attributes such as health status, personality, cognition, and physiology mediate the influence of contextual factors on individuals’ behavior and health behavior.
one behavior may change or facilitate in alteration of another behavior. Kreuter et al. (1999) mention that however, “one‐size‐fits‐all” approach, which is a static approach to influence behavior change such as brochures, booklets, or pamphlets as printed health education materials, might be an appropriate and consequence to small changes, it cannot be the origins for large changes because it cannot address the unique needs, interests, and concerns of different individuals.
To better understanding the etiologies of public health problems, currently, it is widely approved among scholars to use a multi‐level analysis to study a wide broad of factors from genetic and molecular to behavioral, environmental and social levels (McLeroy, et. al., 1988; Schneider & Stokols, 2009; Stokols, 1992). The environmental contexts of health are multi‐layered, including both objective and subjective features of built and natural settings. It also is distributed across different levels of geographic scale.
The environmental influences on health and health behavior are found both in the immediate, micro‐ level settings of everyday life and in a more distal, in meso and macro‐level conditions.
Macro‐level conditions that are pervasive in one’s community; e.g., levels of unemployment, social capital, laws and policies in societies, and income disparities within a particular society.
Meso‐level setting of life; e.g., one’s neighborhood.
Micro‐level setting of everyday life; e.g., one’s home or workplace.
prevalence of hypertension than residents of compact counties. It also indicates that at the metropolitan level, sprawl was associated with minutes walked (p = .04) but not with the other variables. In another study, Frank et al. (2007) found a positive association between objectively measured urban form variables (i.e., residential density, intersection density, land use mix, commercial, and open space within 1‐kilometer network service around residences) with age and youth walking. Moreover, by utilizing the 2000 San Francisco Bay Area Transportation Survey (BATS), Guo et al (2010) found that bikeway density, street network connectivity, and business density are correlated with the frequency of non‐motorized trip for all individuals with maintenance purposes; the first two factors also have the potential to rise the non‐motorized trip frequency particularly among low households’ income and to persons above 30 years of age with discretionary purposes.
Meso‐Level: To study the association or influence of built environment on health, current studies use neighborhoods as their context. The research on physical neighborhood quality and health examine land use, density, street connectivity, transportation, infrastructure, access to green space, public and open space, and safety. Neighborhoods are in the spotlight of the recent interest in investigating the health effects because, first, neighborhoods possess both physical (objective data) and social attributes (subjective data). Second, neighborhoods reflect the socioeconomic status and also race/ethnicity of residents; thus, neighborhoods’ characteristics, which are patterned by these social positions, are significant contributors to health. Third, as well as social views, communities reflect the non‐health policies ‐ like housing policy or urban planning and policy ‐ that may impact on health through their impact on the contexts of habitats and workplaces. Fourth, neighborhoods are suited for the study of new perspectives such as multi‐level analysis, and new tools and techniques such as using GIS and spatial analysis techniques (Diez‐Roux, 2007).
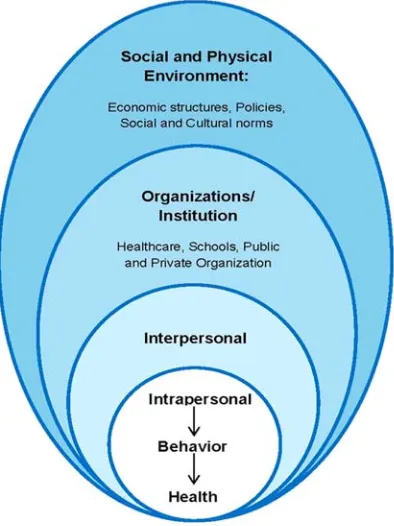
To sum up, the focus of Social Ecological Model is on understanding the role of environment in the connection and interdependence between individuals and their surroundings because cultural, social, political, and surrounding environment influence on individual’s decision and behavior. The SEM assumes that each variable in the model should be examined and the magnitude of its partial effect on behavior change will be compared with other variables. In this regard, contextual influences on health behavior contain both features of built and natural environments. The socio‐ecological as an adopted version of the ecological model in health, defines four interactive level of health‐related behavior: intrapersonal, interpersonal, institutional/ organizational/ community, and public policy (Figure 2.1). The influence of these layers on health and wellbeing of individuals happens through both physical and social environments (Stokols, 1992).
1.2. CONCEPTUAL FRAMEWORK
To counteract with the reduction of physical activity and to explore the walkers’ preferences about the streets scape quality, the investigation examined the aspect of commuting. It focused on routes between home to transit station to figure out what are the attributes of route that may attract a commuting pedestrian to choose one route over another?
Figure 2.2 presents the conceptual framework of this study. The outcomes (dependent variables) are adult transit users’ route choice and the frequency of taking segments. The former, decision making, would be a comparison between cases (selected routes = 1) and its controls (non‐selected = 0) in order to detect the variances of micro‐spatial attributes between them. This approach would be the first step of understanding peoples’ preferences in a purposeful walking (i.e., a type of walking with purpose to get to a certain destination). In the next step, those objectively measured variables will be reevaluated by individuals’ perception as well. For the latter dependent variable, the frequency of taken segments, the study compared the number of times the segment was walked or picked by participants in the survey. By observing how these systematic differences affect usage, for a given level of walkability level (medium and high), the research examined how micro‐level built environment attributes are associated with actual walking at various levels of walkability. Also, it revealed similarities and differences of transit users’ favorites in route choice between routes and segments.
The predictors (independent variables) are street segments’ features and urban morphology variables. Variables are structured by 5Ds framework including, Density, Diversity, Design, Destination to accessibility, and Distance to transit (Ewing and Cervero, 2010). In this context, 23 of the design variables in the Pedestrian Environmental Data Scan inventory tool ‐ except the bikeway sections ‐ are measured for each segment. Two additional design variables of average setback and building spacing for all the segments measured in GIS. 5D variables are structured as follow:
Figure 2.2: Conceptual Framework
Destination Accessibility and Distance to Transit: Average betweenness value, route/segment network distance (length), and directness (number of turns).
Density and Diversity: Pedestrian friendly land use, sum three and four‐way intersection, and average crossing aids.
Design: 23 objectively measured variables in the Pedestrian Environmental Data Scan inventory tool, except bikeway section, measured average setbacks, and measured average building spacing.
1.3. RESEARCH QUESTIONS
The general research question of this study is: what attributes of street design explain why/how are some routes/segments taken and not others?
Why some routes/segments are taken and preferred by transit users over their alternatives?
Article 1 (Chapter 3) Research Questions: Exploring the Association Between Route
Choice and Street Design Qualities
RQ 1.1. What is the association between micro‐level spatial features along routes with determining route choice?
RQ 1.2. How pedestrian trade‐off between taking a longer route with other street attributes?
Article 2 (Chapter 4) Research Questions: Exploring the Association Between Route
Choice and Pedestrian Preferences for Street Design Qualities
RQ 1.1. What is the association between micro‐level spatial features along the taken routes with transit users’ perception?
RQ 1.2. Are there any significant differences between taken and non‐taken route in transit users’ perception?
Article 3 (Chapter 5) Reseearch Questions: Exploring the Association Between Street
Segment Choice and Street Design Qualities
RQ 1.1. What is the association between micro‐level spatial features of street segments and the number of times a segment picked or walked?
RQ 1.2. What is the association between micro‐level spatial features of street segments and determining route‐choice?
RQ 1.3. What is the association between micro‐level spatial features of street segments and the first step of determining route‐choice?
RQ 1.5. Is there a significant difference in micro‐level spatial features of street segments that transit user prefers between selecting segments from home or work (origin) to light rail stations (destination) and vice versa in TODs?
2. RESEARCH DESIGN
2.1. CASE‐CONTROL METHODOLOGY
The all three articles are employed cases control or retrospective method. The case‐control studies are a type of observational studies that are prevalent in epidemiologic science and represent a paradigm that proceeds from effect. In a case‐control study, individuals with a particular condition or disease (the cases) are selected to discover factors that may differ with a series of individuals in whom the condition or disease is absent (the controls) (Schlesselman, 1982).
“The case‐control method of investigation is often the research strategy of choice, however, particularly, when initiating an exploratory study of disease etiology or investigating a rare disease” (Schlesselman, 1982, p.16). In this description, there are two crucial points related to this set of studies; first, they point out this is a decent strategy to explore the causes and factors that influence on choice; Second, they indicate that this methodology is useful for exploratory studies. The purpose of exploratory studies is exploring association, and they do not prove causation. Exploratory studies are the type of research, which multiple hypotheses proposed for investigation and finding correlations. The case‐control studies allow many potential factors to be related to the occurrence of a dependent variable. Case‐control studies might find associations by chance; and so, most significant must be attached to the associations, which are strong and help to explain the hypothesis of research (Thrift, 2010). This strategy is adopted to clarify specific correlations among street attributes and determining route choice, and establish the predictive relationship. In this context, cases are the taken routes and the controls are non‐taken routes.
2.2. RESEARCH SITE
cases and controls should be selected from the same population and settings. To fulfill this requirement, this study followed a comprehensive systematic approach.
The researcher intended to conduct the research in two cities of San Diego, CA and Charlotte, NC to increase the variations among the settings in the study. Despite the attendance of the researcher in San Diego, the Metropolitan Transit System (MTS) did not issue the required permissions for collecting data at light rail stations; therefore, this study was conducted just at Charlotte, NC.
To select four TOD neighborhoods, the Walkability Index (Frank et al., 2005) computed within one‐ mile network service area for all 15‐TODs adjacent to LYNX light rail transit stops in Charlotte, NC. Then, all the TODs categorized based on high, medium and low walkable environments by altering the walkability index, from continuous to three quartiles. Grounded on random sampling, two neighborhoods within the high and medium stratum were selected. the site locations
2.3. RESEARCH PARTICIPANTS
To identify participants, 745 notice forms, which include details about the research purpose and online survey questionnaire distributed by the researcher through a convenient sampling in nominated stations in three days from 6‐9 am and 4‐7 pm in September 2015. The early morning hours and late afternoons are selected because the majority of employees use the train to commute between home and workplace in these certain hours. Meanwhile, the researcher asked them to draw their daily taken route on provided maps (attached to the notice form, with the same serial numbers on both notice form and map). As well, the researcher asked them to write down their emails on the sheet map to follow up for the online survey questionnaire. Finally, 76 transit users responded to the online perception survey instrument with the rate of 10.2%. Participants are adult transit users in the age 18‐64, who use light rail as their transportation mode to commute between home or work as origin points and light rail stations as destinations or vice‐versa. Among 76 respondents, two individuals were under age and excluded from analysis.
that shows the taken route (cases) and its alternatives (controls), and the taken segments and their alternatives.
Since this study is about choice, decision‐making, and the role of the environmental factor on decision makers, the routes and segments which did not have any alternatives were eliminated from the study. So, 21 of the identified taken routes were removed from the study. Eventually, for all 51 contributors in the online survey, 163 routes (51 taken and 112 non‐taken), and 684 segments (178 taken and 506 non‐taken) were identified. In the last step of the data collection, the inventory tool of Pedestrian Environmental Data Scan (PEDS) completed for all taken and non‐taken (alternative) segments.
3. DEFINITION OF TERMS
Route Choice: is the process of making a decision to choose a route among a set of alternative routes.
Street Segment: is a link (edge) between two street intersections that connects two points on the street network.
Route (Path): is defined as a set of linear segments between two points of origin and destination.
Shortest Path: is the path between two street intersections with the shortest distance.
Body Mass Index (BMI): is a measure to define overweight and obesity, computed as weight in pounds divided by the square of height in inches, multiplied by 703.
Frequency of Segment Use: is the number of times a street segment is chosen and walked by transit users.
Accessibility: is the distance from home/work as a generator to gain access to nearest light rail station as a destination.
Distance: is a term referring to how far an individual must walk to reach a destination.
CHAPTER 3: EXAMINING THE ASSOCIATION BETWEEN MICRO‐SPATIAL ATTRIBUTES OF
STREETS WITH ROUTE CHOICE (ARTICLE 1)
1.
ABSTRACT
To explore the association between pedestrians’ walking behavior and pedestrian environment, the first study has examined the relationship between route choice and streets design characteristics. To identify context and participants, the walkability index within one‐mile network service area around all 15 stations in Charlotte, NC. was computed. Based on this measure, stations were stratified to three levels of high, medium, and low walkable environment; four transit‐oriented developments (TOD) from high and medium levels randomly selected. Fifty‐one transit users were recruited to identify actual walking routes on the map. To generate route alternatives not picked, the ‐shortest path algorithm was applied in GIS, and produced 112 alternative routes (total 163 routes). Objective data about the environment was gathered by using the Pedestrian Environmental Data Scan inventory tool at the street‐segments level. To analyze data, the conditional logistic model (discrete choice model), binomial logistic regression, and summary statistics across routes chosen and not chosen were performed. Outcomes confirm that distance is a dominant attribute of routes. However, sloping terrain negatively associated and crossing aids (traffic control devices and pedestrian facilities to cross streets) were positively related to route choice. Similarly, number of shade trees and sidewalk width were positively associated with route choice. Results suggest that, pedestrians in the sample area willing to walk 562.7 feet (171.5 meters or about 3 minutes in walking time) longer if the sidewalk has more trees and shades. Furthermore, the coefficient of slope indicates that the odds of not being selected for a slight and steep route is 6‐time higher than the flat routes and pedestrians are willing to walk 302.8 feet (92.3 meters or 1.5 minutes) more if the route is flat. The outcomes recommend, however, route distance is the salient parameter in the route decision making, increasing the quality of street design may encourage pedestrians to walk farther and trade‐off between distance and street qualities.
2.
INTRODUCTION
The concept of choice is present in many dimensions of the pedestrian behavior (Bierlaire and Robin, 2009). These interconnected choice dimensions such as destination choice, mode choice, activity choice, and route choice have been used by scholars for understanding the pedestrian behavior. The choice activity is the process of making a decision (selecting one route among a set of alternatives) economically and perceptually. Choice analysis often takes place at the end of a sequence of a decision making. These decisions are analyzed separately in literatures, in which an individual trip maker at a given origin location has to decide to reach the given destination location. (Bierlaire & Robin, 2009; Bovy & Stern, 1990). Reviewing the literature that studied the relationship between the physical environment and pedestrian travel shows that the majority of studies have been focused on trip mode choice, the frequency of walkers, and destination choice; while there is still a gap in understanding the characteristics of the built environment that influence the determining route choice.
2.1.
ROUTE CHOICE
Prato (2009, p. 67) defines route‐choice as, “the choice of a certain route within a set of alternative routes.” Sheffi (1985, p. 262) describes this concept with a complete explanation, a “process of selection [a path] among alternative paths, on which the travel time is random.” Bovy and Stern (1990, p. 123) define route choice as “a matter of choosing from a set of known routes: the choice process is conditional on a given set of route opportunities. The traveler chooses his route on familiar territory.” These definitions characterize some fundamental concepts of route‐choice as follow:
First, there must be a set of alternatives in a decision‐making process. There are two kinds of choice, individual choice set and collective choice set, which the latter form is “the set of combined alternative available route for a certain group of walkers between the same origin and destination”(Bovy & Stern, 1990, p. 124). This study considers these two forms as a result of choice problem. In the first form, this context attempts to find a logical response to this question that why a travel maker prefers and chooses a route rather than other alternatives? In addition, it utilizes the collective form, of course
Second, the above‐mentioned definitions indicate that travel time should be random. This characteristic makes sense for non‐active travelers such as private drivers in which their goal is arriving at the destination in the shortest time. So, they can experience new roads and as a result, their trip time would be random. But, for pedestrians, the margin of error for travel time will not be significantly different.
Third, familiarity not only is the familiarity of the trip maker with the selected path but also is the maximization of the objective and subjective variables of interest along the routes that can stimulate the pedestrians. These notions are translated to utility and attractiveness for explaining the discrete choice model by Sheffi (1985).
Finally, in urban transportation choice models, two notions of route search and route choice needs to be distinguished from each other. The former, route search, is the attempt of identifying a set of available routes to reach the destination; and the route choice is the process of selecting from the pre‐identified or a given set of options.
3.
LITERATURE REVIEW
To explore the relationship between pedestrian environment and transit users’ behavior regarding choosing their routes, in this section the related pieces of literature to pedestrian route choice will be reviewed. “Two critical characteristics of human wayfinding are destination choice and path selection” (Golledge, 1995, p. 207). This definition leads this section to addresses both these terms through reviewing the literatures. In addition, this section will also discuss two key concepts of built environment and urban morphology that all together impact on route determination. The research also evaluates the notion of TOD neighborhoods as context for conducting the research, and finally, it reviews the necessary tools and instrument for collecting data. Figure 3.1 shows the literature diagram.
3.1.
BUILT ENVIRONMENT
modest as a sidewalk or an in‐neighborhood retail shop or as large as a new town”. Conceptually, built environment has been categorized into three domains of urban planning, urban design, and transportation (Handy et al., 2002; Saelens et al., 2003). In this regard, there are two major approaches of conceptualizing built environment, the 5Ds’ framework and four‐function. The first approach includes Density, Diversity, Design, Destination Accessibility, and Distance to Transit; and the second approach consists of Functional, Safety, Aesthetic, and Destination. These categorizations are presented as follow. Social‐ Cultural Measures Route‐ Choice (Theoretical & Empirical Studies) Theoretical and Empirical Studies Walking Behavior Centrality Measures Approach Destination Accessibility & Distance to Transit Space Syntax Approach Betweenness (Population, Employment, Building) Local Integration Global Integration Connectivity (Bafna, 2003) (Hillier & Hanson, 1984) (Hillier, 2007) (Hillier, 2008) (Hillier, Yang, Turner, 2012) (Ratti, 2004) (Bavelas, 1948) (Freeman, 1977) (Porta, Crucitti, & Latora, 2005) (Sevtsuk, 2010). (Sevtsuk & Mekonnen, 2012). (Porta, Crucitti, & Latora, 2005). Design Attributes Design Average Setbacks Per Route Average Building Spacing Per Route Vacant Lots Sidewalk width / Connectivity (Baran, Rodriguez, & Khattak, 2008) (Cao, 2006) (Cervero & Kockelman, 1997) (Doyle et al, 2006) (Ewing & Handy, 2009) (Handy, 2006) (Khattak & Rodriguez, 2005) (Lee & Moudon, 2006) (Rodriguez et al, 2006) (Rodriguez et al, 2008) (Rodriguez et al, 2006) (Poikora, 2006) ((Saelens et al, 2003) (Saelens, Sallis, & Frank, 2003) Density & Diversity Route Level Variables Route Business Density Average Building Spacing Per Route Vacant Lots/Building (Boarnet et al, 2008) (Brown et al, 2007) (Chatman, 2009) (Cervero & Kockelman, 1997 (Ewing & Cervero, 2001) (Ewing & Cervero, 2010) (Frank, 2006) (Frank et al, 2008) Handy et al, 2002) (Handy et al, 2006) (Khattak & Rodriguez, 2005) (Kitamura et al, 1997) (Rodriguez, & Joo, 2005) (Rodriguez, 2009) (Rodriguez et al, 2009) (Saelens et al, 2003) (Saelens & Handy, 2008) PERCEPTION (Brown, et al, 2007) (Humpel et al, 2004a) (Humpel, et al, 2004b) (Issac, 2001) (Lee et al, 2012) (Smith, 2009) (Zacharias, 2001) (Agrawal et al, 2008) (Brown et al, 2007) (Borst et al, 2009) (Bovy & Stern, 1990) (Borgers & Timmermans, 1993) (Borgers & Timmermans, 2005) (Broach et al, 2010) (Gärling & Gärling, 1988) (Golledge, 1995) (Guhathakurta et al, 2013) (Guo, 2009) (Guo & Wilson, 2011) (Guo & Loo, 2013) (Hagiwara, 2007) (Hill, 1982) (Hine, 1999) (Hoogendoorn & Bovy, 2004) (Rodriguez, 2009, 2014a) (Senevarante & Morall, 1986) ROUTE CHOICE/ NON‐CHOSEN Individual Attributes Socio‐Demographic Status Attitudes and Preferences (Boarnet and Crane, 2001) (Boarnet, et al, 2005) (Cao et al, 2006) (Handy & Clifton, 2001) (Khattak & Rodriguez, 2005) (Litman, 2005) (Rodriguez et al, 2014b) (Ainsworth, Bassett, & Strath,2000). (Brownson et al, 2004) (Clifton, Livi Smith, & Rodriguez,
2007) (Sallis, Saelens et al, 2003) Wa lk in g C o rr ela tes o f Beh av io r Pedestrian Environment Audit Pe de st ri an R o u te ‐Ch o ice
Figure 3.1: Literature Structure
3.1.1. 5Ds Framework
Figure 3.2: Conceptualizing the built environment in 5Ds
This examination proposed four principal components: Density, Diversity, Vehicle Oriented Design, and Walking Oriented Design in which would help in quantifying neighborhood walkability. Finally, Ewing and Cervero (2010) clarified the ‘route’ in two terms of ‘Destination accessibility’ and ‘Distance to transit’. Hence, design, density, and diversity influence walking condition, while destination accessibility and distance to transit impact trip length. Figure 3.2 shows the built environment factors.
Density: Density measures how built environment is compact and always gauges by dividing variables per unit of area. The variables of interest for density are people (e.g., population, employment,) and structures (e.g., building floor area ratio and dwelling units). Regarding density literature related to walkability, Chatman (2009) has investigated the retail job density and population per road mile in California. The retail floor area ratio is another density variable that is tested in Frank et al. (2008) research. Moreover, Boarnet et al. (2008) examined both population and retail job density. The results of a meta‐analysis show that household/population density and job density have the highest value of elasticity in compare to residential density, retail job density, business density, and activity density (population plus employment density) (Ewing and Cervero, 2010). In another word, they have the strongest association with walking in built environment. In relation to transit use, Rodriguez and Joo (2004) investigated the population density, and Frank et al. (2008) examined retail floor area ratio. As well as walking, the highest value is dedicated to household/population density and job density.
Diversity: Diversity measures to what degree different types of uses (e.g., residential, retails, office, open space) are in a certain area. The diversity of land uses, majority of time, is measured by land use mix entropy index (Frank et al., 2008); Regarding to walkability, the following diversity measures have been examined in previous studies: distance to closest grocery and number of business type (Hand et al., 2006); land use dissimilarity, proportion vertical mix, and proportion of population within a quarter mile of store (Cervero & Kockelman, 1997); and distance to nearest park (Kitamura et al., 1997).
Walking is strongly related to the measures of land use diversity, intersection density, and the number of destinations within walking (Ewing & Cervero, 2010; Saelens & Handy, 2008; Saelens, Sallis, & Frank, 2003). Hypothetically and practically, compact environments form high residential and population density with more mix land use. Thus, fewer trips and more accessibility to both local and regional facilities and services will be yielded. Results from a research confirm that higher population density and higher percentage of parcel, which area devoted to retail uses, are highly positively associated with walking to place for adults age 45 to 84 years and the median time of walking for this group of adults was 150 minutes/week, which equals to average of 21.4 min/day (Rodriguez et al., 2009). In term of walk trips and transit use respect to diversity, distance to a store and land use mix (entropy index) have the highest association with walking and using transit (Ewing & Cervero, 2010).