Electronic Theses and Dissertations Theses, Dissertations, and Major Papers
2013
Validated Agent-Based Model using Predictive Data Mining and
Validated Agent-Based Model using Predictive Data Mining and
Intervention Policy Testing Framework: A Case Study in Child
Intervention Policy Testing Framework: A Case Study in Child
Vehicle Safety
Vehicle Safety
Ritwick Gupta University of Windsor
Follow this and additional works at: https://scholar.uwindsor.ca/etd
Recommended Citation Recommended Citation
Gupta, Ritwick, "Validated Agent-Based Model using Predictive Data Mining and Intervention Policy Testing Framework: A Case Study in Child Vehicle Safety" (2013). Electronic Theses and Dissertations. 4872.
https://scholar.uwindsor.ca/etd/4872
Predictive Data Mining and Intervention
Policy Testing Framework: A Case Study
in Child Vehicle Safety
By
Ritwick Gupta
A Thesis
Submitted to the Faculty of Graduate Studies
through School of Computer Science
in Partial Fulfillment of the Requirements for
the Degree of Master of Science
at the University of Windsor
Windsor, Ontario, Canada
2013
Mining and Intervention Policy Testing Framework: A
Case Study in Child Vehicle Safety
By
Ritwick Gupta
APPROVED BY:
______________________________________________ Dr. Christine Thrasher, External reader
School of Nursing
______________________________________________ Dr. Dan Wu, Internal reader
School of Computer Science
______________________________________________ Dr. Robert D. Kent, Co-Advisor
School of Computer Science
______________________________________________ Dr. Ziad Kobti, Co-Advisor
School of Computer Science
______________________________________________ Dr. Subir Bandyopadhyay, Chair of Defence
School of Computer Science
DECLARATION OF PREVIOUS PUBLICATION
This thesis includes one original paper that has been previously accepted for publication in
peer-reviewed conference proceeding, as follows:
Thesis Chapter Publication title Publisher Conference Publication status
Chapter 4,5 Child Vehicle Safety Simulation using Regression analysis and Predictive Data Mining
IOS Press KES-IDT 2013
In Press
I certify that I haven’t transferred the copyright of this work to the publication. I
certify that the above material describes work completed during my registration as
graduate student at the University of Windsor.
I declare that, to the best of my knowledge, my thesis does not infringe upon
anyone’s copyright nor violate any proprietary rights and that any ideas, techniques,
quotations, or any other material from the work of other people included in my thesis,
published or otherwise, are fully acknowledged in accordance with the standard
referencing practices.
I declare that this is a true copy of my thesis, including any final revisions, as
approved by my thesis committee and the Graduate Studies office, and that this thesis has
ABSTRACT
Much work has been done on making and perfecting agent-based
simulations on child safety measures in cars. These simulations, using
algorithms based on social networks, cultural algorithms etc. try and
predict what factors are responsible for the propagation of knowledge
about child safety measures in a given society. One of the biggest factors
being over-looked in these simulations is the validity of the model. In
absence of validation against real data, these models may not be a true
representation of a real world scenario, and the trends predicted though
these simulations are questionable. This paper proposes a system design
using regression analysis and predictive data mining on a survey done in
the field of child safety. Using the result of this data mining process in
the form of a decision tree, we can initialize our agent-based model with
data from the survey and later validate the model comparing the results
to the survey data. Consequently a framework is formed to test different
agent profile based intervention techniques, so that a decision about
selecting an intervention technique with a given cost can be
DEDICATION
Dedicated to
ACKNOWLEDGEMENTS
First and foremost, I am grateful to my advisors Dr. Robert Kent and Dr. Ziad Kobti, who
gave me the opportunity to work in an exciting and challenging field of research. Their
constant motivations, support, innovative ideas, own insight on research and enthusiasm
have guided me toward successful completion of my thesis. My interactions with them
have been of immense help in defining my research goals and in identifying ways to
achieve them.
My sincere gratitude goes to Dr. Christine Thrasher for her valuable advice and
helpful discussions during my thesis research. I would like to thank Dr. Dan Wu for his
valuable comments and suggestions that further helped me in my research.
Finally I would like to thank my parents and my friends for their unconditional
TABLE OF CONTENTS
DECLARATION OF PREVIOUS PUBLICATION ... iii
ABSTRACT ... iv
DEDICATION ...v
ACKNOWLEDGEMENTS ... vi
LIST OF TABLES ... x
LIST OF FIGURES ... xi
CHAPTER 1 INTRODUCTION ...1
1.1 Current Research Motivation ... 2
1.2 Thesis Contribution ... 3
1.3 Thesis Outline ... 4
CHAPTER 2 LITERATURE REVIEW ...6
2.1 Validation in Agent-Based models ... 6
2.1.1 Empirical Validation ... 7
2.1.2 Predictive Validation ... 7
2.1.3 Structural Validation ... 7
2.2 Agent-based Models on Knowledge Flow Patterns and Prediction ... 9
2.2.1 Heterogeneity of Agents ... 10
2.2.2 Structure of Social Network ... 12
2.3 Child safety in Vehicles ... 16
2.4 Agent-based Models on Child Safety in Vehicles ... 19
2.4.1 Effects of Culture ... 19
2.4.2 Effects of Social Influence ... 22
2.4.3 Effects of Reputation ... 23
2.4.4 Predictive Data Mining ... 25
2.5 Domain of Thesis ... 26
3.1 Initialization and Validation of Agent-Based Model ... 28
3.2 Intervention Policy Framework ... 29
CHAPTER 4 CHILD SAFETY SURVEY DATA ANALYSIS ...31
4.1 Data Mining/Pre-processing ... 35
4.1.1 Data Cleaning ... 35
4.1.2 Data Pre-Processing ... 36
4.2 Regression Analysis ... 39
4.3 Decision Tree ... 44
CHAPTER 5 AGENT-BASED MODEL ...47
5.1 Repast ... 47
5.1.1 General Repast Setup ... 48
5.1.2 Repast Setup for AutoSimModel ... 49
5.2 Initialization of Agent parameters/attributes ... 50
5.2.1 Learning Rate ... 50
5.2.2 Knowledge Deterioration Rate ... 51
5.2.3 Driving probability ... 52
5.2.4 Accident Rate ... 52
5.2.5 Reputation ... 52
5.3 Algorithms in the Simulation ... 53
5.3.1 Basic Intervention Framework ... 53
5.3.2 Cultural Algorithm ... 53
5.3.3 Social Network ... 54
5.4 Flow of Simulation ... 55
5.4.1 Algorithm ... 56
5.4.2 Flowchart of Agent-Based Model ... 58
CHAPTER 6 INTERVENTION POLICY FRAMEWORK ...59
6.1 Intervention Policy ... 59
6.2 Brute force Method ... 64
6.3 Genetic Algorithm ... 65
7.1 Agent-Based Model ... 67
7.2 Intervention Policy: Brute Force Method ... 69
7.3 Intervention Policy: Genetic Algorithm ... 74
7.4 Explanation of methodology and results on an abstract level ... 76
CHAPTER 8 CONCLUSION AND FUTURE WORK ...77
REFERENCES/BIBLIOGRAPHY ...80
APPENDICES ...88
Appendix A: Best Intervention Policies (Brute Force Method) ... 88
Appendix B: Best Intervention Policies (Genetic Algorithm) ... 93
VITA AUCTORIS ...97
LIST OF TABLES
Table 4.1 Regression Analysis………43
Table 4.2 Decision Tree for Learning rate of agents………...46
LIST OF FIGURES
Figure 2.1 The S curves of diffusion varying with degree of heterogeneity [13]………...10
Figure 2.2 Different types of networks and threshold [6]………...13
Figure 2.3 Speed of diffusion varying randomness and personal threshold (h) [13]……..15
Figure 2.4 The Cultural Algorithm [18]………..20
Figure 2.5 Average health loss in children in presence of social network ……….21
(bottom) and its absence (top) [18] Figure 2.6 Average health loss in children in presence of belief space (top)………..23
and both belief space and intervention (bottom) [19] Figure 2.7 Predictive Data Mining: The Architecture [5]………...26
Figure 2.8 Domain of Thesis………...27
Figure 3.1 Framework for Validation of Agent-based Model………....29
Figure 3.2 Intervention Policy Framework……….30
Figure 5.1 Cultural Algorithm and Social Network………55
Figure 5.2 Flowchart of Agent-based model………...58
Figure 6.1 Process of Crossover………..66
Figure 7.1 Average knowledge of Child Safety over 180 days………...68
Figure 7.2 Comparison of Average Final Knowledge in different Age groups…………..70
Figure 7.3 Comparison of Average Final Knowledge in different Gender groups…….…71
Figure 7.4 Comparison of Average Final Knowledge in different City Population……...71
Figure 7.5 Comparison of Average Final Knowledge in different Income Levels…….…72
Figure 7.6 Comparison of Average Final Knowledge in different Countries………….…72
CHAPTER 1
INTRODUCTION
Road accidents are one of the leading causes of deaths in children around the world [39].
Car seats are used to prevent children from serious injuries. These car seats reduce the
risk of injuries in children by a significant amount, yet misuse of these seats is high, even
in developed countries like Canada [27]. There has been a lot of research done by many
government and non-government agencies to investigate the reasons for this misuse and
to reduce it in an effort to increase child safety in cars. Many agent-based models have
been developed for the same purpose, which predict what factors play a major role when
it comes to improper use of child safety measures in cars. These models and simulations
make use of concepts such as cultural learning, social networks, reputation of agents etc.
Most of these models aim to predict the extent of spread of knowledge about child safety
measures in cars over a period of time. These simulations present the user with a set of
parameters in order to define and control various characteristics and behaviors. These
parameters are used to drive the algorithms being used in the simulation. Some examples
of these parameters are the learning rate, accident rate etc.
With the rise in better computing power, researchers and computer scientists have
developed many simulations to dig deep into knowledge propagation [6-16,21-28], and
hence use of agent-based modeling has increased for the same, as it has ability to model
complex emergent phenomena, that more traditional modeling approaches cannot capture
easily. In agent-based model, the individual or agent is the atomic model element, rather
decision-making processes and social interactions are very explicit in agent-based models. The
macro-level dynamics of the social system emerge dynamically from the aggregated
individual behavior and the interactions between agents. An end-to-end model, which can
predict future trends by analyzing the patterns of knowledge propagation and the factors,
which affect the rate and extent of knowledge flow, can be very useful when it comes to
making decisions about policies and methods to promote the flow of knowledge.
Kobti et al. [40] introduce an agent-based model prototype for child vehicle safety
injury prevention. This model is further enhanced by adding cultural algorithms [18] and
social networks [19,20] aspects to it. These models aim to predict the factors responsible
for the spread of knowledge related to child safety and the pattern/extent of the spread.
The main drawback with these models was random initialization of the model and agent
parameters. Ahmed et al. [6] introduce the idea of initializing these models by performing
predictive data mining on a survey dataset related to child safety. This was the primary
initial motivation for work presented in this thesis.
1.1
Current Research Motivation
One of the main issues with the present simulations in child safety is the validity of the
model. There is no guarantee that the trends being shown by these simulations present an
actual picture of what might happen in the real world. Major cause for this is high use of
random parameters in these simulations to fill unknown values. Hence, an attempt is
analysis and mining of an actual survey data. The survey used here is the Canadian
National Survey on Child Restraint Use 2010 [27], which was done in collaboration with
the University of Windsor and AUTO21, Canada. Data pre-processing, regression
analysis and mining is performed on the survey data in order to make a decision tree,
which is then used to initialize the parameters in the agent-based model. This is an
attempt to improve the quality and accuracy of the agent-based model when it comes to
compare with real world data.
Moreover the simulations at present mostly revolve around homogenous agents.
Heterogeneity of agents in these simulations has not been explored as much as it should
have been. There are drivers around us with different age, gender, education level etc. Do
these agent profile attributes like age, gender, education level etc. have anything to do
with how they learn knowledge? Which intervention will yield better results: an
intervention with young drivers or an intervention with older drivers? There has been no
study, which can answer questions like these, taking into account the heterogeneity of
agents to such an extent. This is an important aspect which plays an important and
essential role in coining effective intervention policies.
1.2
Thesis Contribution
The aim of this research is to create an agent-based simulation on child vehicle safety
based on an existing survey database, which performs close to real world and then create
population using that simulation. The survey database is used to initialize different
parameters in the agent-based simulation. Regression analysis and predictive data mining
is performed on the survey database to extract these initialization parameters. Once the
simulation is performing close to real world scenario, different intervention policies are
tested on it. This testing is done by Brute force method and by using a Genetic algorithm.
Hence, the main goals of this study are:
• To create a close to real world agent-based simulation on child safety using
regression analysis and predictive data mining on a survey database.
• To design a framework to test the effect and cost of an intervention policy on
population using the agent-based simulation.
• To use exhaustive, or brute force, methods of analysis on intervention
framework to determine general trends regarding performance of intervention
policies based on different agent properties. This provides a basis for
comparison for other modeling approaches.
• To use a Genetic algorithm to find the best intervention policy that can be
performed under a given cost of intervention.
1.3
Thesis Outline
The main aim of this research is to create an agent-based simulation on child vehicle
population using that simulation. In order to discuss this, the thesis has been divided into
the following chapters.
In Chapter 2, a literature review and survey is presented on Child Safety in
vehicles, agent-based models on child safety, different agent-based simulations on
patterns and prediction of knowledge flow and on the issue of validation of agent-based
models.
Chapter 3 describes the survey database and different data processing, analysis
and predictive data mining that were done on it. It also explains the formation of a
decision tree based on the same processed database.
Chapter 4 describes formation of an agent-based model on child safety and
different algorithms and techniques associated with it.
Chapter 5 describes the Intervention Policy framework and different methods that
were used within the framework to explore the policies.
Chapter 6 presents the experiments that were done in the thesis and results
produced by them, along with discussion of those results.
Finally, in the last chapter, the conclusions are presented and some potential
CHAPTER 2
LITERATURE REVIEW
This chapter includes a short report on previous works done in areas of initialization and
validation of agent-based models. Some other agent-based models are discussed, which
concentrate on patterns and prediction of knowledge flow, especially concentrating on
factors that have major effects like heterogeneity of agents and different types of social
networks. Then a small survey is presented on different works done in the field of child
safety in vehicles and agent-based models developed on child safety. This survey also
includes the terminologies related to these theories and models. It includes practical
applications of these models in different fields, with focus on child safety measures.
2.1
Validation in Agent-Based models
Agent model validation has been a major issue in the area of social simulations, but yet
there have not been many systematic considerations of whether different approaches to
validation are appropriate for different approaches to modeling. Validation of models
typically requires experts to look at the data, as errors and unwanted artifacts can appear
in development of agent-based models. Some validation methods might be preferable to
others when it comes to a particular style of based models. Validation in
2.1.1
Empirical Validation
These validations are based on the comparison amongst the result obtained from the
model and what we can observe in the real system. This gives a measurement of how
good the model is in some given situations, but can’t assure that it will prove with
accurate results for situations which are different from those that can be observed in the
real world. Moreover, just because the model gives the same results as the real world is
no guarantee that the results have been obtained in the same way through the same
processes.
2.1.2
Predictive Validation
This type of validation tries to give a proof that the results can be obtained through a
model will have a validity in situations which are not directly observable in the real
world. This is essential for purposes like “what-if” analysis and, in general, for the
models that simulate non-repeatable phenomena like social and economic ones.
2.1.3
Structural Validation
This validation technique is concerned on the process by which the simulation results are
inspected in order to guarantee that all the interacting parts are same as the corresponding
real ones.
Windrum et al. [52] explain empirical validation procedures conditioned by their
perspective as agent-based economic models. The discuss about a set of issues that are
common to all models engaged in empirical validation giving rise to a novel taxonomy
that captures the relevant dimensions along which agent-based models differ. They also
explain three alternative methodological approaches being developed in empirical
validation – indirect calibration [54], the Werker-Brenner approach to empirical
calibration [55] and the history friendly approach [56].
Balci [53] presents guidelines for conducting verification, validation and
accreditation (VV&A) of simulation models. Fifteen guideline principles are introduced
to help researchers and practitioners comprehend what VV&A is all about. The activities
under VV&A are described in modeling and simulation life cycle. The author also
provides with taxonomy of 38 different V&V techniques for object oriented simulation
models and 77 techniques for conventional simulation models. Baqueiro et al. [57] tackle
the problem of standard verification and validation methodologies over agent-based
modeling and simulation. Pure mathematical models deal with analytical equations only.
The authors introduce integration of data mining with agent-based systems. They had
technical difficulties to detect accurate and imperfect data in a given dataset.
calibration, verification in the industry level, and harmonization. They tried to find out
the best validation method, level of validation and how to learn which model was correct.
A new calibration method is introduced, which is based on conjoint analysis that
incorporate real world data into market based simulations. It is stated that conjoint data
results are meaningful on an individual level and also on aggregate level, which is ideal
for agent-based marketing models. Rand et al. [59] propose model validation by matching
model components and process to real world, and by matching macro-level aggregate
patterns, statistics and dynamics that were found across a variety of cases. They claim
that macro measures they used provide useful information about the spatial patterns of
real world. Sargent [60] performs data validation to develop theories, and mathematical
and logical relationships in the model in order to create a conceptual model validation.
Behavioral data is needed in the operational model validation. The theories and
assumptions are tested using mathematical analysis and structural methods on data.
2.2
Agent-based Models on Knowledge Flow Patterns and Prediction
In this section, we will have a look on different agent-based models, which are used for
prediction of knowledge spread and different factors that affect the spread. Everett
Rogers [1] called this phenomenon of spread of knowledge in a society as ‘Diffusion of
Innovation’ [2,3]. Different factors and elements of the models, which affect the
2.2.1
Heterogeneity of Agents
Agents can be usually of two types: homogenous and heterogeneous. Heterogeneous
agents are those, who have varying degree of personal threshold and they are affected by
word of mouth in different ways. Delre et al. [13] investigate how heterogeneity of agents
effects the diffusion of innovation as shown in Figure 2.1. In the new proposed model,
the consumer decides according to both his/her individual preferences and experienced
social influences by other agents in the environment.
Figure 2.1 The S curves of diffusion varying with degree of heterogeneity [13]
Every agent communicates to its neighbors and diffusion happens through Word
of mouth (WOM). Utility U of a product j depends on individual preference and social
represents utility of product j for user i and Ui,j,min is the minimum utility for
acceptance. It was observed that the speed of diffusion is low when personal threshold
are high. Varying the heterogeneity in simulation resulted that more heterogeneous
always causes a faster rate of diffusion. The authors claim that in more heterogeneous
population, diffusion is better than homogeneous population, as critical mass is reached
sooner.
Goldenberg et al. [15] investigate how the individual behaviors of adopters effect
the collective diffusion of innovation. This is known as percolation model. This paper
demonstrates how a microscopic presentation can be used for linking market level model
to individual level behavior. It also allows examination of effect of heterogeneity in
communication behavior of adopters on the aggregate adoption level. The percolation
model has a critical percolation threshold pc such that for a given Q (quality of product),
if Q>pc an infinite cluster of neighboring buyers can be formed, while for Q<pc all
clusters of buyers are finite.
Alkemade and Castaldi [6] investigate whether a firm can learn about consumer
characteristics given limited information and come up with a successful directed
advertising strategy. The authors use the concepts from the literature on epidemics and
herd behavior to study the problem of diffusion of innovation. A special genetic
algorithm is used for the simulation based on the principle of “survival of the fittest”. A
population is randomly initialized with different strategies as genotypes. Now this
Hence better strategies are passed to next generation. Different diffusion dynamics are
used by altering topology, advertising strategy and consumer characteristic.
It was seen that when using homogenous consumers, for random strategies, it is
necessary for network of different agents to be connected for occurrence of cascading. It
happens easily over random networks. With direct advertising, cascades are achieved
easily on regular networks. When dealing with heterogeneous consumers, learned
strategies outperform random ones in every aspect like size and speed of diffusion. The
authors claim that firms can learn a direct advertising strategy taking into account both
topology of social network and consumer characteristic. These outperform the random
advertising strategies.
2.2.2
Structure of Social Network
The three main types of social networks discussed in this section are random network,
highly clustered and scale free network. Abrahamson and Rosenkopf [4] were one of the
first to state the effects of social network structures on diffusion process. They introduced
the idea that each potential adopter experiences a different pressure for adoption, which
depends on the social structure of the network and number of connection that adopter has,
Figure 2.2 Different types of networks and threshold [6]
Three sets of simulations were performed. The first one tests propositions using a
basic model of faddish diffusion. The second one explores the robustness of these
findings assuming that every firm is not equally sensitive to information creating
bandwagon pressure. The third set of simulation explores how these findings differ when
model based on Learning is used rather than Fad theories [62]. The basic model
simulation showed that an increase in network density increases the bandwagon pressure.
Also the greater the number of pressure points and weaknesses at the boundary of a
non-focal stratum, greater the adopters in it. Boundary pressure points and weaknesses have a
greater effect on extent of diffusion than higher density network.
Delre et al. [13] relates degree of randomness in a network to innovation
diffusion. Simulations are run with varying values of network randomness r [.0001– 1],
alters L [1,2], weight of individual preference (y) Vs social influence (x) b [.4– 1], and
every case.
When Randomness was varied, there was a maximum rate of diffusion found at r
= 0.1. When compared against different values of alter, the trade-off was at L= 1.3.When
varying value of weight b, it was found that randomness of network effects rate of
diffusion more drastically when value of b is high. The author later claims that highly
clustered networks support faster diffusion than random networks. Choi et al. [10] talk
about network structure along with effects. The conditions of simulations are little
different than as done by Delre et al. [13]. The results show that failed diffusions are
more likely to happen, when network is highly random as shown in Figure 2.3. But
surprisingly random links facilitates rapid diffusion process. Authors claim that presence
of bridges (random network) reduces average social distance in a network and hence
increasing speed of diffusion, but it might cause under-adoption. On the other hand,
cliquish networks (highly clustered network) facilitate building up an early customer
base, but it inhibits rapid diffusion. So the best strategy would be to work with a mix of
both strategies. Kuandykov and Sokolov [19] compare random networks to scale free
networks. Alkemade and Castaldi [6] discuss about different types of networks and
Figure 2.3 Speed of diffusion varying randomness and personal threshold (h) [13]
In the case of random networks, there are three cases: random network with each
node having same number of neighbors, 3 clusters connected sequentially and absolutely
symmetrical social network in which, all agents can establish links with other agents from
their native or other clusters. Initial number of adopters for all simulations is 30. In case
of scale free networks, most agents have few links (nodes) while some have lots of
connection (hubs). The two cases for scale free networks are hubs and nodes as initial
adopters.
The author states that diffusion was slower when the network was totally random
compared to when random networks were divided into clusters. The diffusion flowed
In case of scale free networks [19], which are networks whose degree distribution
follow a power law, diffusion in hubs as initial adopters case was way faster than the
case, where nodes were the initial adopters. The reason for this observation is
“information equality”, where a network with higher information equality has higher
diffusion of innovation. The authors claim that in random network, the diffusion of
information is faster if network is split into clusters. Longer diffusion time in case of
scale free network is related to lower information equality in comparison to random
networks. Diffusion in scale free network is faster if initial adopters are hubs instead of
nodes.
2.3
Child safety in Vehicles
Road crashes have been the leading cause of minor and fatal injuries amongst children in
Canada, who are less than 14 years in age. Approximately 2 children die or are seriously
injured everyday as a result of road crashes [41]. Different universities, non-profit
organizations and government agencies have done numerous studies and surveys to
figure out the reasons behind non-usage and misuse of proper child safety measures in
vehicles. This section provides a small overview on these studies and their findings.
Apsler et al. [42] make an attempt to increase the usage of booster seats amongst
low-income parents. A pre-test/post test design was conducted in daycare centers with
an educational training and received free seats. Educational programs were provided to
daycare staffs and children, and signs were put up in parking lot. This reduced the
percentage of unrestrained children in vehicles from 56% to 26%. Ebel et al. [43]
conducted a survey to measure booster seat usage and determine the factors predictive of
proper child restraint and assess parental reasons for booster seat use and non-use.
Cross-sectional, observational studies were done in Seattle, Washington and Portland, Oregon,
where drivers were surveyed after picking up children from schools and daycare centers.
Trained observers recorded child height, weight and age and directly observed restraint
use. This was compared to recommended restrained method based on child’s observed
age, weight and height. Only 16.5% of children who should be in a booster seat were
properly restrained compared with 80% of younger children, for whom, child safety seat
was recommended. Relative to a 4-year-old child, a 6-year-old was half as likely to be in
a proper booster seat. Many parents incorrectly believed that children are safe in a
seatbelt and that they have outgrown the need of a special car seat.
Lee et al. [44] performed a study, which investigates child safety knowledge, the
attitude and belief about booster seats in Latino parents. They also explore the effective
strategies for message delivery in Latino community. Focus groups were conducted with
Spanish speaking parents and information was collected through written survey and
discussions. They found out that parents were widely misinformed about rules and
guidelines for booster seat usage. Most of the participants did not own a booster seat. It
was concluded that culture specific campaigns are needed to promote booster seat usage
Factors that influence use of booster seats in a multiethnic community are
explored in Johnston et al. [45]. Three focus groups were conducted with low-income
residents of central and southeast Seattle, Washington. Participants were especially
sought from Somali, Vietnamese and African American communities. Recruitment of
participants was done through posters, flyer and information booths at clinics, community
centers etc. It was found out that participants expressed a lack of understanding about the
working of booster seats in protecting child passengers, and how are they differ from a
car seat. They attributed the lack of usage to ignorance or laziness among community
members who do not value their children’s life. They even expressed concerns regarding
their own capability to practice usage of booster seats consistently. There were a lot of
differences noted in different ethnic and linguistic groups. A need of education and
training around booster seats and law requiring their use was identified.
Intervention studies about child safety in vehicles were done in Zaza et al. [46]
and Pierce et al. [47]. A systematic development team reviewed scientific evidences of
effectiveness of five interventions to increase child safety seat usage [46]. Community
wide information plus enhanced enforcement campaigns and incentive plus educational
programs had sufficient evidence of effectiveness. Education only programs aimed at
parents, young children and healthcare professionals were seen as not being that effective
comparatively. The main objective of [47] was to determine the knowledge level of head
start providers, parents and students about booster seats. Booster seat usage before and
2.4
Agent-based Models on Child Safety in Vehicles
In this section, the discussion is about work done in area of child vehicle safety using
agent-based models. The general agent-based framework, which has been used for
prediction of knowledge flow, child safety knowledge in this case, and the factors that
affect the knowledge spread are explored.
2.4.1
Effects of Culture
Kobti et al. [18] discuss about modeling effects of social influence on driver behavior in
applying child vehicle safety restraint. They use a cultural algorithm for the same. It
enables drivers to learn from their individual driving experience with an option for
immediate feedback from an expert intervention source following an accident. The
cultural algorithm enables population level learning and captures dominant social beliefs
among the drivers.
Situational knowledge is implemented in the belief space, which is based on top
performing drivers. It was seen that in presence of a cultural belief system, the system
that measures the correctness of use of child vehicle safety was positively influenced. But
on the other hand, the population was more resilient to changes after an intervention. This
portrayed that culture plays an important role when it comes to interventions and should
framework is modeled to present a realistic reflection of the population model. It plays an
important role in guiding the learning process of drivers after an intervention by health
care practitioners.
Figure 2.4 The Cultural Algorithm [18]
The cultural algorithm consists of a population and a belief space. The selected
individuals from the population contribute to the knowledge in belief space depending on
the acceptance function. The knowledge in the belief space is manipulated and changed
based on individual experiences and their success or failures. The knowledge controls the
evolution of the population using an influence function [Figure 2.4].
It was seen that learning from the expert source alone was most efficient. In the
safety measures [Figure 2.5]. The system resists change when cultural influences are
present. The intervention methods both at population and individual levels were hindered
by cultural buffer, which suggests that despite having some improvement, the system did
not reach its full potential.
2.4.2
Effects of Social Influence
In a framework which is socially motivated, the modeled agents or drivers are able to
identify friendships and neighboring relations. In Kobti et al. [19], both positive and
negative exemplars are used in the cultural algorithm to guide the belief at population
level. Based on evolving individual experiences and changes in the belief system, both
positive and negative exemplars influence the overall children population health and
improved the possibility of drivers selecting the correct child seat.
The belief space is restricted to situational knowledge, where it encapsulates sets
of best and worst examples taken from most influential individual experiences. Agents
with positive experiences contribute to the good knowledge patterns and the one ones
with bad experiences are used to prevent individuals from selecting failed strategies.
Belief space is updated every 7 days, where population space is searched for top 2% of
the best and worst drivers with best and worst performance, and the belief space is
updated with their knowledge.
It was observed that the drivers were able to learn from both positive and negative
experiences. Maintaining a set of worst patterns enabled the drivers to avoid the common
mistakes and improve their performance. The negative pattern turns into a lesson, which
Figure 2.6 Average health loss in children in presence of belief space (top) and both belief space and intervention (bottom) [19]
2.4.3
Effects of Reputation
Modeling reputation of agents in a complex social simulation presents a significant
challenge due to its distinct social nature. Kobti et al. [20] introduces a notion of
intervention criteria would achieve a better system convergence and introduces reputation
as a variable for the same. They establish a generic reputation framework that tests
alternate formalizations of reputation models.
Reputation refers to trustworthiness of an agent in an artificial society. This
framework allows external injection of knowledge, or intervention in health sciences, or a
new strategy into the artificial society. They claim that a better performance can be
achieved if agents could be carefully selected under some social criteria allowing
efficient knowledge propagation in the society through the network. At each time step,
the model is updated to reflect the changed reputation of agents. The algorithm, which is
responsible for driving the logic of agent collaboration is also altered. Agents use the
reputation to decide on the transfer and level of acceptance of the transferred knowledge.
The first reputation model assumes that reputation of an agent only depends on its
degree of connectivity to the social network around it. The second model extends the
previous models saying that reputation should also depend on quality of knowledge (QK)
of the agent. The Reputation Index (RI) also depends on Income level (IL) and Education
level (EL), which are more of agent properties rather than something that depends on the
social network. The authors claim that from a network perspective, high degree nodes in
a social network are not sufficient to be considered along in a reputation model, but rather
2.4.4
Predictive Data Mining
Ahmed et al. [5] explore the use of predictive data mining, which aims at exploration of
parameters that initialize the child safety model. They claim that existing data from
surveys can be examined using data mining tools, exploring beyond basic statistics what
parameters and values can be most relevant for a more realistic model run. The intent is
to make the model replicate real world conditions as closely as possible, mimicking the
survey data. This helps to discover patterns amongst drivers who have higher probability
of improper usage of child car seats.
This framework uses predictive data mining technique to make predictions about
values of data used in an agent-based model, using known results found from survey data.
It focuses on predictive data mining technique using decision tree classification. A
decision tree is a series of questions systematically arranged so that each question queries
an attribute (e.g. age of the driver) and branches based on the value of the attribute. At
leaves of the tree are placed predictions of the class variable (e.g. type of car seat used).
The proposed architecture collects survey data from a database and generates a Decision
Tree model on the fly. It also provides an Application Program Interface (API), which
will be used by the Car seat model for initialization, prediction and validation. The
system constitutes of three modules namely Data pre-processing module, Data mining
module and API module. It highlights that data mining techniques can be used in
Figure 2.7 Predictive Data Mining: The Architecture [5]
2.5
Domain of Thesis
Figure 2.8 represents the domain of work done in our research study. It explains different
concepts and theories that have been used to construct the whole framework. We have
been extended to use of agents with different profiles in this research work. The
initializations of model and agent parameters are being done through data mining of
survey database and we are using empirical validation to validate our model. Then we
implement the intervention policy testing framework, which is a totally new contribution
by this thesis.
CHAPTER 3
SOLUTION FRAMEWORK
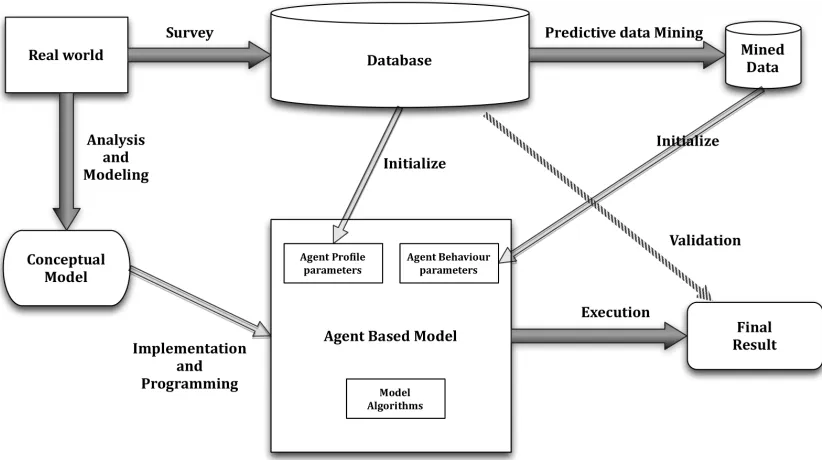
The solution framework proposed in this thesis is divided into two major steps. Step one
concerns with initialization of the agent-based model using predictive data mining on
survey database, and validation of the model as shown in Figure 3.1. Step two involves
using an intervention policy framework to test performance of different intervention
strategies on the agent-based model. These intervention policies can be tested using brute
force method or a genetic algorithm [Figure 3.2].
3.1
Initialization and Validation of Agent-Based Model
1. A survey database is created, which is based on a real world problem.
2. Predictive data mining is performed on the survey database.
3. An agent-based model is conceptualized and implemented based on the real world
problem.
4. Agent profile parameters like age, gender etc. are initialized using the data from
the database.
5. Agent behavior parameters are initialized by the mined data that we get after the
predictive data mining.
6. The agent-based model is executed and final result is compared against the
Figure 3.1 Framework for Validation of Agent-based Model
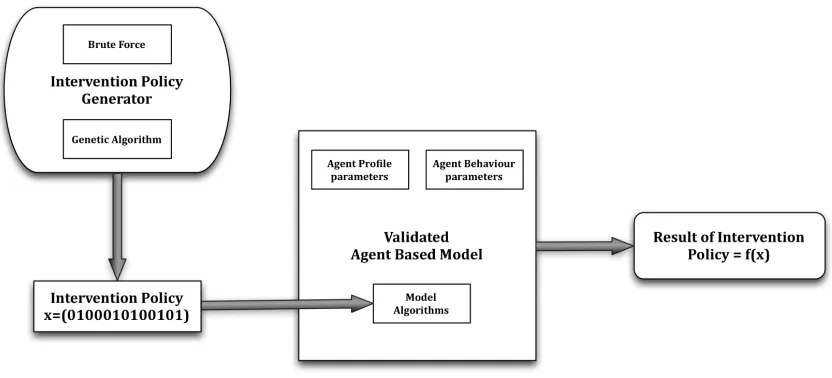
3.2
Intervention Policy Framework
1. Use the validated agent based model from section 3.1
2. Generate intervention policies using Intervention policy generator and test them
on the agent based model.
3. Intervention policy generator can generate policies using brute force method or
genetic algorithm.
4. The performance of an intervention policy can be tested by the final result it
produces, when that policy is applied on the agent-based model.
5. These different policies can now be compared against each other using their
Figure 3.2 Intervention Policy Framework
In the next upcoming sections, we discuss implementation of this framework on child
CHAPTER 4
CHILD SAFETY SURVEY DATA ANALYSIS
The Canadian National Survey on Child Restraint use [29,41] was conducted by
Transport Canada in partnership with Auto21 [30] and professors from Business and
Statistics department at University of Windsor. This study was a follow up to the 2006
National child seat survey submitted to Transport Canada in 2007. In the previous
technical report on Canadian National Survey on Child Restraint Use (2007), it was
found that although most drivers used some type of safety restraint system, the rate of
correct use of safety seats varied among different age groups. This survey was used as the
base for construction and validation of the agent-based model.
In this survey, participants were asked 9 questions related to Child safety measures in
cars. This survey was done in 5 provinces of Canada. The questions asked in the survey
were as follows:
1. What is the correct age to move a child from rear facing seat to a forward facing
seat?
2. What is the correct weight to move a child from rear facing seat to a forward
facing seat?
3. What is the correct height to move a child from rear facing seat to a forward
facing seat?
5. What is the correct weight to move a child from forward facing seat to a booster
seat?
6. What is the correct height to move a child from forward facing seat to a booster
seat?
7. What is the correct age to move a child from booster seat to a seat with seat belt?
8. What is the correct weight to move a child from booster seat to a seat with seat
belt?
9. What is the correct height to move a child from booster seat to a seat with seat
belt?
Apart from these questions, each participant was asked the following personal
information. Except for age, all the questions were multiple-choice. The possible options
for each question are mentioned below along with the question:
1. Age: Numeric Value
2. Gender: 1 = Male
2 = Female
3. Marital Status: 1 = Single
2 = Married/ Common law
3 = Separated/ Divorced
4. Ethnicity: 1 = Caucasian
2 = Native Canadian
3 = African Canadian
4 = Asian
5 = Arabic
6 = Hispanic
7 = East Indian
8 = Other
5. Income Level: 1 = Under $20,000
2 = $20,000 – 40,000
3 = $40,000 – 60,000
4 = $60,000 – 80,000
5 = Over $80,000
6. Education level: 1 = Grade School
2 = Some High school
3 = High School Graduate
4 = Some post-High School
5 = College Diploma/ Certificate
7. Population of city person lives in: 1 = Over 300,000
2 = Between 100,000 – 300,000
3 = Between 30,000 – 100,000
4 = Between 1,000 – 30,000
5 = Under 1,000
8. Was first driver training done in Canada: 1 = Yes
2 = No
The response to each question was noted and kept for records. After the
participants took the survey, an informative pamphlet was provided to each of them.
These pamphlets contained the correct information about child safety measures in cars,
including the correct answers to questions asked above. This stage is called as initial
intervention in our study, when each participant is intervened/provided with knowledge
about child safety.
After the first stage of questionnaire, the same survey is done again after 6
months, where same people who participated in stage one of the survey answer same
questions for the second time. This gives us a quantitative measure of their knowledge
about child safety measures in cars at two different times. This collected knowledge is
put through the process of Data mining, Data Pre-processing, Regression analysis and
Decision Tree formation, so that the agent-based model can be prepared and initialized
which is closer to real world, when compared to simulations that use random values for
initialization of agent parameters.
4.1
Data Mining/Pre-processing
After the surveys were done and the data was collected, came the stage of data cleaning,
mining and pre-processing. This is a necessary step, as the data collected cannot be used
in an agent-based model to initialize different parameters in its current form. This data
has to go through a process of cleaning and pre-processing, so that it’s fit to be used by
the agent-based model for parameter initialization and other purposes. The actions taken
to make the dataset capable of being used are explained below.
4.1.1
Data Cleaning
Data cleaning is the process of detection, correction and removal of corrupt records from
a dataset, to get rid of all the dirty data and hence making it usable. All the entries in the
provided dataset, which were not entered properly for every field were got rid off. All the
fields should be properly entered for every person who took the survey; or-else the record
is unusable for the agent-based model. 484 usable entries were left after getting rid of all
the corrupt data. This meant that 484 participants took the survey properly and hence a
4.1.2
Data Pre-Processing
After the process of data cleaning, data pre-processing was performed on the dataset to
make it usable with the agent-based model. The main objective of this process is to break
and convert the dataset into a format, which can be parsed by our agent-based model as a
.csv file, and can be used to automatically initialize different parameters in the
simulation. The main pre-processing, that were performed on the dataset are explained
below.
Pre-Processing on Age
In the given dataset, age was represented by a numeric value for e.g. 24. Since properties
like age, marital status etc. are being used to create different agent profiles, using the
actual numeric value of age for agents will result in numerous agent profiles, which
might make the results less conclusive. For example, if age of all the participants ranges
from 20 to 60, this will give 40 different agent profiles under age, which is a lot to handle
for the agent-based model. Hence age is categorized into 4 groups. These groups are
20s(20-29), 30s(30-39), 40s(40-49) and 50s(50-59). The value of age in different records
is changed accordingly. For example, 24 is replaced by 20, 36 is replaced by 30 etc. This
Converting knowledge to bits
The designed framework deals with knowledge of the agents in a specific format. To
have a quantitative measure for knowledge level of participants, the knowledge of every
participant is needed in a bit format. As we see in section 4.1, there were 9 questions
asked to every participant in the survey. Each of these questions has a correct answer, as
stated below.
1. What is the correct age to move a child from rear facing seat to a forward facing
seat? – 12 months
2. What is the correct weight to move a child from rear facing seat to a forward
facing seat? – 26 inches
3. What is the correct height to move a child from rear facing seat to a forward
facing seat? – 22 pounds
4. What is the correct age to move a child from forward facing seat to a booster seat?
– 48 months
5. What is the correct weight to move a child from forward facing seat to a booster
seat? – 40 inches
6. What is the correct height to move a child from forward facing seat to a booster
seat? – 40 pounds
7. What is the correct age to move a child from booster seat to a seat with seat belt?
– 96 months
8. What is the correct weight to move a child from booster seat to a seat with seat
9. What is the correct height to move a child from booster seat to a seat with seat
belt? – 80 pounds
For each of these questions, the answer given by the participant was either correct or
incorrect. To convert these answers to bit format, “1” was assigned when the answer
given was correct and “0” for every incorrect answer. This converts the knowledge of
participants about child safety measures into a bit format, which is then easier to be dealt
with while using the agent-based model.
Knowledge Level
Due to the pre-processing done in previous section, the knowledge of each and every
participant is now converted into bit format. Since there were 9 questions asked in the
original survey, the knowledge of each participant can be represented by a 9-bit array,
where each bit represents a value, which tells us if the participant answered that particular
question correctly or not. So the typical knowledge of a participant will look like below
Knowledge:
Each bit above represents if the participant gave the answer to the question associated
with that bit correctly or not, depending on the value of the bit (“0” or “1”). This is called
the knowledge array.
Now knowledge level of each participant can be derived from the above given
knowledge array. Knowledge level is simply defined as the number of “1”s in the
knowledge array. So for the knowledge array shown above, the knowledge level will be
4. It is to be noted that the knowledge level is a value between 0 and 9, 0 being the least
possible knowledge level and 9 being the highest. So eventually, there are two knowledge
levels for every participant; initial knowledge, which is the knowledge level on day 1
from the survey before the intervention stage and final knowledge, which is the
knowledge level on day 180 of the survey. These are named Kiand Kf. The knowledge
change Kc is defined as the difference between Kiand Kf. Hence
Kc = Kf - Ki
Kc can hold a numeric value between -9 to +9.
4.2
Regression Analysis
Regression analysis is a statistical analysis technique, which is used to estimate
relationship between different variables. Analysis and modeling of relationships between
a dependent variable and many independent variables can be done using this type of
analysis. It lets us examine how the values of a dependent variable change when an
independent variable varies. SPSS is used to perform this analysis, which is a statistical
In the given survey, the agent profile i.e. age, gender, education level etc. are the
independent variables and knowledge change Kc is the dependent variable. There is an
assumption made that the knowledge change of the participants is dependent on their
agent profile. Regression analysis is used to explore how properties of the participants
affect their knowledge change and to what extent.
Some other data pre-processing is performed on the database before the start of
regression analysis. To establish a proper relationship between dependent and
independent variables, the distribution of data should be reasonable among different
variables. Upon examination, it was seen that out of 484 entries, more than 90% have
‘Caucasian’ as their ‘Ethnicity’ and ‘Married’ as their ‘Marital status’. Therefore it can be
concluded that data distribution within these variables was not significant enough to be
included in our regression analysis as an independent variable. The relationship between
these variables and knowledge change might not be accurate due to lack of even
distribution of data. Therefore, age, gender, income level, education level, driver training
and population of city are used as independent variables and knowledge change is the
dependent variable.
The accuracy of regression analysis is highly dependent on the number of
probable values of dependent variable that are being predicted. Lesser the number of
possible outcomes of dependent variables, the stronger will be the relationship between
are 19 (from -9 to +9). We divide this knowledge change into three categories as show
below:
Knowledge change = Decrease, if Kc is between -9 and -3
Knowledge change = Constant, if Kc is between -3 and +3
Knowledge change = Increase, if Kc is between +3 and +9
The possible outcomes of dependent variable, knowledge change, are reduced to 3
using the classification shown above. The numbers of possible outcomes for the
independent variables are also reduced, as not every outcome has significant number of
entries. After this process, the dataset takes the following structure:
1. Age: 20 = in 20s
30 = in 30s
40 = in 40s or greater than 40
2. Gender: 1 = Male
2 = Female
3. Income Level: 1 = Under $20,000
2 = $20,000 – 40,000
3 = $40,000 – 60,000
5 = Over $80,000
4. Education level: 1 = Grade school/ Some High school/ High school graduate
2 = Some Post-High school
3 = College Diploma/ Certificate
4 = University Degree
5. Population of city person lives in: 1 = Over 300,000
2 = Between 100,000 – 300,000
3 = Between 30,000 – 100,000
4 = Under 30,000
6. Was first driver training done in Canada: 1 = Yes
2 = No
This new modified dataset now goes though the process of regression analysis,
where age, gender, income level, city population, education level and country of driver
training are the independent variables and modified knowledge change, as explained
Coefficients
Model
Unstandardized
Coefficients
Standardized
Coefficients
t Sig.
B Std. Error Beta
(Constant) .348 .245 1.421 .156
Parent Age -.005 .005 -.048 -1.005 .546
Parent Gender .041 .080 .024 .515 .606
Income Level -.056 .028 -.102 -2.016 .044
Driver Training -.081 .074 -.053 -1.090 .276
City Population .067 .032 .098 2.105 .036
Education Level .022 .036 .032 .605 .315
Dependent Variable: Knowledge Change
Table 4.1 Regression Analysis
In the above table, the field of importance is ‘Sig.’. This field is an indicator of strength
of relationship between the independent and dependent variable. The lower the value in
this field, the stronger is the relationship. The 4 independent variables with the lowest
value for the study i.e. City Population, Income Level, Education Level and Driver
Training are chosen for further investigation. These variables have a strong effect
individually on the knowledge change of the participants who took the survey according
4.3
Decision Tree
A decision tree is a tool that helps us in decision support, using a tree like model of
decisions and their consequences. It even includes probability by which the outcomes
occur, their resource cost, and utility. It helps in identifying strategies by which the set
goal can be achieved. When used with data mining, it describes data but not decisions.
The resulting tree can be used as input for decision-making, as in the case below.
A J48 pruned tree will be constructed here, using Weka data mining tool [32, 34].
Pruning is a process in machine learning by which the size of a decision tree can be
reduced. This is done by removing sections of the tree which provide a little power of
classification of instances. The goal of pruning a tree is to reduce complexity and have
improved accuracy by removal of sections which are based on noisy data. J48 is an open
source java implementation of the C4.5 algorithm of decision tree generation [33]. This
implementation is done in the Weka data-mining tool [34], which will be used in this
study. The nodes of the tree are different values of independent variables that we
selected, and the leaves of the tree are the predicted knowledge change of the survey
participant, based on the dataset. The tree generated by Weka is shown in Table 4.2
The prediction being performed here is if the knowledge of the agent will increase, be
that given population of the city, income level, education level and country of driver
training, we can predict the knowledge change Kc of an agent. The value in parentheses is
a ratio of number of cases that follow the rule to those who don’t. This decision tree can
now be used as an input to the agent-based model and decide the learning rate LR of each
agent-based on agent properties and the decision tree. The agents, whose predicted
knowledge change is ‘Increase’ are given a highest learning rate and those with
![Figure 2.1 The S curves of diffusion varying with degree of heterogeneity [13]](https://thumb-us.123doks.com/thumbv2/123dok_us/1419506.1174495/22.612.117.505.330.578/figure-s-curves-diffusion-varying-degree-heterogeneity.webp)
![Figure 2.2 Different types of networks and threshold [6]](https://thumb-us.123doks.com/thumbv2/123dok_us/1419506.1174495/25.612.112.542.67.229/figure-different-types-networks-threshold.webp)
![Figure 2.3 Speed of diffusion varying randomness and personal threshold (h) [13]](https://thumb-us.123doks.com/thumbv2/123dok_us/1419506.1174495/27.612.124.532.82.345/figure-speed-diffusion-varying-randomness-personal-threshold-h.webp)
![Figure 2.4 The Cultural Algorithm [18]](https://thumb-us.123doks.com/thumbv2/123dok_us/1419506.1174495/32.612.137.519.150.440/figure-the-cultural-algorithm.webp)


![Figure 2.7 Predictive Data Mining: The Architecture [5]](https://thumb-us.123doks.com/thumbv2/123dok_us/1419506.1174495/38.612.117.540.73.513/figure-predictive-data-mining-architecture.webp)