Scholarship at UWindsor
Scholarship at UWindsor
Electronic Theses and Dissertations Theses, Dissertations, and Major Papers
2013
The Design and Manipulation of Bromate-Based Chemical
The Design and Manipulation of Bromate-Based Chemical
Oscillators
Oscillators
Jun Li
University of Windsor
Follow this and additional works at: https://scholar.uwindsor.ca/etd
Recommended Citation Recommended Citation
Li, Jun, "The Design and Manipulation of Bromate-Based Chemical Oscillators" (2013). Electronic Theses and Dissertations. 4911.
https://scholar.uwindsor.ca/etd/4911
This online database contains the full-text of PhD dissertations and Masters’ theses of University of Windsor students from 1954 forward. These documents are made available for personal study and research purposes only, in accordance with the Canadian Copyright Act and the Creative Commons license—CC BY-NC-ND (Attribution, Non-Commercial, No Derivative Works). Under this license, works must always be attributed to the copyright holder (original author), cannot be used for any commercial purposes, and may not be altered. Any other use would require the permission of the copyright holder. Students may inquire about withdrawing their dissertation and/or thesis from this database. For additional inquiries, please contact the repository administrator via email
The Design and Manipulation of Bromate-Based
Chemical Oscillators
by
Jun Li
A Dissertation
Submitted to the Faculty of Graduate Studies
Through the Department of Chemistry and Biochemistry
in Partial Fulfillment of the Requirements for
the Degree of Doctor of Philosophy at the
University of Windsor
The Design and Manipulation of Bromate-Based Chemical Oscillators
by
Jun Li
APPROVED BY:
__________________________________________________
O. Steinbock, External Examiner Florida State University
__________________________________________________
X. Nie
Mechanical, Automotive and Materials Engineering
__________________________________________________
R. Schurko
Department of Chemistry and Biochemistry
__________________________________________________
R. Aroca
Department of Chemistry and Biochemistry
__________________________________________________
J. Wang, Advisor
Department of Chemistry and Biochemistry
__________________________________________________
T. Loughead, Chair of Defense Department of Kinesiology
DECLARATION OF CO-AUTHORSHIP/PREVIOUS PUBLICATION
I.
Co-Authorship Declaration
I hereby declare that chapter 6 of this thesis incorporates material that is the result of joint research with Xuefeng Hu, who is also under the supervision of Dr. J. Wang, The collaboration is covered in chapter 6 of the thesis.
I am aware of the University of Windsor Senate Policy on Authorship and I certify that I have properly acknowledged the contribution of other researchers to my thesis, and have obtained written permission from each of the co-author(s) to include the above material(s) in my thesis.
I certify that, with the above qualification, this thesis, and the research to which it refers, is the product of my own work.
II.
Declaration of Previous Publication
This thesis includes 7 chapters which 5 of them are original papers that have been previously published in peer reviewed journals, as follows:
Thesis
Chapter Publication title / full citation Publication status
Chapter 2
Complex kinetics and significant influences of bromine removal in ferroin-bromate-metol reaction, J. Li and J. Wang, Phys. Chem. Chem. Phys., 13, 2011, 15539.
Published
Chapter 3 Design of batch minimal bromate oscillator, J. Li and J.
Wang, Chem. Phys. Lett., 508, 2011, 320. Published
Chapter 4
Subtle photochemical behavior in ferroin-bromate-benzoquinone reaction, J. Li and J. Wang, J. Phys. Chem. A, 116, 2012, 386.
Published
Chapter 5
Complex Dynamical Behavior in the Highly Photosensitive Cerium-Bromate-1,4-Benzoquinone Reaction, J. Li and J. Wang, J. Phys. Chem. A, 116, 2012, 8130.
Published
Chapter 6
Structural Transformation of Carbon Electrodes for Simultaneous Determination of Dihydroxybenzene Isomers, X. Hu, J. Li and J. Wang, Electrochem. Commun., 21, 2012, 73.
I certify that I have obtained a written permission from the copyright owner(s) to include the above published material(s) in my thesis. Copies of copyright release are included in Appendix D to G. I certify that the above material describes work completed during my registration as graduate student at the University of Windsor.
I declare that, to the best of my knowledge, my thesis does not infringe upon anyone’s copyright nor violate any proprietary rights and that any ideas, techniques, quotations, or any other material from the work of other people included in my thesis, published or otherwise, are fully acknowledged in accordance with the standard referencing practices. Furthermore, to the extent that I have included copyrighted material that surpasses the bounds of fair dealing within the meaning of the Canada Copyright Act, I certify that I have obtained a written permission from the copyright owner(s) to include such material(s) in my thesis.
ABSTRACT
Autocatalytic reactions are a kind of fascinating reactions in nonlinear chemical and
biochemical systems because of their unique features. The auto-catalyst can multiply
itself leading to the spontaneous generation of order. Coupled autocatalytic reactions,
providing a positive/negative feedback to control the multiplication of the auto-catalyst,
can give rise to extraordinary complex behavior such as sequential oscillations. A new
bromate-based oscillator was successfully designed that employs metol as its organic
substrate. Complex reaction behaviors were observed when the system was subjected to
bromine removal and oxygen exposure. Transitions from simple to sequential oscillations
took place as a function of the age of the metol stock solution, in which an important
intermediate is 1,4-hydroquinone and the main final products are 1,4-benzoquinone and
bromobenzoquinones. Various analytical techniques were applied such as TOF-MS,
GC/MS, NMR, UV, etc.
Since bromobenzoquinones are parts of the major products in metol-bromate-ferroin
system, a new type of minimal bromate oscillator is found based on the bromination of
1,4-benzoquinone. The oscillator contains a reagent benzoquinone, which does not react
with metal catalyst ferroin/ferriin, but modulates the evolution of bromide ions through
the reaction between 1,4-benzoquinone and bromine. It could exhibit spontaneous
oscillations in a closed reactor. Due to the role of the organic substrate is only the
bromine removal, we define this system as a batch minimal bromate oscillator.
We further investigated the photochemical behavior of the minimal bromate oscillator,
in which the reduction of ferriin/Cerium (IV) was dominated by bromide ions rather than
exhibited ultrasensitive response to illumination, and the influence of light evolved from
constructive to inhibitory.
In order to determine the dynamic of organic intermediates, such as 1,4-hydroquinone,
which is involved in metol-bromate-ferroin and 1,4-cyclohexanedione
(CHD)-bromate-metal catalyst systems, a new type of modified carbon electrode was developed to
simultaneously determine 1,4-hydroquinone and pyrocatechol with differential pulse
voltammetry. By applying it into the test of dynamics of 1,4-hydroquinone in the
CHD-bromate uncatalyzed system, we successfully monitored the concentration change of
DEDICATION
ACKNOWLEDGEMENTS
To god be all praise and glory, to whom we belong and to whom we shall return. How
can we thank God enough for you in return for all the joy we have in the presence of our
God because of you?
In academic, first and foremost, I would like to gratefully and sincerely thank Dr.
Jichang Wang, my supervisor, for his guidance, support and encouragement during my
doctoral studies. He encouraged me to not only grow as an experimentalist but also as an
independent thinker. He gave me every opportunity to develop my own individuality for
my research and studies and he always helped me to tide over my tough time. For
everything you’ve done for me, I thank you by my heart.
I would also like to thank Dr. Robert Schurko, internal examiner, for his valuable
advice during comprehensive exam and proposal exam, and for his careful guidance
during the NMR course. Also I am thankful for his valuable comments of my research
proposal and thesis.
Particular thanks to Dr. Ricardo Aroca, for his incredibly friendly teaching and
supporting in his field of surface spectroscopy and photochemistry, and I am thankful for
his great help in my research of testing surface properties.
I am grateful to Dr. Xueyuan, Nie, Mechanical, from the Department of Automotive
and Materials Engineering, for his helping enthusiasm during my doctoral journey, and
I wish to express my sincere thanks to Dr. James R. Green who taught me how to carry
out GC-MS, and NMR analysis. He is a kindness teacher. Whenever I need help from
him, he is there.
Lastly, I would like to thank all members in J. Wang’s group and in the Department of
Chemistry and Biochemistry, who have helped me directly or indirectly during my
doctoral program. Especially thanks to Marlene Bezaire, for her constant help during my
TABLE OF CONTENTS
DECLARATION OF CO-AUTHORSHIP/PREVIOUS PUBLICATION iv
ABSTRACT vi
DEDICATION viii
ACKNOWLEDGEMENTS ix
LIST OF TABLES xv
LIST OF FIGURES xvi
LIST OF ABBREVIATIONS xxi
LIST OF APPENDICES xxiii
Chapter 1: Introduction 1
1.1 Nonlinear Dynamics in Stirred Systems 1
1.1.1 Requirement of Chemical Oscillations 1
1.1.2 Nonlinear Kinetics in a Closed Reactor 3
1.1.3 Nonlinear Kinetics in an Open Reactor 6
1.2 Nonlinear Behavior in Reaction-Diffusion Media: Pattern Formation 10
1.2.1 Pattern Formation in One-Dimensional Media 12
1.2.2 Waves in Two-Dimensional Media 15
1.2.3 Three-Dimensional Waves 17
1.2.4 Turing Patterns 18
1.3 Recent Developments in the Study of Chemical Oscillators and Their Potential Applications 20
1.3.1 pH Oscillators 20
1.3.3 Self-oscillating Gels 23
1.3.4 Controlled-Synthesis of Nano/micro-Materials 25
1.4 Objectives of this Thesis 29
1.5 References 31
Chapter 2: Complex Kinetics and Significant Influences of Bromine Removal in Ferroin-Bromate-Metol Reaction 40
2.1 Introduction 40
2.2 Experimental Procedure 41
2.3 Results and Discussion 43
2.3.1 Significance of Bromine Removal 43
2.3.2 Synergetic Influence of Oxygen and Bromine Remove 45
2.3.3 The Importance of the Age of Metol Stock Solution 47
2.3.4 Dependence of the Oscillations on the Initial Compositions 52
2.3.5 Influences of Stirring Rate 57
2.3.6 Dynamic Perturbation and Characterization 59
2.3.7 Spatiotemporal Behavior 63
2.3.8 Simulation of Pattern Formation 67
2.4 Conclusions 71
2.5 References 72
Chapter 3: Design of a Novel Minimal Bromate Oscillator 76
3.1 Introduction 76
3.2 Experimental Procedure 77
3.3 Results and Discussion 78
3.5 References 87
Chapter 4: Subtle Photochemical Behavior in the Ferroin-Bromate-Benzoquinone Reaction 89
4.1 Introduction 89
4.2 Experimental Procedure 91
4.3 Results and Discussion 92
4.4 Conclusions 104
4.5 References 104
Chapter 5: Complex Behavior in the Highly Photosensitive Cerium-Bromate-1,4-Benzoquinone Reaction 107
5.1 Introduction 107
5.2 Experimental Procedure 108
5.3 Results and Discussion 110
5.3.1 Reaction Behavior in a Dark Room 110
5.3.2 The Influence of Ceiling Light 113
5.3.3 Wavelength and Intensity Dependence 116
5.3.4 Mechanistic Characterization 117
5.3.5 Modeling 120
5.4 Conclusions 123
5.5 References 124
Chapter 6: Electrochemically Modified Carbon Electrodes for Simultaneous Determination of Dihydroxybenzene Isomers 127
6.1 Introduction 127
6.3 Results and Discussion 130
6.4 Conclusions 138
6.5 References 139
Chapter 7: Conclusions and Perspective 142
7.1 Conclusions 142
7.2 Future Work 146
7.3 References 152
APPENDIX 154
LIST OF TABLES
4.1 Model proposed for the ferroin-bromate-Q oscillator 102
4.2 Rate constants used in the modeling of the ferroin-bromate-Q oscillator 102
5.1 Model proposed for the cerium-bromate-Q oscillator 121
LIST OF FIGURES
1.1 Attractors conducted in (a) a closed reactor, and (b) an open reactor. 2
1.2 Diagram of the BZ reaction mechanism. 5
1.3 A common CSTR configuration. 7
1.4 Bistability phenomena. 8
1.5 Relationship between active media and spatio-temporal patterns. 13
1.6 Spiral core meandering and local dynamics. 16
2.1 Time series of ferroin-bromate-metol reaction with different configurations of the reactor (a) sealed with parafilm, and (b) flowing nitrogen gas above the solution surface. Initial reaction compositions were [metol] = 0.025 M, [NaBrO3] = 0.05 M, [H2SO4] = 1.7 M, and [ferroin] = 1.0×10⁻⁴ M. 44
2.2 Influence of nitrogen flow rate on the oscillatory behavior (a) 40, (b) 60, and (c) 80 ml/min. Other reaction conditions were [metol] = 0.025M, [NaBrO3] = 0.05M, [H2SO4] = 1.7M, [ferroin] = 1.0x10⁻⁴ M, and the reaction solution volume was 20 ml. 45
2.3 Time series of ferroin-bromate-metol reaction carried out by flowing (a) 1:1 nitrogen and air mixture, (b) air, and (c) oxygen above the solution surface. Other reaction conditions are the same as those used in Figure 2.1b. 47
2.4 Time series of ferroin-bromate-metol reaction performed with (a) fresh, (b) 1, (c) 4, and (d) 7 days old metol stock solution. Initial reaction compositions were [metol] = 0.025 M, [NaBrO3] = 0.05 M, [H2SO4] = 1.7 M, and [ferroin] = 1.0×10 -4 M. 49
2.5 TOF-MS analysis of 3 days old metol solution (a) and 7 days old metol solution (b). 50
2.6 Time series of ferroin-bromate-metol reaction performed with different combination of metol and hydroquinone: (a) [metol] = 0.02 M, [H2Q] = 0.005 M; (b) [metol] = 0.0125 M, [H2Q] = 0.0125 M; and (c) [metol] = 0.01 M, [H2Q] = 0.015 M. Other conditions were the same as in Figure 2.4a. 52
2.8 Time series of ferroin-bromate-metol reaction at different acid concentrations (a)
1.8 M, (b) 1.7 M, (c) 1.3 M, and (d) 0.3 M. Other reaction conditions are [metol] = 0.025 M, [NaBrO3] = 0.05 M, and [ferroin] = 1.0×10⁻⁴ M. The reactor was
unsealed to allow volatile species diffuse out and allow the air diffuse into the reactor. 55
2.9 Time series of ferroin-bromate-metol reaction at different initial concentrations of
ferroin: (a) 2.5×10⁻⁵ M, (b) 5.0×10⁻⁵ M, (c) 2.0×10⁻⁴ M, and (d) 4.0×10⁻⁴ M. Other reaction conditions are [metol] = 0.025 M, [NaBrO3] = 0.05 M, and [H2SO4] = 1.7
M. The reactor was unsealed to allow volatile species diffuse out and air diffuses into the reactor. 56
2.10 Time series of ferroin-bromate-metol reaction at different initial concentrations of
metol: (a) 0.025 M, (b) 0.02 M. Other reaction conditions are [NaBrO3] = 0.05 M,
[ferroin] = 1.0 x 10⁻⁴ M, and [H2SO4] = 1.7 M. The reactor was unsealed to allow
volatile species diffuse out and air diffuses into the reactor. 57
2.11 Influences of stirring rate on the oscillatory behavior: (a) 1200 and (b) 600 rpm,
where nitrogen was flew into the reactor at a rate 60 ml/min. Other reaction conditions were [metol] = 0.025M, [NaBrO3] = 0.05M, [H2SO4] = 1.7M, and
[ferroin] = 1.0 x 10⁻⁴ M. 58
2.12 The influence of stirring rate on the oscillatory behavior: (a) 1200, (b) 900, and (c)
600 rpm, where oxygen was flew into the reactor at a rate 60 ml/min. Other reaction conditions were [metol] = 0.025M, [NaBrO3] = 0.05M, [H2SO4] = 1.7M,
and [ferroin] = 1.0x10⁻⁴M. 59
2.13 Effects of bromide ion on bromate-metol catalyzed reaction with [metol] = 0.025
M, [NaBrO3] = 0.05 M, [ferroin] = 10-4 M and [H2SO4] = 1.7 M, each
perturbation of bromide ion is 0.15 ml [Br-] = 10-4 M in the mixture. All other conditions were the same as those used in Figure 2.4a. 61
2.14 1H NMR (500MHz) spectra of the ferroin-bromate-metol reaction at the conditions [metol] = 0.025 M, [NaBrO3] = 0.05 M, [ferroin] = 1.0x10⁻⁴ M and
[H2SO4] = 1.7 M, (a) sealed with parafilm, and (b) flowing nitrogen gas above the
solution surface. 62
2.15 13C NMR (500MHz) spectra of the ferroin-bromate-metol reaction at the conditions [metol] = 0.025 M, [NaBrO3] = 0.05 M, [ferroin] = 1.0x10⁻⁴ M and
[H2SO4] = 1.7 M, (a) sealed with parafilm, and (b) flowing nitrogen gas above the
solution surface. 63
2.16 Space-time plot of the ferroin-bromate-metol reaction in a capillary tube. The length of the medium is 50 mm. Time period shown here is between 120 min and 360 min. Reaction compositions are [metol] = 0.025 M, [NaBrO3] = 0.05 M,
[ferroin] = 3×10⁻³ M and [H2SO4] = 1.7 M. The inner diameter of the tube is 1.8
mm. (a) two sides of the capillary tube were open to the air, (b) left side of the capillary tube was open to the air, and the right hand side was sealed by water. 65
2.17 Typical spiral waves (a) and target patterns (b) formed in the silica gel membrane.
ferrion, top solution with 2.5 mm thickness was applied the same configuration as Figure 2.1 except a metal catalyst ferroin. 66
2.18 Space-time plots of wave dynamics appearing propagation failure (a), (b) merging
and anomalous dispersion, and splitting (c), (d) wave turbulence, x axis represents space, and y axis means time. All diffusion coefficient was D = 10-3, (a) f1 = 1.0,
(b), (c) and (d) f1 = 0.9. Horizontal axis represents space, and vertical axis means time. 69
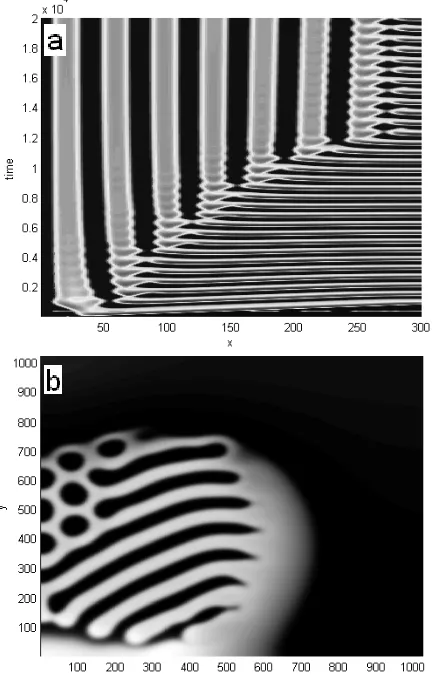
2.19 Space-time plots of transient breathing pulses in (a) and two dimensional breathing
Turing patterns in (b). Parameters applied in (a) were f1 = 0.5, f2 =1.0, Dx = Dw =
10-4, Dy = Dz = 10-3, and parameters applied in (a) were f1 = f2 =1.0, Dx = 10-6, Dy
= Dz = Dw = 10-5. All other parameters were the same as in Figure 2.18. 70
3.1 Time series of ferroin-bromate-benzoquinone reaction at different concentrations
of benzoquinone (a) 0.025 M, (b) 0.035 M and (c) 0.035 M. In (c) 3.0 x 10⁻⁴ M of 1,10-phenanthroline was added initially. Other reaction conditions were [NaBrO3]
= 0.05 M, [ferroin] = 1.0 x 10⁻⁴ M, and [H2SO4] = 0.05 M. The reaction was
carried out in a dark room while the reactor was sealed with parafilm. 80
3.2 Time series of ferroin-bromate-benzoquinone reaction carried out at different
configurations of the reactor: (a) closed, and (b) flowing nitrogen into the reactor (40 mL/min). Compositions of the reaction solution were [NaBrO3] = 0.05 M,
[ferroin] = 1.0 x 10⁻⁴ M, [Q] = 0.035 M, and [H2SO4] = 0.05 M. 81
3.3 Time series of ferroin-bromate-benzoquinone reaction carried out at different
configurations of the reactor: (a) closed, and (b) flowing nitrogen into the reactor (40 mL/min). Compositions of the reaction solution were [NaBrO3] = 0.05 M,
[ferroin] = 1.0 x 10⁻⁴ M, [Q] = 0.025 M, and [H2SO4] = 0.05 M. 82
3.4 Responses of the oscillation to bromide perturbation. Each time 0.015 mL
concentrated bromide was added, resulting 1.0 x 10⁻⁵ M bromide after the dilution. Compositions of the reaction solution were [NaBrO3] = 0.05 M, [ferroin] = 1.0 x
10-4 M, [Q] = 0.03 M, and [H2SO4] = 0.05 M. To achieve a large number of peaks,
nitrogen flow was applied here at a rate of 40 mL/min. 83
3.5 (a) Cyclic voltammetry showing the influence of benzoquinone on the redox
potential of ferriin/ferroin. The scanning rate is 100 mV/s. The supporting electrolyte is 1 M KNO3, [ferroin] = 0.0025 M, [Q] = 0.03 M, and [H2SO4] = 0.1
M. (b) 1H NMR (500MHz) spectrum from the reaction carried out in Figure 3.2a 2-bromo-1,4-benzoquinone: δ = 7.30 (d, J = 3.5 Hz), 6.93 (d, J = 10.5 Hz), 6.83 (dd, J = 10.5, 3.5 Hz). 85
4.1 Time series of ferroin-bromate-benzoquinone reaction carried out (a) in a dark
room, and (b) with the room light on (I = 20 µW/cm2). Other reaction conditions were [NaBrO3] = 0.05 M, [ferroin] = 1.0 x 10⁻⁴ M, [H2SO4] = 0.05 M, and [Q] =
0.035M. 93
4.3 Response of ferroin-bromate-benzoquinone reaction to perturbation of (a) 5 s light
pulse of different wavelengths, (b) bromide ions, and (c) 5 s light pulse of λ = 500
±40 nm and I = 20 mw/cm2. Other reaction conditions were the same as those used in Figure 4.1b. 98
4.4 Time series of ferroin-bromate-benzoquinone reaction illuminated with light of
different intensities: (a) 4 µW/cm2, (b) 15 µW/cm2, and (c) 46 µW/cm2. Other reaction conditions were the same as those used in Figure 4.1a. 99
4.5 Time series of ferroin-bromate-benzoquinone reaction at different sulfuric acid
concentrations: (a1, b1) 0.08 M, (a2, b2) 0.07 M, (a3, b3) 0.05 M, and (a4, b4) 0.03 M. Reactions (a1) to (a4) were illuminated with 500 ±40 nm light of 15 µW/cm2. Reactions (b1) to (b4) were carried out in a dark room. Other conditions were [NaBrO3] = 0.05 M, [ferroin] = 1.0 x 10⁻⁴ M, and [Q] = 0.035M. 100
4.6 (a) Oscillations of the ferroin-bromate-Q reaction in a dark condition. Initial
conditions used in the simulation are: [NaBrO3] = 0.05 M, [ferroin] = 1.0 × 10⁻⁴
M, [Q] = 0.035 M, [H+] = 0.1 M, [H2O] = 55 M and [Br-] = 1× 10⁻⁸ M, k9 = 1.5 M -1
s-1, k11 = 50 M-1s-1, k12 = 25 M-1s-1; (b) time series under the influence of light,
implemented by resetting k9 = 4 M-1s-1, k11 = 60M-1s-1, k12 = 50 M-1s-1. 103
5.1 Time series of the Ce(IV)-bromate-Q reaction carried out at different sulfuric acid
concentrations: (a) 0.15 M, (b) 0.2 M and (c) 0.25 M. Other reaction conditions were [NaBrO3] = 0.05 M, [Ce(IV)] = 1.0 × 10⁻⁴ M and [Q] = 0.035M. 110
5.2 Time series obtained at the condition that air was flowing above the reaction
solution at a rate of 60 ml/min. Other conditions are the same as the corresponding panel in Figure 5.1. 111
5.3 Time series of the Ce(IV)-bromate-Q reaction at different concentrations of Ce(IV):
(a) 5.0 × 10⁻⁵ M, (b) 1.0 × 10⁻⁴ M and (c) 2.0 × 10⁻⁴ M. Other reaction conditions were the same as those in Figure 5.1b. 113
5.4 Time series of the Ce(IV)-bromate-Q reaction under the irradiation of ceiling light
(20µW/cm2) with different concentrations of sulfuric acid: (a) 0.2M, (b) 0.15M, (c) 0.1M, and (d) 0.05M. Other compositions were the same as those used in Figure 5.1. 114
5.5 Time series of the Ce(IV)-bromate-Q reaction under the irradiation of ceiling light
(20µW/cm2) with different Ce(IV) concentrations: (a) 2.5 × 10⁻⁵ M, (b) 5.0 × 10⁻⁵ M, (c) 2.0 × 10⁻⁴ M, and (d) 4.0 × 10⁻³ M. Other reaction conditions were the same as those used in Figure 5.3. The inset in (c) shows responses of the system to light pulse perturbation of different wavelengths. 115
5.6 Time series of the Ce(IV)-bromate-Q reaction illuminated with 500±40 nm light of different intensities: (a) 2.5 µW/cm2, (b) 5 µW/cm2, (c) 50 µW/cm2, and (d) 500 µW/cm2. Other reaction conditions were the same as Figure 5.1b. 117
5.8 (a) Absorption spectra of 0.003M of QBr in 0.1M H2SO4 solution, (b) Time series
of the same QBr solution collected at 350 nm, where the solution was illuminated with 20 mW/cm2light (solid line) or 20µW/cm2 ceiling light (dash line). 120
5.9 (a) Oscillations of the Ce(IV)-bromate-Q reaction in a dark condition. Initial
conditions used in the simulation are: [NaBrO3] = 0.05 M, [Ce(IV)] = 1.0 × 10⁻⁴
M, [Q] = 0.035 M, [H+] = 0.4 M, [H2O] = 55 M, [Br-] = 1× 10⁻⁸ M, k9 = 19.9 M-1s -1
, k10 = 1 × 10⁴ M-1s-1, k11 = 50 M-1s-1; (b) time series under the influence of light,
which was implemented by resetting k9 = 40 M-1s-1, k10 = 1 × 10⁴ M-1s-1, k11 = 60
M-1s-1; (c) the initial concentration of QBr was set to 1.0x10⁻⁶ M, while all other parameters are the same as those in (a). 123
6.1 SEM images of carbon electrodes: (a) unmodified, (b) modified in H2SO4 and (c)
modified in H2SO4 and NaOH solution. Panel (d) is an EDX spectrum of the
electrode shown in (c). Raman spectra of carbon electrodes: (e) unmodified and (f) modified coresponded to a 50% intensity of 514.5 nm exciting laser. 131
6.2 (a) CVs at carbon electrodes of unmodified (curve 1), modified in H2SO4 (curve 2)
and modified in H2SO4 and NaOH solution (curve 3) measured in a 0.001 H2SO4
solution; (b) CVs of a 0.001 H2SO4 solution containing 20.0 µM of H2Q and CC
at carbon electrode (curve 1) and modified carbon electrode (curve 2). 133
6.3 DPVs at a modified carbon electrode in (6.3a) 50 µ M CC and different
concentrations of H2Q: 0.1, 2.0, 3.0, 5.0, 10.0, 20.0, 30.0, 40.0, 50.0, 60.0, 70.0,
80.0, 90.0, and 100.0 µM (from A to N), and (6.3b) 50 µM H2Q and different
concentrations of CC: 0.1, 5.0, 10.0, 20.0, 30.0, 40.0, 50.0, 60.0, 70.0, 80.0, 90.0 and 100.0 µM (from A to L). The insets show the calibration plots of CC and H2Q
versus peak currents. 135
6.4 Oscillation profiles (a) and corresponding DPV situ tests (b), other reaction
conditions were [CHD] = 0.1 M, [NaBrO3] = 0.1 M, [H2SO4] = 0.6 M. (c) DPV
situ measurements during the induction time of CHD-bromate chemical oscillation, (A) right after prepared solution, (B) 2000 s, (C) 4000 s, (D) 6000 s. Oscillation was occurred at around 6400 s. 137
6.5 DPVs at a modified carbon electrode in Figure 6.4a 0.6 M acid and different
concentrations of H2Q: 5.0, 6.0, 7.0, 8.0, 9.0, 10.0 mM (from A to F), and in
Figure 6.4b 1.0M acid and different concentrations of H2Q: 0, 6.0, 7.0, 8.0, 9.0,
10.0, 15.0 mM (from A to G). 138
7.1 Time series of CHD-bromate system without or with PdO, [CHD] = 0.1 M,
[NaBrO3] = 0.1 M, [H2SO4] = 0.8 M, (a) without adding PdO, (b) adding 20 mg
PdO at around 3,800 s. 149
7.2 Time series of CHD and H2Q system with PdO, (a) [CHD] = 0.1 M, [H2SO4] = 0.8
M, adding 20 mg PdO at around 3800 s, (b) [H2Q] = 0.1 M, [H2SO4] = 0.8 M,
adding 20 mg PdO at around 3800 s. 150
7.3 SEM images of CHD-Bromate-PdO system with different aging time. (a) right
LIST OF ABBREVIATIONS
BZ Belousov-Zhabotinsky
FKN Field-Korös-Noyes
MA malonic acid
CIMA chlorite-iodide-malonic acid
BR Briggs-Rauscher
CSTR continuous stirred tank reactor
MBO minimal bromate oscillator
RD reaction-diffusion
CHD 1,4-cyclohexanedione
AOT aerosol OT (sodium bis(2-ethylhexyl) sulfosuccinate)
CFUR continuously fed unstirred reactors
APILs aprotic ionic liquids
PILs protic ionic liquids
NIPAAm N-isopropylacrylamide
TFP thermal frontal polymerization
H2Q 1,4-hydroquinone
BQ 1,4-benzoquinone
Metol p-methylaminophenol
Br2HQ 2,3-dibromohydroquinone and 2,5-dibromohydroquinone
QOH 2-hydroxy-1,4-benzoquinone
CNT carbon nanotube
CC pyrocatechol
CV cyclic voltammetry
SEM scanning electron microscopy
SCE saturated calomel electrode
DPV differential pulse voltammetry
rpm round per minute
EDX energy dispersive X-ray spectroscopy
RSD relative standard deviation
PdO palladium oxide hydrate
LIST OF APPENDICES
A A Code of the Simulation in Chapter 2 154
B A Code of the Simulation in Table 4.1 161
C A Code of the Simulation in Table 5.1 163
D Copyright Releases Chem. Phys. Lett. 165
E Copyright Releases J. Phys. Chem. A 171
F Copyright Releases Phys. Chem. Chem. Phys. 172
Chapter 1: Introduction
This introductory chapter is an overview of chemical oscillators, including both
experimental methods and theoretical analysis employed in related studies.
1.1 Nonlinear Dynamics in Stirred Systems
1.1.1 Requirement of Chemical Oscillations
It is expected that a chemical system that is not at thermodynamic equilibrium will
monotonically move toward the equilibrium state [1] due to the second law of
thermodynamics, which states “the entropy of an isolated system not in equilibrium will
tend to increase over time (∆S > 0), approaching a maximum value at equilibrium”. At
the point of chemical equilibrium, Gibbs energy G is minimum and the thermodynamic
requirement of the change in Gibbs free energy ∆G equals 0. If a chemical system is
close to the equilibrium, the chemical driving force has a linear relationship with
thermodynamic flow. Thus the behavior of this kind of chemical systems will approach
their final equilibrium monotonically. Therefore, for a chemical system to display any
interesting nonlinear behaviour such as oscillations and chaos, the system is required to
stay far from thermodynamic equilibrium [2-4].
When chemical oscillations occur, they never pass through the thermodynamic
equilibrium point. How to keep a system far away from equilibrium? It depends on the
initial concentrations and the type of reactors [5] as shown in Figure 1.1. Comparing with
those oscillating intermediates, in a closed reactor (a) much higher initial concentrations
of the reactants are necessary in order to sustain the reaction conditions
far-from-equilibrium condition indefinitely through continuous inflow of reactants and outflow of
products (see the circle loop in (b)).
Figure 1.1 Attractors conducted in (a) a closed reactor, and (b) an open reactor.
(quoted from Y. F. Li, H. Qian and Y. F. Yi, J. Chem. Phys., 2008, 129, 154505.)
Another important requirement for a system to exhibit nonlinear phenomena is the
presence of nonlinear feedbacks [6]. Such a feedback is defined as either the
intermediates or products influencing steps earlier in the reaction mechanism either
positively (accelerating the reactions) or negatively (inhibiting the reactions). The most
common form in a nonlinear chemical system is autocatalytic reactions, such as the
1.1.2 Nonlinear Kinetics in a Closed Reactor
The closed reactor plays an important role in investigating the clock reaction [7-9], and
represents the simplest configuration in studying macroscopic chemical kinetics. The
reaction system is maintained homogeneous by vigorous stirring and thermostatic with a
circulating water jacket. No chemicals enter or leave the reactor once the reaction starts.
Therefore it is also called a batch reactor.
Relatively few reaction systems can exhibit spontaneous oscillations in a closed reactor.
The Bray-Liebhafsky (BL) reaction is the first chemical clock, which is the reaction of
iodate, iodine and hydrogen peroxide. Bray [8] in 1921 and Bray and Liebhafsky [9] in
1931 investigated the catalytic role of iodate in the conversion of hydrogen peroxide to
oxygen and water. At certain reaction conditions, the evolution of iodine was found like a
clock reaction, in which the color of iodine was fading from dark to colorless. After the
clock event the system was unable to return to such initial conditions for resetting the
clock. Although the chemical clock could repeat at various conditions, chemists thought
that the BL reaction was not entirely homogeneous and such a repeated chemical clock
was a result of dust or bubbles. Before the development of the Belousov-Zhabotinsky
(BZ) oscillator, a number of papers had been published on why true homogeneous
oscillation was impossible [10], that is why the BL reaction was treated as a
nonhomogeneous reaction [11, 12].
With no doubt, the BZ reaction [13-30] is the first stone knocked at the door of modern
nonlinear chemical dynamics. Belousov [10] investigated a batch reaction with potassium
bromate, citric acid/malonic acid (MA), sulfuric acid and cerium sulfate, and observed
Zhabotinsky improved the Belousov recipe by using a new redox indicator, in which
ferroin is red in the reduced form and blue in the oxidized state, making the transitions
easily visible [15]. As shown the basic BZ reaction mechanism [31-36] in Figure 1.2,
Mred represents the reduced state of metal catalysts, and Mox denotes the oxidized state.
Consumption of bromate by bromide initiates the first autocatalytic cycle to produce
HBrO2,and such a process results in the oxidation of metal catalyst. On the other hand,
the consumption of bromide by HBrO2 initiates a second reaction cycle for the reduction
of the oxidized metal catalyst (dashed line), in which bromide reacts with HBrO2 to
generate HOBr, bromide reacts with HOBr to generate bromine, and bromine reacts with
MA to generate brominated MA which is BrMA. The final product of Mox from the first
autocatalytic cycle reacts with the final product of BrMA from the second reaction cycle,
and then gives rise to the regeneration of bromide. Just like a clock reset, the
concentration of bromide eventually falls below some critical level [Br-]cr. When the
concentration of bromide is above the [Br-]cr, bromide consumption reactions dominate.
When the concentration of bromide is below the [Br-]cr, the bromide regeneration reaction
will be the predominant process.
In 1955 Prigogine [10] pointed out that while a closed system must eventually reach
equilibrium, transient oscillations might take place as the system approaches to the
equilibrium from a far-from-equilibrium condition. In other words, chemical oscillations
in closed systems no longer violate the laws of nature. What actually oscillate in the BZ
Figure 1.2 Diagram of the BZ reaction mechanism.
In 1972 Richard J. Field, Endre Koros and Richard M. Noyes proposed the first
complete mechanism for the BZ reaction [31], which is now commonly known as the
FKN mechanism. This full scheme was later simplified to a mathematical model
“Oregonator” for qualitatively simulating the BZ oscillations:
The Oregonator consists of five reaction steps, where X = HBrO2, Y = Br-, Z = Ce(IV),
A = BrO3-, B = CH2(COOH)2, and P = HOBr or BrCH(COOH)2. Three major processes
are involved: (1) Br- consumption (reactions 1 and 2); (2) HBrO2 autocatalytic production
(reaction 3); and (3) Br- regeneration (reactions 4 and 5). The study of the FKN
mechanism and Oregonator model has led to new insights into nonlinear dynamical
phenomena seen in nature and provided important guidance to experimental exploration
of nonlinear kinetics in the laboratory. In the numerical simulations a qualitative change
in the nature of the solution to a set of differential equations is known as a bifurcation and
bifurcation analysis has been commonly employed to determine the onset of oscillatory
behavior [37].
Since the discovery of the BZ reaction, chemists have attempted to use different metal
ions or metal complexes as the catalyst as well as employ different organic substrates
[38-49] to react with the acidic bromate. Those researches have led to the development of
a large number of modified BZ oscillators. In the 1980s, chemists found that some
intermediates of the BZ reaction could oscillate in the closed reactor only when bromine
was removed by inflowing a stream of nitrogen gas or air through the solution [50, 51].
They defined this configuration as a semi-batch reactor, an alternative to the closed
reactor. Later Rabai and Epstein [52] established another kind of semi-batch reactor, in
which the beaker was gradually filled up by a pump or with gravity feed as the reaction
proceeded. Besides the BZ oscillator, many new oscillators such as the
chlorite-iodide-malonic acid (CIMA) [53], Briggs-Rauscher (BR) [54], copper-phosphoric acid system
[55], glycolytic reactions [56], etc. have been uncovered in the last three decades.
1.1.3 Nonlinear Kinetics in an Open Reactor
The best way to study chemical oscillations is in an open reactor, for it can capture the
oscillation where its amplitude and period are truly constant. It must have a flow of fresh
reactants into the system and a flow of products out of it. If a chemical system could
generate oscillations in a closed reactor, it generally would also oscillate in an open
maintained at any of the far-from-equilibrium conditions where the oscillation displays
on the way to the final equilibrium state in the closed reactor. The major experimental
progress for open reactors was the introduction of the continuously flow stirred tank
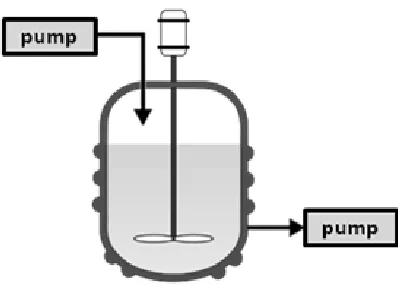
reactor (CSTR) as shown in Figure 1.3, where the pump controls the rate of inflow and
outflow. The average time that a molecule spends in the reactor is calculated with volume
(mL)/flow rate (mL s-1).
Figure 1.3 A common CSTR configuration.
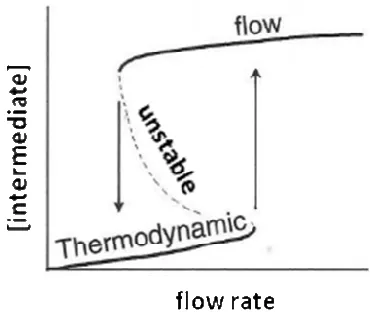
The simplest nonlinear behavior displayed by a chemical system conducted in an open
reactor is bistability. This is the coexistence of two stable steady states over a range of
operating parameters, e.g., flow rate. In Figure 1.4 two solid lines indicate the stable
branches, while the dashed line is an unstable branch of steady states. At a very high flow
rate concentrations of the reactants in a CSTR are similar to their inflow concentrations,
this stable branch is known as flow branch. One of the bistable steady states locates on
this flow branch. At a low flow rate, the system in a CSTR is close to the thermodynamic
steady state is located on this thermodynamic branch. Typically a bistable system
undergoes transitions from one stable steady state to another when a suitable perturbation
is applied or when a control parameter is changed beyond its bistability limit. It is also
possible for chemical systems to display multistability, in which there are more than two
stable steady states coexist.
Figure 1.4 Bistability phenomena. (quoted from I. R. Epstein and J. A. Pojman, Oxford University Press, New York, 1998.)
The development of CSTR technique has greatly facilitated the discovery of new
chemical oscillators and complex chemical oscillations. For example, Geiselar [57]
reported that in a CSTR the bromate-bromide-manganese (II) could exhibit sustained
oscillations or multiple steady states. Orban and co-workers [58] obtained a narrow
oscillatory region in a flow reactor using cerium/manganous ions as the metal catalyst to
react with bromate and have referred those systems as the minimal bromate oscillator
complex oscillations have been achieved when the BZ reaction was studied in a CSTR
[59-66].
Probably the first example of complex chemical oscillations is bursting phenomenon,
which is a form of oscillations usually seen in neurons. Bursting oscillations have a
quiescent period before or after each set of oscillations, in which concentrations during
the quiescent period changed very little. Sorensen [63] reported bursting oscillations in
the BZ reaction in a CSTR, in which the number of oscillations per burst did not change
until a bifurcation to the steady state occurred.The second form of complex oscillations
observed in the BZ reaction in a CSTR was quasiperiodic oscillations [64]. Such an
oscillatory behavior consisted of two distinct frequencies from the analysis of the Fourier
spectrum. Quasiperiodicity is commonly observed in a coupled oscillator or a single
oscillator with an external periodical forcing. Zhabotinsky [65] was the first to report
multipeaked periodic states in the BZ-CSTR system, Maselko and Swinney [66] observed
and defined such basic patterns as mixed-mode oscillations, denoted with LS, consisting
of L as large amplitude oscillation and S as small amplitude oscillation.
Other complex oscillations such as period doubling and chaos had also been observed
in BZ-CSTR systems. Chaos is one of the unwelcome discoveries in science, where
duplicated experiments can lead to very different results because of tiny, unavoidable
differences in the initial conditions. In other words, the chaotic systems can have
outcomes that are entirely unpredictable. The man who forced the science community to
confront chaos was Edward Lorenz. In the early 1960s [67], he tried to find mathematical
equations that could help to predict the weather, like all his contemporaries. He believed
be described as a mechanical system and be predicted by mathematics. However, he was
wrong, when Lorenz wrote down what looked like perfectly simple mathematic equations
to describe the movement of air currents, they did not behave accordingly. Initial
differences, however small, ultimately grow to different macroscopic behaviors. This
phenomenon is very famous today, referred as the “butterfly effect” [68]. If the weather is
indeed governed by true equations with chaotic solutions, regardless of if weather sensors
had been distributed all over the world to feed weather information in real time into the
equations’ programming, differences in initial wind velocities resulting from a butterfly
flapping its wings may result in a hurricane instead of a beautiful day in Category.
Chaos in a CSTR has been found not only in the BZ reaction, but also in the
chlorite-thiosulfate [69], bromate-chlorite-iodide [70] and chlorite-thiourea [71] reactions.
Chemical chaos can be generated through three routes, period-doubling, periodic-chaotic
sequences and intermittency [10]. The unpredictable and unrepeatable chaotic systems
have allured scientists to develop various algorithms to control them, in which the basic
idea is to introduce a carefully chosen, time-dependent perturbation into the chaotic
system to drive the chaos back to normal oscillations.
1.2 Nonlinear Behavior in Reaction-Diffusion Media: Pattern Formation
Formation of ordered structures in nature is ubiquitous. From skin patterns on animals
to the galaxy, the phenomenon of self-organization is encountered in diverse contexts in
physical, chemical and biochemical systems. Well known cases in chemical processes are
target patterns, spiral waves and Turing patterns. In biochemical processes spatiotemporal
self-organized behavior has been studied in the context of pulsations of the heart, calcium
Those beautiful structures, whether it is in a chemical or biochemical system, can be
united through a set of partial differential equations. When the chemical system is
unstirred, it will be governed by reaction and diffusion, which is referred to as a
reaction-diffusion (RD) system shown in the following:
Where the kinetic terms contain nonlinear feedbacks. D denotes the diffusion
coefficient for each chemical species, is a gradient operator in two or more
dimensions (i.e., Laplace operator). In general, pattern formation can be understood as
the cooperative behavior of a large number of individual local oscillators. They are
governed by the reaction terms and are coupled through diffusion terms in the equation
(1.1) and (1.2). Experimentally the RD system has been investigated in one-, two- or
three-dimensional media, such as capillary tubes, petri dishes or beakers. The
confinement of RD systems to different dimensions can give rise to various
spatiotemporal structures like travelling pulses, target patterns, spiral waves and scroll
waves.
Travelling waves of excitation are the common phenomena in a variety of systems far
from thermodynamic equilibrium [72]. Of particular interest are so called excitable
systems that reveal a great variety of spatiotemporal patterns that have fascinated
scientists for several decades, such as electrical propagation in the brain, in nerves and in
cardiac tissue. Constant amplitude and no interference behavior of such excitation waves
arise from the spatial coupling of local nonlinear processes [73]. Of particular importance
threshold value in order to trigger the propagating waves. According to the type of
behavior affecting finite wave packets, the list of diverse types of propagating wave
structures in reaction-diffusion systems [74] is long and includes propagation failure in
the oxidation of CO on platinum surfaces [75], wave merging, stacking, breathing and
backfiring in cyclohexanedione BZ (CHD-BZ) reaction [76], splitting autowaves by
exposing BZ media to short light pulses [77] and electrical fields [78].
1.2.1 Pattern Formation in One-Dimensional Media
Spatiotemporal patterns developed in a capillary tube are often treated as one
dimensional activity. Due to the small diameter of the capillary tube, the diffusion terms
are only effective in the direction parallel to the capillary tube, and the concentration in
each cross section is assumed to be identical. It is essential that at least a clock reaction is
happening in order to generate front waves in one dimensional media. The wave “front”
consists of a single point or a very narrow interval where concentrations jump from one
nearly constant level to another. The wave profile in space resembles the concentration
versus time profile for the homogeneous reaction. In some way, the type of
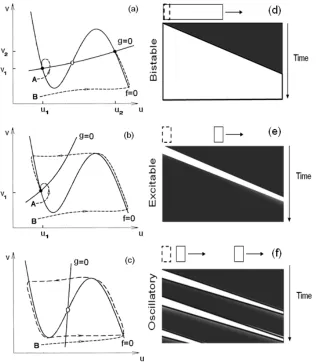
spatiotemporal patterns is determined by the type of active media. Such as “front”
propagation in a bistable medium, traveling waves in excitable media, and wave trains in
oscillatory media [79] (see Figure 1.5).
Ignoring the diffusion term and then setting equations 1.1 and 1.2 equal to zero, two
null lines are obtained in Figure 1.5 (a-c). A large perturbation from the left fixed point to
point B in (a) may leads to a final state at the other fixed point. In such a case, once the
reaction front reaches the right fixed point in one dimensional capillary tube, it will stay
the reaction front propagates, it keeps dark. After the front “burns” this place, it turns
white and never changes back to dark color. There are two separate regions in the
space-temporal plot in (d), and the behavior is called front propagation.
Figure 1.5 Relationship between active media and spatio-temporal patterns.
(quoted from M. C. Cross and P. C. Hohenberg, Rev. Mod. Phys., 1993, 65, 854.)
In an excited system (see Figure 1.5(b)), there is just one stable fixed point. Small
point, whereas large perturbations (e.g. to point B) lead to large excursions along the
dashed line before the concentrations ultimately relax back to the fixed point. When large
local perturbations are applied to the reaction system in the capillary tube, after the front
passes one region, such region will relax back to the fixed point, which has the same
color as the region before the front comes. As a result, one white region will travel from
left of the tube to right. This behavior is called travelling pulses (see Figure 1.5(e)).
Figure 1.5c shows null clines of an oscillatory case, consisting of large amplitude
relaxation oscillations together with an unstable fixed point. Here, after one wave passes
through, the clock reaction will reset and generate another wave because no stable fixed
points exist in the oscillatory case. Eventually, a wave train as shown in Figure 1.5(e) is
developed in the capillary tube.
As demonstrated in Figure 1.5, a chemical wave can be generated by applying a
sufficiently large local perturbation. Where the initial perturbation comes from is a
question that still needs to be addressed. One possibility is to manipulate the local
reaction kinetics by electrical stimulation, light illumination or other chemical means.
Sometimes, the chemical waves can arise spontaneously without an external perturbation.
A more interesting question comes, how has this occurred? Two main possibilities were
found after a great deal of effort into trying to establish the routes by which waves arise
in the BZ reaction. First, a spontaneous concentration fluctuation at a particular point in
the medium may cause the initial perturbation. Second, inhomogeneous, mechanism
involves the presence of a pacemaker or catalytic site, such as a dust particle. Some
researchers have attempted to study whether heterogeneous pacemakers are necessary for
using the remaining dust free conditions, it is possible to greatly increase the average
time required for spontaneous generation of waves in BZ solution. They suggest the dust
particles do serve as pacemakers [80].
1.2.2 Waves in Two-Dimensional Media
Pattern formation in two dimensional media is arguably the one that occurs frequently
in biochemical and physical systems, and is the one that has been studied predominately
in the laboratory and in simulations. A thin layer of two-dimensional reaction medium
such as the BZ reaction can be spontaneously oscillating or excitable. To achieve the
pattern formation in excitable media, one needs to initiate local oscillations at a point in
the medium. After the wave front has been initiated, there will be a new feature arising in
the two dimensional space, which is absent in one dimensional reaction-diffusion
configuration. The new feature is that the wave front may be curved due to
two-dimensional diffusion transportation. The radius R that best fits the wave front in the
neighborhood of point is defined as curvature, K (equal to 1/R). Zykov, Tyson and
Foerster [81-83] have shown both theoretically and experimentally that the velocity of a
curved wave front depends on the curvature in Equation 1.3:
Where N is the normal velocity of the wave front, c is the velocity of a plane wave, and
D is the diffusion coefficient of propagating species u.
In a homogeneous two-dimensional medium, a wavefront initiated from a point
produces a circular front, travelling at the same speed in all direction. When such a
wavefront is generated periodically by a localized pacemaker, the front then moves
target pattern or wave front is broken by a physical disruption such as hitting the
boundary of the medium or placing an obstacle in the medium, free ends will be created,
which lead to the formation of spiral waves. Spiral waves have been observed in a wide
range of chemical and biochemical systems, such as BZ reaction in a Petri dish [84],
carbon monoxide oxidation on platinum surface [85], developing frog eggs [86], cardiac
muscle [87], etc. One particular feature of spiral waves is the center or core from which
the waves emanate. If one watches a spiral wave carefully for a long time, the core of the
spiral may be seen moving around certain trajectory. The motion of the spiral core was
discovered in both numerical studies of the Oregonator model [88] and in a
ferroin-catalyzed BZ medium [89].
Figure 1.6 Spiral core meandering and local dynamics. (quoted from Q. Y. Gao, J. Li, K. L. Zhang and I. R. Epstein, Chaos, 2009, 19, 033134)
One focus of the present study on spiral waves is their dynamical response toward
two-dimensional light sensitive BZ media has been experimentally examined [90], in which
transitions from spiral waves to spatiotemporal chaos have been found. Theoretically
there are many numerical models for the study of spiral instabilities toward periodic
forcing, such as Oregonator, CGLE, Barkley and Brusselator model, et al. A wide variety
of spiral instabilities have been observed based on different forcing amplitudes and
frequencies, such as near-core spiral break up, far-field spiral break up, and complex
phenomena which include back firing, spiral synchronization, spiral regeneration, and
amplitude modulation from line defects [91]. In each case, the spiral core meandering
becomes more and more complex and irregular as the forcing amplitude increases as
shown in Figure 1.6. With no periodic forcing the meandering pattern of spiral core is a
regular circle in (a1) which corresponds to local dynamics of simple oscillation in (a2).
After applying the periodic forcing into the Brusselator model, the meandering patterns
of spiral core becomes more complex and the local dynamics exhibit quasiperiodic
oscillations. The investigation of spiral waves and their stabilities in chemical RD media
with complex dynamics offers promise for understanding similar pattern behavior in
biological development and natural evolution such as pine cones, cauliflower, nautilus
shells and galaxies, to name a few.
1.2.3 Three-Dimensional Waves
RD systems in three dimensions are particularly attractive by virtue of their versatility
and their relevance to biochemical pattern formation. Although their experimental
accessibility is much difficult, researchers are fascinated to study such systems not only
for the importance of these phenomena in nature, but also the intellectual challenge of
spherical waves and scroll waves are seen in three-dimensional systems. The line
connecting all spiral cores is called the filament, which is supposed to be straight. When
filament starts to grow in extension, it will lose its original straight shape and lead to
elaborate patterns and even chaos in three dimensions. The instability of scroll waves has
been reported in the CHD-BZ system, where scroll rings and pairs underwent different
types of collisions due to shrinking or expanding of the filaments [92]. Several other
phenomena such as standing waves and packet waves have also been observed [93] in the
three-dimensional BZ-AOT system, i.e., the BZ reaction in water-in-oil reverse
microemulsion that was stabilized by the surfactant sodium bis(2-ethylhexyl)
sulfosuccinate (AOT).
1.2.4 Turing Patterns
Different from the propagating waves discussed above, there is another unique class of
wave activity, which is independent of time. Such a spatial structure is named Turing
patterns in memory of its discovery by Alan Turing [94], who is widely considered to be
the father of computer science and artificial intelligence. Turing’s purpose was to propose
a mechanism on how the genes could determine the structures of developing organisms.
As catalysts, genes regulated production of organism components. There was no physical
law which could account for the complex physiochemical processes. Therefore, chemical
reactions and diffusion governed such processes. Turing suggested there is a chemical
state, staying stable against perturbations in the absence of diffusion, but becoming
unstable against perturbations in the presence of diffusion. Such diffusion-driven
Scientists have realized that the emergence of Turing patterns had two requirements
[10]. Firstly, the system must maintain the state far from thermodynamic equilibrium,
such as by using continuously fed unstirred reactors (CFUR). Secondly, the diffusion
coefficients of the activator and inhibitory processes are unequal. In common, Turing
instability occurs when the inhibitory diffusion rate is significantly faster than that of the
activator. However, since most of the RD systems were carried out in the aqueous
solutions, in which the diffusion coefficients of all species are on the same order, the
experimental observation of Turing pattern in a RD system was not achieved until 1990.
Patrick De Kepper and his group [95] observed a stationary spotty pattern in the CIMA
system using starch as an indicator. In the experiment a slab of hydrogel was employed to
decrease the diffusion rate of activator species (iodide ions).
Another chemical system that was recently found to support Turing patterns is the
BZ-AOT system, in which the microheterogeneous microemulsion results in different
chemical species diffusing at very different rates. In such a system, various types of
Turing patterns were developed based on different control parameters. For example [96],
stationary Turing patterns have been found in the Ru(bpy)3-catalyzed BZ-AOT system at
high temperature, while a new type of oscillatory Turing patterns were observed at low
temperature. Turing patterns generally occur in one of the three forms: hexagonal spots,
1.3 Recent Developments in the Study of Chemical Oscillators and Their Potential
Applications
1.3.1 pH Oscillators
pH oscillators are defined as systems in which H+ plays the most important kinetic role
in the oscillatory behavior. In such systems, the variation in pH can be as large as four pH
units. Loosely speaking, almost all chemical oscillators have periodic changes in H+
concentration, even in the BZ reaction that requires strongly acidic media. They don’t
belong to pH oscillators not simply because the pH range is negligible, but also due to the
different driving force of the oscillations. In pH oscillators [97-99], the driving force is
the reaction producing H+ in an autocatalytic fashion, and another major composite
reaction is consuming H+ in a slow process.
Along with the 200 variants of chemical oscillators known already, pH oscillators
represent the group that provides the greatest opportunity for practical applications, such
as inducing the conformation change in pH-responsive gels [100-102], pH-sensitive
conformational switching of DNA used to realize autonomous molecular computers [103,
104]. pH oscillators have been reported to produce a spontaneous drug delivery rhythm
[105, 106]. In the last case, the periodic changes in pH-responsive hydrogel which
undergo periodic swelling and deswelling could act as a micro “motor” enabling the
chemical energy to be transformed into mechanical work.
Among the 20 pH oscillators [107] reported to date, an oxidant like IO3-, IO4-, H2O2,
BrO2-, BrO3- and one or two other initial reactants like S2-, SO32-, S2O32-, HCO3-, NH2OH,
Mn2+, CaCO3, CaSO3, Fe(CN)64-, thiourea, phenol are used. Almost all of them could
continuously and thus sustained pH oscillations can be observed. In the case of a
semibatch reactor, the mixture of oxidants is introduced continuously, and long lasting
but only transient pH oscillations appear. Recently, pH oscillations were also generated in
a closed reactor [97] via replacing the inflow of chemicals with a layer of silica gel
impregnated with the key reactants. Such a technique has been successfully applied to the
BrO3- -Mn2+ -SO32-, IO3- -Fe(CN)64- -SO32-, and BrO3- -Fe(CN)64- -SO32- systems, in which
the key reactant sulfite ion was replenished via the dissolution from the gel layer.
Another long lasting pH oscillatory system in a closed reactor [99] is CaSO3 -H2O2
-HCO3-, utilizing the slow dissolution of solid CaSO3 (i.e., it serves as a continuous supply
of the key intermediate HSO3-). An advantage of batch pH oscillators is that it is likely to
be of considerable applications in biochemical systems involving expensive materials
such as DNA, enzymes, etc.
pH oscillations have been simulated with a relatively simple mechanism. For instance,
the following simple skeleton mechanism which consists of three reaction steps has been
developed by Rabai [108]:
Where B denotes the oxidant, and C stand for the two initial reactants, P and Q are
products. Reaction (2) represents an autocatalytic step for producing hydrogen ion,
1.3.2 Oscillations in Protic Ionic Liquids
Except the BZ-AOT system [93, 96], almost all the chemical oscillators have been
studied in aqueous solution, which limits the application of oscillations in organic phase.
This is due to no protons as well as difficulties in dissolving inorganic salts such as
bromate in organic solvent. Such problems can be solved by applying ionic liquids,
which are room-temperature molten salts consisting entirely of ions. There are two
different classes of ionic liquids: aprotic ionic liquids (APILs) and protic ionic liquids
(PILs). PILs are generally prepared by a neutralization reaction from an organic base like
an amine and an acid. If both are strong enough, proton transfer from the acid to the base
occurs. PILs include active protons while APILs do not include active protons. Certain
kinds of PILs have high proton activity compared to acidic water. Therefore PILs are
assumed to be a promising class of preservation medium for supporting BZ oscillations.
Yoshida and his co-workers for the first time applied PILs to study BZ reaction [109].
They recently reported the BZ oscillations that used PILs as a proton source instead of a
conventional acid such as sulfuric acid or nitric acid. In their research the cations were
selected from quaternized aliphatic ammonium ions with different saturated or
unsaturated alkyl groups. The anions were common oxo- or amide acids. After
neutralization, the pH of PILs strongly depended on the structures of anions.
[dema-H+][HSO4-], [DBN-H+][HSO4-], and [dmea-H+][CH3SO3-], were found to release protons
when mixed with water, which led to the initiation of the BZ reaction. These long lasting
BZ oscillations in the PILs media with a short oscillatory period can be explained by the
rapid chemical reactions in bromide regeneration processes, where protons produced in
amine [dema] which exists in the reaction system when [dema-H+][HSO4-] is mixed with
water.
1.3.3 Self-oscillating Gels
Gels are interesting objects which have both liquid-like and solid-like properties. The
solid-like property is due to the cross-linking of the polymers in the form of network. It is
not a new discovery that gels can change their volume more than a thousand fold between
the swelling state and deswelling state in responding to changes in temperature, pH, or
the applied electric field, etc. yet they do provide a great opportunity for applications in
areas such as mass transfer and drug delivery. For the first time, Yoshida and coworkers
in 1996 developed self-oscillating polymer gels which autonomously swell and deswell
periodically in a closed homogeneous BZ solution without any external stimuli [110].
The mechanical oscillation is achieved by applying BZ reactions within the swollen
polymer network. The polymer gel consists of N-isopropylacrylamide (NIPAAm) in
which ruthenium (II) tris- (2,2′-bipyridine) (Ru(bpy)32+), a catalyst for the BZ reaction, is
covalently bonded to the polymer chain. The poly(NIPAAm-co-Ru(bpy)32+) copolymer
gel has a phase transition temperature because of the thermo-sensitive constituent
NIPAAm. The oxidation of the Ru(bpy)32+ moiety results in not only swelling of the gel,
but also a rise in the transition temperature. These characteristics may be interpreted by
considering an increase in hydrophilicity of the polymer chains due to the oxidation of
Ru(II) to Ru(III) in the Ru(bpy)3 moiety. Therefore, it is expected that the gel would
undergo a cyclic swelling-deswelling alteration when the Ru(bpy)3 moiety is periodically
oxidized and reduced. When the gel is immersed in the BZ solution that does not contain