ABSTRACT
WHITEHOUSE, MARY HOLLINGS. Evaluation of the Assessment Component of the HELPS Program. (Under the direction of John C. Begeny.)
The purpose of the research was to examine the assessment component of the Helping Early Literacy with Practice Strategies (HELPS) Program which is similar to curriculum-based measurement (CBM). CBM has demonstrated usefulness with determining student growth and intervention effectiveness, as well as predicting student outcomes on state-mandated assessment. The current study utilized data from one academic year of
implementation of the HELPS Program with second grade students at an elementary school. The purpose was to evaluate whether the assessment data from HELPS indicated gains in students’ reading fluency and whether those gain scores predicted student outcomes on the Gray Oral Reading Test (GORT) for fluency and comprehension. Students’ scores were evaluated in terms of generalization of passage gains (initial reading of a new passage), immediate passage gains (gains within one session with one passage), and retention of passage gains (gains from one session to the next). Scores were evaluated with both linear and quadratic multi-level models. Results indicated that students’ generalization of passage gain scores were most meaningful in terms of determining growth over time and predicting students’ outcome scores. Immediate passage gains, however, can also be useful in
Evaluation of the Assessment Component of the HELPS Program
by
Mary Whitehouse
A thesis submitted to the Graduate Faculty of North Carolina State University
in partial fulfillment of the requirements for the Degree of
Master of Science
Psychology
Raleigh, North Carolina 2009
APPROVED BY:
Shevaun Neupert Scott Stage
___________________________________ John Begeny
ii DEDICATION
For Mom: I hope this in some way continues the work for which you were so gifted and about which you were so passionate. Your gifts are greatly missed.
iii BIOGRAPHY
iv
TABLE OF CONTENTS
LIST OF TABLES ... vii
LIST OF FIGURES ... viii
INTRODUCTION ...1
CHAPTER 1: REVIEW OF THE LITERATURE ...3
Federal Education Legislation: Changes Over Time ...3
A Closer Look at RTI ...7
Historical Perspectives ...7
Current Perspectives ...8
The RTI Framework ...8
Multitier Intervention ...10
Screening and Assessment: What does it mean to respond to intervention? ...11
Curriculum-Based Measurement ...13
A Timeline of CBM Development ...13
Technical Adequacy of CBM ...16
CBM: Empirically Based Assessment ...16
Progress monitoring ...17
Identifying at-risk students ...19
Predicting outcomes ...20
Strengths and limitations...25
Evaluating Intervention Effectiveness/Use in RTI ...30
Reading Fluency ...31
Assessment of Reading Fluency ...33
Empirically Based Reading Fluency Interventions...38
CHAPTER 2: EVALUATING ASSESSMENT WITH THE HELPS PROGRAM ...41
The HELPS Program ...41
Using HELPS as a CBM-R Assessment Tool ...44
v
Research Questions and Hypotheses ...46
CHAPTER 3: METHOD ...51
Participants and Setting...51
Teacher Participants ...51
Student Participants ...52
Setting ...52
Assessment Materials...53
Gray Oral Reading Test, Fourth Edition ...54
Curriculum-Based Measurement program reading passages ...54
Procedure ...55
Analyses ...55
CHAPTER 4: RESULTS ...60
Generalization of Passage Gains ...60
Immediate Passage Gains ...61
Retention Passage Gains ...62
Further Analyses ...64
Generalization of Passage Gains ...65
Immediate Passage Gains ...66
Retention Passage Gains ...67
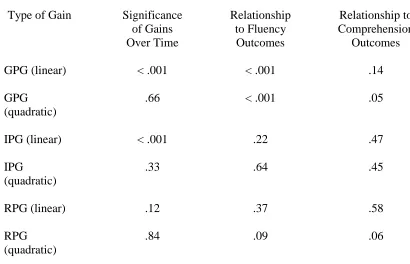
Summary of Results ...67
CHAPTER 5: DISCUSSION ...69
Practical Implications...72
Limitations ...76
Future Research Directions ...77
REFERENCES ...79
APPENDICES ...91
vi
Appendix B. Tips and Reminders for Implementing the HELPS Program ...94
Appendix C. Scripted Protocol—HELPS ...97
Appendix D. Standard HELPS Graph for Grade Two ...98
Appendix E. HELPS Program Prize Chart ...99
vii LIST OF TABLES
Table 1. Linear Multi-Level Models for Generalization of Passage Gains ...103
Table 2. Linear Multi-Level Models for Immediate Passage Gains ...104
Table 3. Linear Multi-Level Models for Retention Passage Gains ...105
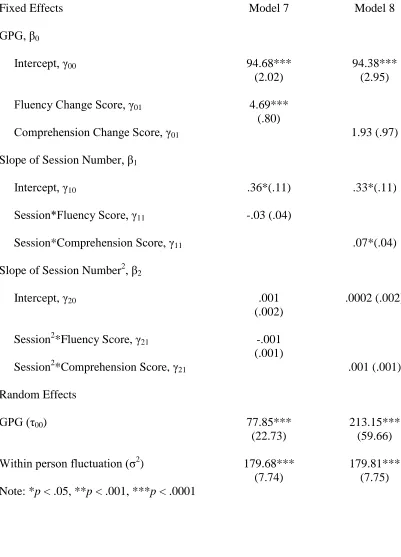
Table 4. Quadratic Multi-Level Models for Generalization of Passage Gains ...106
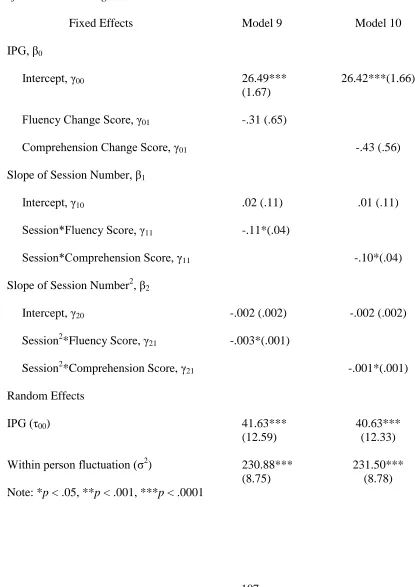
Table 5. Quadratic Multi-Level Models for Immediate Passage Gains ...107
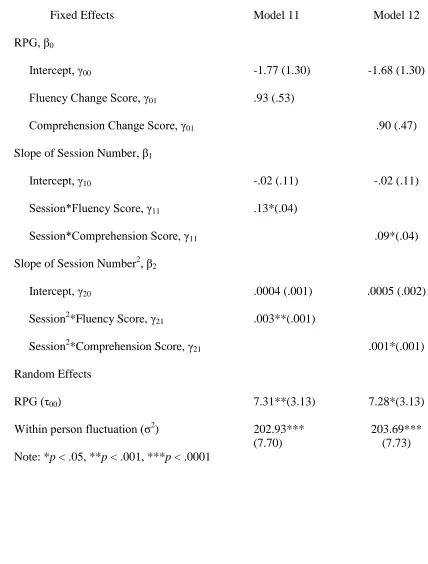
Table 6. Quadratic Multi-Level Models for Retention Passage Gains ...108
viii LIST OF FIGURES
Figure 1. Growth for Generalization of Passage Gains ...110
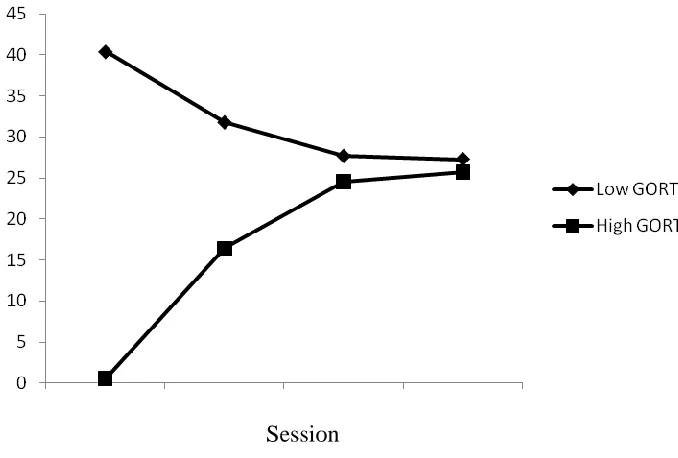
Figure 2. Quadratic Interactions for Immediate Passage Gains—Fluency ...111
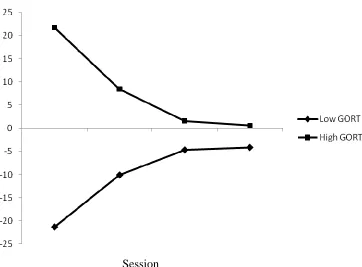
Figure 3. Quadratic Interactions for Immediate Passage Gains—Comprehension ...112
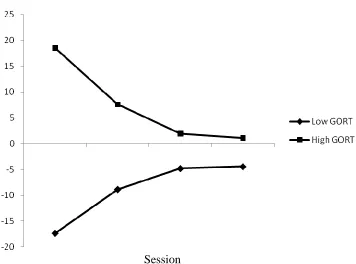
Figure 4. Quadratic Interactions for Retention Passage Gains—Fluency ...113
1 Introduction
Recent legislation, such as the Individuals with Disabilities Education Improvement Act (IDEIA, 2004) and No Child Left Behind (NCLB, 2001), has spurred our education system in a new direction. Amid the copious amounts of high-stakes testing and the pressure to achieve ―adequate yearly progress‖ is the permission—and funding—to evaluate academic achievement differently. Previously, children were classified with a learning disability solely through a significant discrepancy between their IQ and their score on a standardized
achievement test. While that is still a widely used option, there is now another alternative. Children may also be classified if they do not make academic progress after receiving documented, empirically based interventions. At that point, they may then be referred for special education services. This new approach, known in the educational field as Response to Intervention (RTI), helps professionals make decisions concerning students’ academic
growth earlier in students’ education.
2
in their educational careers (Good, Simmons, & Kame’enui, 2001). Reading First, a federal initiative tied to No Child Left Behind, was created for the purposes of providing empirically based reading instruction to all children in order for them to become proficient readers by the end of third grade. Key among the areas of reading development and instruction outlined in Reading First is reading fluency, or the ability to read text with speed and accuracy (U.S. Department of Education, 2002).
Since the recent changes in federal legislation have greatly influenced the field of education, the current discussion begins there. The subsequent section will describe RTI and its relevant components. Because assessment is a core piece of RTI, and because extensive research has focused on the use of Curriculum-Based Measurement (CBM) as the primary assessment tool for RTI models, a discussion of CBM will follow, including its technical adequacy and uses. Finally, reading fluency, its place in RTI, and its relationship to
3 Chapter 1: Review of the Literature Federal Education Legislation: Changes Over Time
The practice of school psychology is guided, in large part, by legal and ethical statutes. Since the mid-1960s, the United States federal government has passed numerous legislative acts pertaining to special education. Primary among those is Public Law 94-142, the Education for All Handicapped Children Act, passed in 1975. This piece of federal
legislation was the first of its kind to guarantee children with disabilities the right to ―free and appropriate public education services‖ (Merrell, Ervin & Gimpel, 2006). Since 1975, P.L. 94-142 has undergone several major revisions. In 1990, the Act was amended and the name was changed to the Individuals with Disabilities Education Act (IDEA). The 1997 version of IDEA outlined the process for classification of disabilities in children. Under this law, any child thought to benefit from special education services underwent a complete individual evaluation. The results of this evaluation were used to determine whether the child met disability criteria for one of thirteen categories. These categories included physical
4
individualized educational plan (IEP) was established to outline the particular special education services the child should receive and the expected progress the child should make over the course of an academic year (Jacob & Hartshorne, 2007).
Although the IQ-achievement discrepancy model has been standard practice for many years, it has garnered much criticism. To begin with, the IQ-achievement discrepancy is not psychometrically valid. This approach lacks adequate reliability, especially for accurately diagnosing learning disabilities (Fletcher, Coulter, Reschly, & Vaughn, 2004; Fletcher, Denton, & Francis, 2005). The IQ-achievement discrepancy also delays intervention for children, preventing eligibility for services until the student’s performance is so low the discrepancy is met. For instance, a child may clearly perform below grade level but his or her academic deficits are not great enough to warrant a diagnosis of a learning disability.
Consequently, they are not identified as needing additional services (Fletcher et al., 2004; Fuchs & Fuchs, 2006; Speece, Case, & Malloy, 2003). Additionally, there is no standardized approach to determining whether a student has met the discrepancy criteria. The IQ score may be the full scale IQ, but it may also be the verbal or performance score by itself (Fletcher et al., 2005). Not only does the IQ-achievement discrepancy lack an evidenciary basis, it is also not an equitable method for determining learning disabilities. More
5
et al., 2004; Gresham, 2007; Speece & Case, 2001; Speece et al., 2003).
The Elementary and Secondary Education Act (ESA) was signed into law in 1965. Under this Act, school districts received federal funding, primarily for the education of children who were economically disadvantaged. There was no specific mention of children with handicaps. In 2001, the ESA was reauthorized and renamed the No Child Left Behind (NCLB) Act. At its core, NCLB is about greater effectiveness of and accountability by school districts (Merrell et al., 2006). School effectiveness was operationalized in terms of adequate yearly progress as indicated by statewide accountability testing (NCLB, 2001). Such testing occurs in grades 3-8 and covers reading and math. Science is assessed at least once in elementary, middle and high school. According to the law, all students must be proficient in these subject areas by the 2013-2014 school year. Failure to display adequate yearly progress results in specific consequences for the particular school and district. Consequences vary, but may include withholding of federal funds, internal restructuring, replacement of staff, and/or state takeover of school operations (Merrell et al., 2006).
6
in an attempt to inflate overall district scores. Additionally, the results of statewide testing are used to evaluate teacher and school performance. Schools with low test scores may
experience negative publicity and greater outside scrutiny, while schools with high scores will likely receive public praise, greater autonomy and, possibly, financial rewards (Jacob & Hartshorne, 2007).
It has been justifiably argued that waiting until the end of 3rd grade to assess students and make decisions about their level of learning is not time-efficient and may not be
instructionally relevant. While they can gauge progress and levels of performance at the school and district levels, the data obtained through end of year assessments do not provide information regarding specific areas of weakness for students (Good et al., 2001).
7 A Closer Look at RTI
Historical Perspectives. Although RTI was just recently outlined in U. S. federal regulations for education, the concept is well established in other fields, such as medicine (Jimerson, Burns, & VanDerHeyden, 2007). Gerald Caplan (1964) outlined a model of preventive psychiatry in Principles of Preventive Psychiatry. The overarching goal of preventive psychiatry is to lower the rate of incidence in mental disorders in a population over time. The intent, according to Caplan, is not to avert sickness in any one person. Instead, the aim of prevention is to reduce the risk of incidence for the whole population in order to reduce the overall number of individuals who will become ill (Caplan, 1964).
Caplan’s program involved three levels, or tiers, of prevention. At the primary level, an individual is seen as representative of a larger group. The individual’s treatment is
developed in response to his or her individual needs as well as in response to the community problem the individual represents. The treatment also utilizes appropriate available resources. Additionally, the information obtained about the individual also provides information
regarding the status of the larger community. Whatever the presenting problem of the individual at the primary level, basic supports are put in place to help the individual through his or her crisis (Caplan, 1964).
The goal of secondary prevention is to reduce the prevalence of a disorder in a
8
encompasses and builds on the first tier. Likewise, tertiary prevention encompasses and adds to secondary prevention. The goal at this level is to reduce the rate of deficient functioning due to mental disorder in the greater community. Tertiary prevention relies on large-scale treatment of mentally disordered patients so they can return to their ―productive capacity‖ as soon as possible (Caplan, 1964).
Within the field of education, it has been suggested that the basis of RTI can be found in the 1980 National Research Council report on special education. That report outlined the way in which the validity of special education services was to be evaluated. Three criteria were stipulated: (a) the caliber of the general education curriculum, (b) whether the special education program is instrumental in producing significant outcomes for students, and (c) the reliability and validity of the assessment process in identifying a disability (Gresham, 2007). Current Perspectives. RTI is most often conceptualized in one of two ways. The first is a problem-solving approach, or ―a systematic analysis of instructional variables designed to isolate target skill/subskill deficits and shape targeted interventions‖ (Jimerson et al., 2007, p. 4). The second is a standard protocol approach, where a standard set of research based instructional methods are implemented to remediate academic difficulties. While this dichotomous conceptualization of RTI is quite common, many RTI models described in the literature combine the two views. Both approaches are, at their essence, problem-solving approaches and are most effective when combined and integrated into a three-tier model of service delivery (Jimerson et al., 2007).
9
sufficient or insufficient change in academic progress as the result of an intervention. Within RTI, decisions about changing or intensifying a student’s intervention are based on how well the student does or does not respond to an evidence-based intervention implemented with integrity. The child’s response to an intervention, as determined by frequent assessment, provides information that ―is used to select, change, or titrate interventions‖ (Gresham, 2007, p. 10). The assumption of RTI is that if a child does not adequately respond to the best feasible interventions in a given setting, then that child should be eligible for additional supports, including more intense intervention and special education services (Gresham, 2007).
Researchers have outlined a model for RTI based on general education (Fuchs, 2003; Fuchs & Fuchs, 1998; Jenkins, Hudson, & Johnson, 2007). A general education environment that has proven to be effective for the majority of students is the principal criteria used to test responsiveness. The primary assumption is that children in an effective general education curriculum or environment experience strong rates of academic growth. The smaller subset of students performing below their peers, then, stands out (Fuchs & Fuchs, 1998). Those students who succeed in a general education program will likely continue to do so and not require intervention. For those students who perform lower than their peers, intensive interventions are required to affect adequate learning (Fuchs 2003). RTI provides a multi-tiered framework that addresses the need for early and, when necessary, continued
10
Multitier Intervention. The RTI framework is based on a three-tiered model of
intervention implementation. While prevention is the overarching emphasis, students receive interventions at the various levels, based on their needs (Glover & DiPerna, 2007).
The first, or primary, tier of intervention is universal. Theoretically, a strong,
empirically-based curriculum is in place class- and school-wide. Ideally, this helps to rule out inadequate instruction as a contributing factor to a student’s academic difficulties. The
second tier utilizes supplemental, research-based strategies to support those students who continue to struggle academically. These strategies may be implemented at the small group or individual level. Finally, the third, or tertiary, tier employs targeted, intensive
interventions for those students who continue to lack academic progress after receiving supports at the first two levels (Daly, Martens, Barnett, Witt, & Olsen, 2007). Tier 3 interventions should still be feasible in the classroom. Failure to respond to such intensive intervention results in a special education referral because the potentially effective level of intervention then goes beyond what the teacher can do in the regular education setting (Ardoin, Witt, Connell, & Koenig, 2005).
11
Screening and Assessment: What does it mean to respond to intervention?
According to Gresham (2007), the aim for all interventions is to improve overall levels of performance. RTI is about detecting and producing changes in student responding over time (Daly et al., 2007). Thus, at each tier, regular assessment occurs to determine whether the intervention is effective, and decisions are then made as to how to modify the intervention as needed (Glover & DiPerna, 2007).
Assessment at Tier 1 involves universal screening for the purpose of accurately classifying students as at-risk for learning difficulties or poor academic outcomes. A
screening process comprised of more than one measure appears to yield better classification accuracy than a process based solely on one measure. Additionally, dynamic assessment can potentially identify those students whose skills in an academic area are low but who also respond quickly to intervention. When used as part of the screening process, dynamic assessment may also increase classification accuracy (Jenkins et al., 2007).
12
Without intervention, the achievement gap between an individual student and his or her classmates will likely continue to widen and, potentially, pass the point at which the student will succeed in the general education curriculum (Ardoin et al., 2005).
As a result of the universal screening, students who evidence need are matched with appropriate services (Glover & DiPerna, 2007). Measurement, then, becomes the means for determining what adjustments need to be made in intervention implementation. As
measurements indicate inadequate levels of student response to the intervention, the intensity of the intervention is strengthened (Daly et al., 2007).
According to Fuchs (2003), intervention responsiveness requires the following: (a) determining the timing of measurement in a student’s response to intervention; (b)
establishing criterion for responsiveness (i.e., a cut point); and (c) consideration of the nature of the intervention (i.e., appropriate for the child’s situation). These three factors should be considered when addressing how to assess intervention responsiveness.
Assessment may be post-intervention, periodically throughout the intervention, or based on dual-discrepancy, which can be applied at any time. Perhaps the most feasible approach of measuring RTI is to assess students following the intervention and then ―apply a standard‖ for distinguishing children who responded to the intervention with those who did not. However, basing the decision on a final status measurement does not directly address responsiveness. In other words, the final score may fall below the standard, but the student may have experienced more growth when compared to others (Fuchs, 2003).
13
growth (e.g., based on pre-/post-testing) or slope (e.g., based on more frequent testing) should be considered. These data, in addition to local norms from universal screening, can be combined to determine an appropriate cut point for responsiveness. The cut point may also be based on a specific benchmark. However it is determined, the cut point, along with local norms, can be useful for generating a normative profile with a range of response to the intervention based on the normal (i.e., local or peer) population. It should be noted, however, that intensive interventions (i.e., highly individualized, small group or lasting an extended period of time) preclude such a normative framework for identifying disability. One alternative may be to compare growth scores to a limited norm (Fuchs, 2003).
According to Busch and Reschly (2007), within RTI, there is a need for ―measures that are technically adequate, can be administered frequently, and are sensitive to student growth‖ (p. 224). The overall goal of prevention-focused assessment is to furnish schools with a system of measurement that provides early and reliable predictions concerning performance on critical outcomes, and that does so in a way relevant to instruction (Good et al., 2001). Research to date has focused primarily on the use of Curriculum-Based
Measurement (CBM) to monitor student progress and to differentiate between students performing at typical and atypical levels (Glover & DiPerna, 2007).
Curriculum Based Measurement (CBM) A Timeline of CBM Development
14
procedures are difficult for classroom teachers to replicate. Testing is done in several-hour blocks of time over the course of a few days and the test materials are developed by a group of people at the state, rather than local, level. Second, decisions being made based on those test scores are so important that other confirming information is needed to complement the data (Crawford, Tindal, & Steiber, 2001). Achievement tests administered once every spring are not relevant for day-to-day decision-making in the classroom (Crawford et al., 2001; Deno, 1985). In general, statewide assessments do not begin until the end of third grade. By then, the information provided by student performance comes at the expense of valuable time that could have been spent providing instructional support (McGlinchey & Hixson, 2004). Third, teachers need the information gathered from more frequent performance indicators in order to improve instructional programs in a timely fashion (Crawford et al., 2001; Deno, 1985). Finally, it is possible that statewide tests are insensitive to change in academic progress for low-performing students (Crawford et al., 2001).
15
The development of CBM began in the late 1970s and early 1980s. By design, the measures are tied to curricula, simple and efficient to administer, capable of having alternate forms, are reliable and valid, inexpensive to produce, and sensitive to change over time (Crawford et al., 2001; Deno, 1985; Marston, 1989). Stanley Deno and Phyllis Mirkin focused their research in the early 1980s on field testing the technical adequacy of potential curriculum-based measures. They identified the following as validated ―curriculum-based measures of student achievement:
1. In the area of reading, counting the number of words a student reads correctly from either a basal reader or word list in a 1-minute interval.
2. In the area of written expression, counting the number of words or letters written during a 3-minute interval, given either a story starter or topic sentence.
3. In spelling, counting the number of correct letter sequences (White & Haring, 1980, as cited in Marston, 1989) or words spelled correctly during a 2-minute interval, given words dictated every 7 seconds.
4. In the area of math, counting the number of correctly written digits during a 2-minute interval from grade-level computational problems‖ (Marston, 1989). By the late 1980s, the scope of CBM expanded from evaluating instructional
effectiveness in special education to developing local norms at the class, school and district levels. From there, CBM outcomes became ―associated with systematic screening, eligibility, and diagnostic decisions‖ (Christ & Silberglitt, 2007, p. 130). More recently, CBM has found its home in RTI as the primary means to evaluate intervention effectiveness (Busch &
16
programming, developing local norms for purposes of instructional decision-making, and improving assessment for minority students (Stage, 2001).
Technical Adequacy of CBM
During the early development period of CBM, researchers understood the importance of the technical adequacy of the measures (Christ & Silberglitt, 2007). The results of the early psychometric research on CBM were summarized in a chapter by Marston (1989), which has become one of the most widely cited sources on the subject (Christ & Silberglitt, 2007). Marston (1989) discussed the research as it pertains to the four main subject areas of CBM: reading, spelling, writing and math.
In the area of reading, Marston (1989) cited studies that examined the relationship between several forms of CBM measures (e.g., oral passage reading, reading in context, Cloze comprehension procedures and word meaning) to the Stanford Diagnostic Test, the Woodcock Reading Mastery Test and the Reading Comprehension subtest from the Peabody Individual Achievement Test. Correlation coefficients ranged from .63 to .90, with most coefficients above .80. Reliability estimates were also strong, with test-retest reliability coefficients ranging from .82-.97, parallel form estimates from .84-.96 and interrater reliability at .99.
CBM: Empirically-based Assessment
17
predict student outcomes, and evaluate intervention effectiveness (Deno, 1985; Silberglitt & Hintze, 2005; Glover & DiPerna, 2007; Shinn, 2007). Each of these will be discussed in turn.
Progress Monitoring. Progress monitoring with CBM is a dynamic approach that involves regular, systematic assessment based on curricular goals. These assessment
outcomes provide data that inform instructional decision-making (Fuchs, 1989). In addition, the use of CBM progress monitoring results in increased instructional quality and student achievement (Fuchs, 1989; Hintze & Christ, 2004). For instance, Fuchs, Deno, and Mirkin (1984) found that teachers who utilize CBM to monitor students’ reading growth (a) tend to employ more measureable and appropriate achievement goals, (b) are more realistic about goal attainment, (c) are able to cite more data for determining sufficient progress and for deciding whether instructional modifications are necessary, and (d) modify individual instructional programs more frequently. Additionally, students experienced better outcomes on global achievement tests assessing decoding and reading comprehension with CBM progress monitoring compared to students who were assessed less systematically.
CBM-Reading (CBM-R) originated as a true measure of children’s performance within their specific curriculum. For assessing reading fluency, children read passages from the basal reader, or the text used as part of the curriculum used in the classroom (Deno, 1985; Marston, 1989). As CBM-R evolved, however, ―non-curriculum‖ passages were created by outside sources (e.g., Dynamic Indicators of Basic Early Literacy Skills (DIBELS);
18
same difficulty level as what the student encounters in the regular classroom. Both types of CBM-R reading probes (i.e., materials from the student’s reading curriculum and materials the student otherwise does not come in contact with) are appropriate for measuring students’ progress over time (Powell-Smith & Bradley-Klug, 2001; Riley-Heller, Kelly-Vance, & Shriver, 2005).
Currently, the most common procedures for progress monitoring in reading incorporate periodic assessments with a tool such as CBM-R, using material that is
unfamiliar to the student. These assessments typically occur at three different points during the school year: fall, winter, and spring (Ardoin & Christ, 2008; Good et al., 2001; Hintze & Silberglitt, 2005; McGlinchey & Hixson, 2004; Stage & Jacobsen, 2001). The two most commonly used sets of standardized reading materials for these tri-annual assessments comes from the Dynamic Indicators of Basic Early Literacy Skills (DIBELS; Good & Kaminski, 2002) and AIMSweb (AIMSweb, 2008).
For each of these systems of CBM-R, the standard tri-annual assessment involves administering a set of three passages to students at each assessment period. The passages are presumably of equivalent difficulty, based on a readability formula and/or field testing with the passages. Each student’s median score from the three readings at each assessment period is used to estimate the student’s level of performance at the time of assessment. Scores from all three assessment points (fall, winter, spring) are used to estimate each student’s reading growth over the course of the school year (Ardoin & Christ, 2008; Shinn, 2002).
19
in the literature, specifically in the area of CBM-R (DIBELS; Good & Kaminski, 2002; Good et al., 2001; Hasbrouck & Tindal, 1992; Silberglitt & Hintze, 2005). The use of these cut-scores as targets for student performance and progress allows educators to evaluate students at each benchmark period and determine whether individual students are ―on track.‖
Individual progress monitoring may also take place much more frequently—as many as several times per week (Fuchs, 2003). Frequent data points, as provided by frequent assessment, provide information to educators in order to develop successful academic strategies. The cut-scores for the class can be a useful tool for comparison at the individual level. Likewise, individual goal lines serve as the basis for evaluating progress. These goal lines, according to Deno, Marston and Tindal (1986) ―are established by plotting a line on a graph from the median baseline performance to the level of performance expected (goal rate) at the program termination (goal date)‖ (p. 11). The slope of the student’s improvement over time represents the average amount of anticipated unit gain from one week to the next. Consequently, the slope serves as an indicator of the student’s growth and skill development (Silberglitt & Hintze, 2007). The goal line establishes the required rate of growth to meet the program goal (Deno et al., 1986). Regular progress monitoring provides information about the individual student’s rate of growth and whether modifications need to be made to increase the student’s potential for goal attainment.
Identifying at-risk students. As previously discussed, the conventional model for identifying students as at-risk or in need of special education services has been the
20
available for determining eligibility. According to the new regulations, ―in determining whether a child has a specific learning disability, a LEA [local education agency] may use a process that determines if the child responds to a scientific, research-based intervention as part of the evaluation procedures‖ (IDEIA, 2004).
In order to determine whether a child is responding to an intervention, frequent assessment must be employed. Repeated measures, such as CBM, provide time-series data, which reveal actual individual growth over time and can be graphically displayed (Deno et al., 1986). Published achievement tests do not provide the same kind of information because they are given only once or twice per year. Practitioners can then use slope and variability of individual performance (data which can only be derived from time-series data) to make educational decisions (Deno et al., 1986; Fuchs & Fuchs, 2006; Shinn, 2007; Silberglitt & Hintze, 2007). These data can estimate responsiveness within as little as two-month’s time (Fuchs, 2003).
21
for additional interventions and/or special education eligibility (Busch & Reschly, 2007; Fuchs, 2003; Glover & DiPerna, 2007).
Predicting outcomes. With the issuance of legislation such as No Child Left Behind, the educational vernacular now includes words such as ―standards-based reform,‖
―accountability,‖ and ―high-stakes testing.‖ The most prominent of these is the use of assessment for purposes of accountability. This high-stakes accountability movement ―calls for an assessment system that produces trustworthy and reliable results that are
instructionally relevant and capable of forecasting educational change that positively impacts and sustains student learning‖ (Good et al., 2001, p. 258).
Given that high-stakes testing does not typically occur until the end of third grade, a system of assessment during primary grades would provide useful information concerning student progress. Such a system can verify whether students are progressing at an appropriate pace before the end of third grade and before some learning problems become too great. This type of assessment, therefore, needs to allow tenable predictions as to how likely children who achieve gains on one measure or set of measures one year will perform at specified benchmark levels in successive years (Good et al., 2001).
22
indicated moderate to strong correlations between the two, suggesting they measure the same construct. The authors also utilized suggested and alternative cut scores in their examination of whether DIBELS predicted CTOPP performance. Although the cut scores resulted in high sensitivity, there were a large number of false positive results, resulting in false
classifications for eligibility. With follow-up analyses and adjusted cut scores, however, the authors were able to reduce false positives and increase specificity and predictive power.
Silberglitt and Hintze (2005) conducted a study using CBM in the area of reading (R). Their purposes were twofold. The first was to ―examine the extent to which CBM-R probes could predict success on state-mandated achievement tests‖ (p. 310). The second was to ―compare various methods of standard setting and examine the accuracy and
appropriateness of each of these approaches in determining cut scores‖ (p. 310). Data were compiled from the 1996-97 through the 2001-02 school years. Multiple cohorts were
included in the sample, with a total of 2,191 students from one large school district. Students completed at least one (though most completed several or all) CBM-R probe in the fall, winter or spring of their 1st, 2nd, or 3rd grade year. In addition, the students all completed the Minnesota Comprehensive Assessment (MCA) in reading in the spring of 3rd grade. The data analysis plan was to examine the correlation between CBM-R and the state test (across benchmark periods) to determine whether CBM-R demonstrated predictive validity for these purposes. All correlations among CBM-R scores and scores on the MCA from winter Grade 1 through spring Grade 3 were significant. However, the strength of the relationship
23
Winter: r = .41; 3rd grade Spring: r = .71). The researchers do point out that there was a nonlinear relationship between CBM-R and MCA at earlier administrations of CBM-R. This may have impacted the correlations to show a less substantial relationship between the two (Silberglitt & Hintze, 2005).
In addition, the researchers examined the number of false positives and false
negatives as measured by predictive power. The overarching goal in this type of assessment is to minimize the number of false negatives in determining eligibility for academic services. In this instance, ―high values of negative predictive power indicate that, of the students who reached the CBM-R cut score, a high percentage of these students also passed the MCA‖ (Silberglitt & Hintze, 2005, p.320). In this particular study, 81-83% of students whose scores were above the appropriate cuts scores for their grade level also passed the MCA. The cut scores established for this study were also consistent with previous research (Silberglitt & Hintze, 2005).
Stage and Jacobsen (2001) examined the predictive validity of CBM-R as related to student outcomes on the Washington Assessment of Student Learning (WASL), a state-mandated achievement test. Students were assessed at three different points during the school year (September, January and May) using oral reading probes taken from the reading
24
measurement periods were statistically significant. The researchers also evaluated the relationship between students’ WASL reading test scores with the students’ slope and y-intercept from the fluency measures. Results indicated that students’ oral reading fluency scores as measured at each assessment point better predicted reading performance on the WASL when compared to growth in oral reading fluency across the entire school year.
McGlinchey and Hixson (2004) replicated Stage and Jacobsen’s (2001) study in Michigan. The purpose was similar, but was extended to a larger, more diverse sample over a longer period of time. Students were administered reading passages two weeks before the Michigan Educational Assessment Program (MEAP) reading assessments. Researchers examined the relationship between reading rate (with a cut score of 100 words correct per minute (WCPM) and scores on the MEAP. A higher cut score, such as 100 WCPM, decreased the probability of predicting a failing score while it increased the probability of predicting a satisfactory score. Results indicated a moderately strong relationship between oral reading rate and performance on the MEAP. The correlation here was higher than that of the Stage and Jacobsen (2001) study (.64 and .44, respectively) (McGlinchey & Hixson, 2004).
25
grade classrooms. They used the CBM-R data to examine end-of-year performance and beginning-to-end-of-year growth in the area of reading. Students’ level and slope (as
generated by CBM-R data) were compared to other students in their own classroom or to the entire sample. For predicting student growth from the beginning to the end of the school year, CBM-R level and CBM-R dual discrepancy yielded moderate to large effect sizes for both comparison to the classroom sample and the entire sample (.60-.67 and .84-.87,
respectively). Use of CBM-R level and CBM-R dual discrepancy to predict post-test
performance yielded very large effect sizes (1.77-2.82 and 1.60-2.27, respectively). The use of CBM-R slope also yielded a moderate effect size for post-performance (.57), and large effect sizes for predictions of growth (.99-1.16). These effect sizes indicate that the use of CBM-R level and dual discrepancy are solid tools for predicting growth and outcomes.
As this was not the original intent behind the development of CBM-R, more research is needed to determine whether CBM-R is a valid tool for predicting high-stakes outcomes, as well as for guiding high-stakes decisions (Christ & Silberglitt, 2007). Preliminary research, however, does provide a promising future for the expanded use of CBM-R.
CBM-R strengths and limitations. The strengths of CBM-R have contributed to it being the standard method of choice for assessing reading fluency. In additional to its established reliability and validity (Christ & Silberglitt, 2007; Marston, 1989), CBM-R is useful for a variety of purposes including predicting important student outcomes
26
Silberglitt & Hintze, 2007), and monitoring student growth (Ardoin & Christ, 2008; Good et al., 2001; Hintze & Silberglitt, 2005; McGlinchey & Hixson, 2004; Stage & Jacobsen, 2001).
CBM-R is an inexpensive measure that is easy for teachers and paraprofessionals to administer in a brief period of time (Deno, 1986; Francis et al., 2008; Marsten, 1989). Research has demonstrated that assessment based on ―non-curricular‖ CBM-R passages, such as those published by AIMSWeb and DIBELS, are just as effective (if not more so) as passages derived from students’ classroom curriculum (Fuchs & Deno, 1994; Riley-Heller et al., 2005; Powell-Smith & Bradley-Klug, 2001). CBM-R passages, such as those included in DIBELS and AIMSweb, also come pre-packaged, making them a more convenient choice for educators.
However, there are several limitations of CBM-R. Measurement error and
researchers’ lack of reporting measurement error are among the primary limitations (Ardoin & Christ, 2008; Poncy, Skinner, & Axtell, 2005). More recently, research has addressed the issue of measurement error and its relationship to interpreting CBM-R outcome scores (Christ & Silberglitt, 2007).
27
reading fluency scores by no more than 1 to 2 words per week over the course of a school year (AIMSweb, 2008; Good & Kaminski, 2002; Hasbrouck & Tindal, 2006). Christ and Silberglitt (2007) also pointed out that the SEM can be used to estimate the magnitude of the standard error of the estimate (SEE) and the standard error of the slope (SEb), the latter being most relevant for decision making purposes (e.g., diagnostic and/or eligibility decisions). Though they did not provide values for the SEE or SEb, Christ and Silberglitt suggested that the variability (SEE) around the trend line is likely to approximate the SEM. Although they recommended that estimates of the SEM, SEE, and SEb should be included with standardized progress monitoring materials, they also stated that measurement error has not yet been sufficiently addressed in research literature.
Researchers agree that one way to increase reliability and decrease measurement error is to obtain more data with a specific student. In other words, students should be assessed on multiple (e.g., 10 to 40) passages that are of similar difficulty levels (Ardoin, 2006; Ardoin & Christ, 2008; Christ & Silberglitt, 2007; Poncy et al., 2005). Researchers have also found that the accuracy of CBM-R scores improved with standardized administration and scoring procedures (Colon & Kranzler, 2006; Hintze & Silberglitt, 2005) as well as consistent measurement conditions (Ardoin & Christ, 2008).
28
assessment system does not provide sufficient data for teachers to make monthly, weekly, or daily instructional decisions. This fact is particularly important for students who may be struggling with reading and receiving some form of reading intervention. In other words, teachers need to know on a more frequent basis (e.g., weekly rather than every three to four months) whether such students are responding to the reading intervention so that timely instructional decisions can be made to maximize each student’s learning. This logic therefore fits as part of a RTI framework, in that students receiving Tier 2 or Tier 3 support ought to be assessed more than once per three to four months.
However, the need for more frequent progress monitoring of students receiving supplemental instruction or intervention (such as at a Tier 2 or Tier 3 level) brings about the obvious logistical problem of ensuring that teachers have the time and resources to
administer more frequent assessments. At the present time, no known research has
29
rating of willingness to administer CBM-R assessments three times per year was 4.6 (SD = 0.7), whereas their willingness to administer such assessments two times per month was 3.9 (SD = 1.1). This difference was statistically significant (p = .002). Also important to note, this same sample of teachers may have valued the importance of reading fluency more than a ―typical‖ sample of teachers. When asked, ―How important do you feel reading fluency is in teaching students to read?‖ teachers’ average rating was 4.5 (SD = 0.5) on a 5-point scale (1 = Not Very Important, 3 = Important; 5 = Extremely Important). Collectively then, these data suggest that with a sample of teachers who clearly value the importance of reading fluency, their willingness to administer or facilitate CBM-R assessments with struggling readers two times per month was significantly lower than their willingness to administer these assessment three times per year. Although this topic is in need of further investigation, these data,
coupled with clinical experience in schools, suggest that teachers may have at least some reservation about administering CBM-R assessments with students they also assist regularly with reading intervention.
30 reading abilities.
In sum, although CBM-R assessment procedures in reading have a number of associated strengths (e.g., brevity of administration, strong indicators of reliability and validity), important limitations (e.g., measurement error, varying difficulty levels of passages, and logistical problems for teachers to achieve regular progress monitoring) still exist. To address these limitations, research suggests that CBM-R be administered frequently enough to reduce measurement error (thereby increasing the amount of data obtained and increasing the consistency in measurement conditions). However, finding ways to do this that are acceptable and feasible for teachers have yet to be thoroughly explored.
Evaluating intervention effectiveness/Use in RTI
According to Hintze and Christ (2004), the primary purposes of CBM-R, when used within a problem solving model, are twofold. The first is to obtain sufficient data related to basic skills performance to detect and confirm academic weaknesses. The second is to monitor students’ responsiveness to intervention or modified instruction over time in a decisive manner.
31
setting. The intent is to modify the general learning curriculum or educational environment in an attempt to increase the performance of students otherwise not making adequate progress in a particular academic area. Progress monitoring with CBM-R occurs several times per week. Decisions are based on tracking a student’s CBM-R data and comparing them to locally established norms or to those norms suggested in the literature. After 10-15 weeks of intervention, the student is moved to either Tiers 1 or 3 based on the change in slope of performance as demonstrated by the CBM-R data. Busch and Reschly (2007) equate Tier 3 with special education. Here, CBM-R is used to set and monitor progress toward
performance and/or IEP goals. The use of CBM-R at this tier also helps teachers meet several of the requirements outlined as part of IDEIA—specifically, setting measurable annual goals and monitoring student progress. CBM-R also allows special education teachers to give timely feedback to parents and others regarding students’ progress.
Much of the discussion related to CBM-R to this point has centered on using it as an assessment tool, with emphasis on the area of reading. It is worthwhile at this point to deviate from the discussion on CBM-R and look at reading fluency in general, as well as
interventions that aim to improve reading fluency for emerging readers. A more thorough description of CBM-R as a means for assessing reading abilities will be included within that discussion.
Reading Fluency
32
Education Statistics (NCES) reported that 33% of children in Grade 4 and 26% of those in Grade 8 read below the basic level (Lee, Grigg, & Donahue, 2007). To address this critical issue, five key areas of reading of reading development and instruction have been identified as primary areas of focus. They are: phonemic awareness, phonics, vocabulary development, reading fluency (including oral reading skills) and reading comprehension (National Institute of Child Health and Human Development [NICHHD], 2000; U.S. Department of Education, 2002). Reading fluency serves as a critical bridge among these five skills. A fluent reader has a solid command of phonemic awareness, phonics and vocabulary development, and they are better able to comprehend the meaning of the text (LaBerge & Samuels, 1974; Martens, Eckert, Begeny, Lewandowski, DiGennaro, Montarello, et al., 2007; O’Connor, White, & Swanson, 2007). Additionally, reading fluency arguably serves as the best overall predictor of overall reading ability, which includes reading comprehension and performance on state-mandated achievement tests (Fuchs, Hosp, & Jenkins, 2001; Jenkins et al., 2005;
McGlinchey & Hixson, 2004; NICHHD, 2000).
Reading fluency has been the subject of much research since the beginning of the 19th century. However, it was not until the work of LaBerge and Samuels in the early 1970s that ―reading fluency took a more prominent role in our understanding of reading development‖ (Chard, Vaughn, & Tyler, 2002, p. 386).
33
text, the more cognitive energy is available to comprehend the meaning of the text. Put another way, when each component of a complex skill requires attention, the completion of the complex skill would be impossible because it has exceeded attentional capacity. When enough components are completed automatically, however, the ―attentional load‖ falls within ―tolerable limits,‖ and the skill is successfully executed. This theory also assumes that lower level cognitive processes must be completed before higher level processes (Fuchs et al., 2001).
Reading fluency, on the whole, is a complex and multifaceted process that requires the synthesis of a variety of skills (Fuchs et al., 2001). The skills required for fluent reading include the identification of letters, phonological awareness (i.e., sound-symbol
relationships), sight-word vocabulary and phonics skills (Snow, Burns, & Griffin, 1998). These skills are acquired gradually, with the greatest growth occurring between kindergarten and second grade (Fuchs et al., 2001).
Assessment of Reading Fluency
As Fuchs and colleagues (2001) suggest, ―the most salient characteristic of skillful reading is the speed with which text is reproduced into spoken language‖ (p. 239). It makes sense, then, to utilize assessment measures that depend on oral reading rate. The validated CBM approach to measuring reading ability (Marston, 1989) is the most widely researched measure for oral reading fluency (ORF) (Busch & Reschly, 2007). In the CBM-R
34
alternate form reliability, making it appropriate for monitoring student progress over time. It can also differentiate growth patterns for students across varying levels of achievement (e.g., high, average, low), making it a valid indicator of overall student progress (Busch & Reschly, 2007). Additionally, CBM-R has a standard protocol, making it easy to administer and time efficient (Busch & Reschly, 2007; Stage & Jacobsen, 2001).
As previously mentioned, a cut score is typically employed to determine whether a student is progressing. In the case of CBM-R, the cut score establishes the ―critical number‖ of WCPM and serves as a benchmark for reading proficiency. Students scoring at or above the cut score are considered proficient readers, and students scoring below the cut score are considered to be in need of additional supports (Silberglitt & Hintze, 2005).
CBM-R cut scores have traditionally been based on local norms, and the percentiles were used to make decisions about placement in special education or to receive instructional intervention (Deno, 1985). However, it has been argued more recently that a norming sample comprised of more students from more diverse settings would offer a more meaningful foundation for data-based decision-making (Silberglitt & Hintze, 2005).
35
Silberglitt and Hintze (2005) examined the relationship between CBM-R and the Minnesota Comprehensive Assessment (MCA), a state-mandated achievement test
administered annually beginning in the spring of Grade 3. They also sought to establish cut scores for CBM-R that best predicted students’ outcomes on the MCA. While their cut scores were determined specifically for one test, they determined cut scores for two to three
benchmark points during each grade level for first through third grades (i.e., fall, winter, spring). Results indicated that CBM-R was a strong tool for predicting outcomes on the MCA. The cut scores established in this study closely resembled those established by Hasbrouck and Tindal (1992). Additionally, the majority of students in the Silberglitt and Hintze (2005) study who read at or above the cut score at each benchmark period passed the MCA (83.5% in Grade 3 Spring). Likewise, the majority of those who read below the cut score failed the MCA (68.5% in Grade 3 Spring). The advantage of the cut scores at the benchmark periods as established in the Silberglitt and Hintze (2005) study is that use of these cut scores will help teachers better determine whether their students are ―on track.‖ These scores can also serve as criteria for intervention effectiveness within an RTI framework.
36
due to variability in passage difficulty can be reduced by using multiple passages (e.g., three or four) at each test point (Jenkins, Zumeta, Dupree, & Johnson, 2005).
Another factor to consider when using assessment of ORF using CBM-R is the frequency and long-term duration of measurement. Teachers can make more reliable estimates of reading growth when they collect ORF data regularly over longer periods of time (e.g., 1-2 times per week for 1 year) (Fuchs, Fuchs, Hamlett, Walz, & Germann, 1993). When ORF is assessed over shorter intervals (e.g., 8 weeks), informative growth estimates can be obtained (Fuchs, 2003), but may include significant measurement error (Hintze & Shapiro, 1997). Evaluators should be cognizant of this fact as it can depict a less accurate picture of growth.
Assessment using CBM-R relies on the measurement of slope, or the average amount of gain expected from one week to the next. More specifically, slope is the average weekly expected increase in the number of words read correctly per minute (Silberglitt & Hintze, 2007). With the repeated measurements inherent in CBM-R, time-series data are produced that indicate individual growth over days, weeks and months (Deno et al., 1986). These types of data make CBM-R more sensitive to change (Deno et al., 1986; Hintze & Christ, 2004; Stage & Jacobsen, 2001). Slope and variability of individual performance are then used to make educational decisions (Deno et al., 1986).
37
for the class, an achievement gaps exists that will likely only widen without intervention (Ardoin et al., 2005). An additional method for assessing performance level is median split. Here, the slope values for the group of students being evaluated are split equally into two groups: top and bottom or higher and lower. The level of performance of each group is compared to the other, which can provide more discriminate information about students’ performance when other methods do not seem to differentiate the level of performance (Fuchs, 2003; Fuchs, Fuchs, & Compton, 2004). Median split is more useful for first grade students, though both dual discrepancy and median split have both emerged as the overall best methods for determining level of performance or responsiveness to intervention (Fuchs, 2003).
38
component of the education process in that it helps education professionals to make informed decisions regarding students’ educational trajectories. Likewise, assessment informs
educators about specific areas appropriate for intervention. Empirically-based Reading Fluency Interventions
Approaches to improving reading fluency have been at the center of much research within the past ten years. A number of intervention studies have been published utilizing a variety of intervention programs and/or techniques such as model reading and guided oral reading. Additionally, several syntheses of reading interventions have been published to determine the most effective reading fluency interventions.
Therrien (2004) conducted a meta-analysis of repeated reading (RR) studies to determine whether RR was effective for improving reading fluency and comprehension. He was also interested in the components within a repeated reading program that are crucial to the success of the program. Effect sizes (ES) were based on either nontransfer measures (i.e., utilizing the same passage for multiple readings) or transfer measures (i.e., students’ ability to read and comprehend a new passage after reading a different passage several times).
39
fluency and comprehension. In addition, they noted that repeated reading has measureable effects on fluency as well as speech pauses and intonation.
A meta-analysis by Chard and colleagues (2002) also examined various components of reading fluency interventions. They found that oral repeated reading by itself resulted in ―significantly better scores for fluency and comprehension‖ (Chard, Vaughn, & Tyler, 2002, p. 389). When an adult modeled the passage for the student as he or she followed along, the student performed better on comprehension measures and had faster reading rates than those who only read a passage repeatedly. Several studies in this synthesis resulted in gains in reading fluency when the student read a text multiple times. Scores on a measure of reading fluency were significantly better when subjects read the same passage three times than when they read it only once. Similar differences were evident on a measure of comprehension as well.
40
41 Chapter 2:
Evaluating Assessment with the HELPS Program The HELPS Program
The Helping Early Literacy with Practice Strategies Program (henceforth referred to as HELPS) was originally designed as a reading fluency program that teachers, teacher-assistants, or even community volunteers can use as a time-efficient supplement to all early readers’ (e.g., second grade students’) core reading curriculum (Begeny, 2007; Begeny, Laugle, Krouse, Lynn, Parker, & Stage, 2008). As such, HELPS does not require extensive training for its successful implementation and it can be implemented in approximately 10 minutes per session (with implementation suggested two to three times per week). Since its development, HELPS has also been implemented (and shown effective) specifically as an intervention program for low-performing readers (Begeny, Mitchell, Whitehouse, & Harris, 2009).
42
and a token economy for student reading behaviors and accomplishments, and (h) verbal cues for students to read with fluency and for comprehension.
In the initial studies evaluating HELPS, instructional materials comprised of 88 passages that ranged in difficulty from the beginning of first grade to the end of fourth grade. The difficulty levels of the passages were calculated using the Spache readability formula (Spache, 1953). Eight passages, representing readability levels from 1.17 to 2.31, were selected from the first grade reading series from Silver, Burdett, and Ginn (Pearson et al., 1989). These passages were used as a more appropriate starting point for lower performing second grade students. The remaining passages were selected from the Dynamic Indicators of Basic Early Literacy Skills, 6th Edition progress monitoring materials (DIBELS; Good & Kaminski, 2002). Readability levels of these passages ranged from 2.27 to 4.99. All passages were sequenced by level of difficulty (Begeny, 2007, in press).
43
Thus far, three separate studies have supported the effectiveness of HELPS. The initial study found that when used as a supplement to second grade students’ core reading program (from February until April), students receiving HELPS significantly improved their basic reading skills (including their reading fluency) when compared to a control group (Begeny et al., 2008a). In a follow up study that again evaluated HELPS as a supplement to second grade students’ core reading curriculum, Begeny (2009) compared the effects of HELPS when implemented at different frequencies. Specifically, one group of students (N = 29) received HELPS three times every two weeks, another group of students (N = 29)
received HELPS six times every two weeks, and a third groups of students (N = 30) served as a control group. Also, in contrast to the more brief study described above, the duration of the Begeny (2009) study lasted from October to April. Preliminary findings from this study confirmed that all students receiving HELPS significantly outperformed students in the control group across various measures of reading skills. Furthermore, students benefitted significantly more on some measures of reading when receiving HELPS six times every two weeks (i.e., approximately every Monday, Wednesday, and Friday) versus three times every two weeks.
44
outperformed the control group across several measures of early reading. Using HELPS as a CBM-R Assessment Tool
HELPS was initially developed as an instructional program for early readers and has been shown to improve reading fluency and comprehension skills for early readers of all ability levels. It was designed to supplement regular classroom literacy instruction, providing additional support to students in a way that requires relatively little instructional time
(Begeny et al., 2008b). Subsequent research demonstrated that HELPS significantly
improved reading fluency and comprehension for second grade struggling readers, and was successfully implemented by teachers, teaching assistants, and community volunteers (Begeny et al., 2009).
45
Martens et al., 2007), but unlike GPGs, they have yet to be explored as predictors of more general reading outcomes.
Purpose and Rationale
The primary purpose of this study is to explore the psychometric characteristics and predictive validity of the three forms of CBM-R progress monitoring that are built within the HELPS Program. The main reasons for this investigation are as follows, all of which speak to limitations of traditional CBM-R progress monitoring: (a) HELPS naturally produces
46 Research Questions and Hypotheses
Based upon this purpose and rationale, the specific research questions and associated hypotheses for this study are as follows:
Research question 1.
Are there statistically significant changes over time in students’ generalization of passage gains to new passages (GPG), as measured by students’ slope of GPGs?
Hypothesis 1.
The bulk of CBM-R research has focused on progress monitoring using students’ WCPM scores for the readings of unfamiliar passages (Fuchs, 1989; 2003; Fuchs et al., 2004; Hintze & Christ, 2004; McGlinchey & Hixson, 2004; Silberglitt & Hintze, 2005; 2007), or evaluating intervention effectiveness based on WCPM scores for either new or practiced passages (Begeny & Martens, 2006; Busch & Reschly, 2007; Fuchs & Fuchs, 2006; Glover & DiPerna, 2007). Over time, particularly when students participate in fluency interventions, students’ WCPM scores tended to increase (Begeny & Martens, 2006; Jones & Wickstrom, 2002; Martens et al., 2007). Thus, it is hypothesized that, as a result of participating in HELPS, students’ slopes for GPGs will be positive over time.
Research question 2.
47 Hypothesis 2.
Increasingly, researchers have evaluated the extent to which CBM-R scores will predict students’ outcomes on end of year assessments such as state-mandated achievement tests (Crawford et al., 2001; Glover & DiPerna, 2007; Good et al., 2001; McGlinchey & Hixson, 2004; Silberglitt & Hintze, 2005; Stage & Jacobsen, 2001). In general, CBM-R scores are useful for predicting broad outcomes of reading achievement, such as the GORT, which can be considered a broad assessment of reading fluency and comprehension. To date, research that shows that students receiving fluency interventions show increases in GORT scores is limited to previous HELPS studies (Begeny, 2009; Begeny et al., 2009). However, research has not evaluated whether CBM-R predicts GORT outcomes. Given that
participation in HELPS results in fluency gains (Begeny, 2009; Begeny et al., 2008b; Begeny et al., 2009) and that CBM-R is useful for predicting broad outcomes of reading
achievement, it is hypothesized that there is a relationship between students’ CBM-R scores and the differences in students’ pre- to post-test scores for the GORT Fluency and
Comprehension subtests. Research question 3.
Are there statistically significant changes over time in students’ immediate passage gains (IPG), as measured by students’ slope of IPGs?
Hypothesis 3.
48
passage preview, etc.) experienced immediate increases in WCPM (Begeny & Silber, 2006; Martens et al., 2007). Martens and colleagues (2007) noted that students’ gains in fluency within each intervention session actually decreased over time. They suggest that this decrease over time indicated that as students performed the first reading at a higher level of fluency, they benefitted less from the fluency training. In other words, the students were reaching their upper fluency limits as the intervention progressed.
Given the paucity of research regarding IPGs over time, the question regarding the changes in students’ slope over time is more exploratory in nature. It has been demonstrated that HELPS, an intervention that includes the various components described above, results in increases in students’ WCPM scores (Begeny, 2009; Begeny et al., 2009). It is likely that, just as with the study conducted by Martens and colleagues (2007), as students’ levels of fluency increase over the course of the intervention their IPGs may actually decrease over time, resulting in a negative slope.
Research question 4.
Are the changes over time in students’ immediate passage gains (IPG), as measured by students’ slope of IPGs, associated with the differences in students’ pre- to post-test scores for measures of reading fluency and comprehension as assessed by the GORT?
Hypothesis 4.
49
are associated with pre- to post-test differences in the GORT is exploratory. If, however, a decrease in students’ slope for IPGs over time indicates that students are reading at a higher level of fluency (Martens et al., 2007), then it is reasonable to hypothesize that these negative changes in performance over time will be associated with changes on outcome measures such as the GORT.
Research question 5.
Are there statistically significant changes over time in students’ retention passage gains (RPG), as measured by students’ slope of RPGs?
Hypothesis 5.
Research evaluating intervention effectiveness typically focuses on students’ IPGs as opposed to RPGs (Daly et al., 1999; Jones & Wickstrom, 2002). However, some research has examined students’ RPGs and shown that, again, with interventions including multiple components, students’ tended to retain their IPGs over the two day period between
intervention sessions (Begeny & Silber, 2006; Martens et al., 2007). To date, there is little research to examine whether RPGs are associated with overall increases in fluency growth over time. Thus, this question is also exploratory. It is possible that students will experience fluency gains over time (Begeny & Silber, 2006; Martens et al., 2007), and that they will retain these gains, though their WCPM scores for retention passages during an intervention session may not be as high as they were for the readings in the session two days prior.
50
hypothesized that there will be significant changes in students’ slope for RPGs over time, such that RPGs will decrease over time.
Research question 6.
Are the changes over time in students’ retention passage gains (RPGs), as measured by students’ slope of RPGs, associated with the differences in students’ pre- to post-test scores for measures of reading fluency and comprehension as assessed by the GORT?
Hypothesis 6.
As with students’ IPGs, students’ RPGs have not been used to predict outcomes. Thus, the question of whether RPGs are associated with pre- to post-test differences in the GORT is exploratory. If students’ RPGs do, in fact, decrease over time as a result of a
51 Chapter 3: Method
The data analyzed in the present study come from a previous study evaluating the implementation of the HELPS Program by teachers in the regular education setting (Begeny et al., 2009).
Participants and Setting
Teacher participants. A total of nine second grade classrooms from one rural school in the southeastern United States participated in the study. Four teachers and each of their teaching assistants were randomly selected to be trained to implement HELPS with low-performing students in their classrooms. Students and teachers from five other classrooms made up the control group. For the purposes of this study, only the teachers who
implemented HELPS (and the students receiving HELPS) will be described. Information about the control group teachers and students can be found in a separate report (Begeny et al., 2009).
Teachers in the HELPS condition had an average of 11.75 years of teaching
experience (range = 4-26 years), and an average of 10 years teaching second grade (range = 3-20 years). HELPS teacher assistants had an average of 2.25 years of teaching experience (range = 1-4 years), and an average of two years’ experience teaching second grade (range = 1-3 years).