7
DESIGN FOR TESTABILITY II: FROM
HIGH LEVEL PERSPECTIVE
Chia Yee Ooi
Norlina Paraman
7.1 CONTEXT
The advantage of a top-down design flow, specifying design a high abstraction level with less implementation specific details, is that design exploration, where design alternatives easily can be explored, is eased. Besides, there is another important advantage: the task of introducing a design for testability (DFT) method is eased too. This is because the model at high abstraction level includes fewer details and therefore the handling of design and test become easier.
7.2 INTRODUCTION
overhead but maintaining a high fault coverage. BIST is a technique of designing additional hardware features into integrated circuits to allow them to perform self testing. Since the need for external automated test equipment (ATE) will be reduced, speed timing will be increased and lower cost of testing.
Scan technique and BIST have been proposed at gate level and high level. However, conventional scan techniques at gate-level which have long test application time due to scan in and scan out process. Therefore by applying DFT method at high-level for example which is at register transfer level (RTL), the number of primitive elements to be dealt in the circuit is reduced (Ghosh and Fujita, 2001). Thus the test generation time is also reduced. At RTL, various DFT methods that have been proposed are integrated automatic test pattern generation (ATPG) and DFT insertion technique using BIST (Carletta and Papachristou, 1995; Ghosh, Jha, and Bhawmik, 1998), scan design (Hsu and Patel, 1998; Huang, et al., 2001; Wada, et al., 2000) and test multiplexers (Dey and Potkonjak, 1994; Ohtake, et al., 2000). DFT at high level can be applied in the early design phase to improve the effectiveness of high-level ATPG. Moreover high level design can be described using an assignment decision diagrams (ADD) (Chaiyakul and Gajski, 1992). ADD is used in high level testing because it is easy for representing the RTL descriptions into its ADD model. Then the DFT method will be introduced to ADD.
7.3 R-GRAPH
In the previous chapter, R-graph is used to model a gate-level circuit. We also derived an R-graph which can model a high level design. R-graph is defined as an ADD representation by using read nodes as input and write nodes as output. The R-graph includes ADD properties of thru function, thru tree and input dependency. Based on these properties, the class of thru-testable ADD is defined.
Definition 1. Let X, Y and Z be a set of variables respectively in ADDwhere X ∩ Z = ∅ and Y ∩ Z = ∅ . A thru function tX Yis
a logic, equality, relational and arithmetic operations such that
i. the operations connectives of the function consist of ∧
(AND), ∨ (OR) and ¬ (NOT), < (LESS THAN), > (MORE THAN) and = (EQUAL);
ii. the operation variables Z of the function and X consist of read nodes while Y consists of write nodes;
iii. the signals at X transfer to Y if Z has an assignment that makes the thru function „true‟ or active (tX Y = 1).
Note that X and Y may have the same variables that make the thru function transfers the signal from one variable to the same variable. This thru function is called self thru function. In other words, thru function is a logic that transfers the same signals from the input to the output if the thru function is active. The bit width of the input and output are equal.
Example 1. Figure 7.1 shows two examples of thru functions. Two thru functions are independent if they cannot be active at the same time. Figure 7.1(a) shows that thru functions tAB and tCB
are dependent. Dependent thru functions transfer signal at the same time and activated by same variable. In this case, signals from A and C are transferred to B at the same time when a1 is true.
Figure 7.1 Thru functions.
independent. This means data transfer from A to B cannot happen at the same time when data transfer from C to B. The former takes place when a1 is true.
To facilitate the implementation of our DFT method, we introduce a graph representation called R-graph which contains the information of connectivity, thru function of an ADD.
Definition 2. An R-graph of an ADD is a directed graph G = (V, A, w, t) that has the following properties.
i. V ∈ V is a read node or write node. If a read node and a write node correspond to the same variable, they are represented by the same vertex;
ii. (vi, vj) ∈ A denotes an arc if there exists a path from the read
node vi to the write node vj;
iii. w:V → Z+ (the set of positive integers) defines the size of
read or write node corresponding to a vertex in V;
iv. t:A → T ∪ {0, 1} (T is a set of thru functions) where t(u, v) =
0 if there is no thru function for (u, v)∈A and t(u, v) is a
thru function that transfers signals from the read node u to the write node v. If t(u, v) = 1 (also called identity thru function), the signal values are transferred from u to v
C
a1
a2
a1
A C
A J
I
B B
directly. Note that identity thru function is always active.
7.4 THRU TESTABILITY
Thru-testable ADD is a class of ADD which is easily testable. Its read nodes are easily observable and its write nodes are easily controllable. The class of thru-testable ADD is defined in the following text.
Using R-graph representation, we visualize a certain set of thru functions as a thru tree, which is defined as follow.
Definition 3. A thru tree is a sub graph of the R-graphsuch that i. it is a directed rooted tree;
ii. there is only one sink (root), which has no outgoing arcs; iii. the sources are vertices that correspond to primary inputs
without incoming arcs;
iv. each arc is labeled with a thru function.
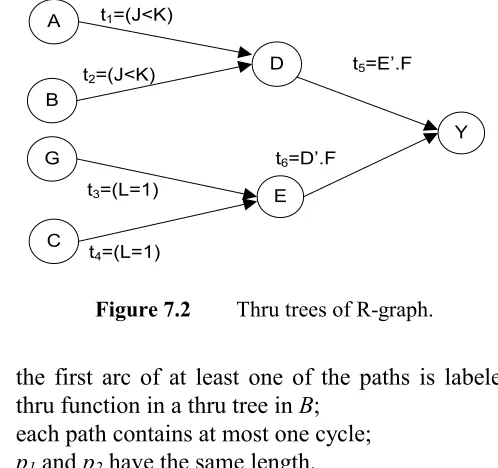
Example 2. Figure 7.2 shows a thru trees of the R-graph. Each arc is labeled with a thru function. The sources are represented by vertices that correspond to primary inputs without incoming arcs.
Definition 4. If Vtiis a set of vertices that activate a thru function
tiin a thru tree Tj, Tj is said to be dependent on Vti. Furthermore, if
Vtiincludes a vertex in a thru tree Tk, Tjis said to be dependenton
Tk.
Definition 5. Let G be the R-graph of ADD S, and let B be a set of thru trees in G. Let (u,v) be a set of all paths starting at u and ending at v. Two distinct paths p1,p2∈(u,v) have input dependency
if the following conditions are satisfied.
Figure 7.2 Thru trees of R-graph.
ii. the first arc of at least one of the paths is labeled with a thru function in a thru tree in B;
iii. each path contains at most one cycle; iv. p1and p2have the same length.
Input dependency can be resolved by self thru functions. Using the newly defined concepts of thru tree and thru function, we can identify whether an ADD of an R-graph is thru-testable or not.
Definition 6. An ADD is called to be thru-testable if the R-graph of the ADD contains a set of disjoint thru trees such that the following conditions are satisfied.
i. The thru trees cover all the vertices of a feedback vertex set.
ii. For any thru tree Ti, Ti is not dependent on itself.
iii. For any pair Ti, Tj of the thru trees, if Ti (resp. Tj) is
dependent on Tj(resp. Ti), Tj(resp. Ti) is not dependent on
Ti (resp. Tj).
iv. For each pair of reconvergent paths p1 and p2, p1 and p2
does not have input dependency.
A
D
C B
E
Y t1=(J<K)
t2=(J<K)
t3=(L=1)
t4=(L=1)
t5=E’.F
t6=D’.F
The thru tree that does not depend on any vertex in any thru tree to become active is called independent thru tree.
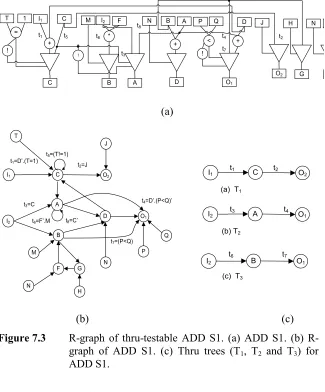
Example 3. Figure 7.3(b) shows the R-graph of the ADD S1. Thru functions t3=C is activated by C. S1 is a thru-testable circuit
because there are three thru trees, namely T1, T2 and T3 (shown in
Figure 7.3(c)) that contain C,B and A which are the vertices in the feedback vertex set (FVS). Moreover, each variable that activate the thru functions in each thru tree is not a vertex in the thru tree. T2 is dependent on T1 because thru function t3 in T2 is activated
vertex by C in T1. But thru functions in T1 do not depend on any
vertex in T2. There is also no input dependency in S1. Note that
node C forms a self loop. Other loops are combination of nodes C, A and D and combination of nodes B, G and F.
7.5 EXTRACT THRU FUNCTIONS FROM A GIVEN ADD
Definition 7. Let A be a read node and B be a write node. A connects to data input of an assignment decision node (ADN) and B connects from the output of the ADN. If data transfer is allowed from path A to B then A is called on-path input.
Definition 8. Let A and B be read nodes and C be a write node. A and B connect to data input of the ADN and C connects from the output of the ADN. If data transfer is allowed from path A to C then B is called off-path input.
Thru functions are extracted from a given ADD and included in R-graph. The procedure consists of the following steps.
Step 1: Identify a set of ADD paths where each path contains one or more of the following
1.1 any input of addition node
I1 C O2 1 T = B M A
I2 B A J
D t1 t3 N C D O1
t4 t2
P F Q G H F N G t6 t5 t7 t8 ! + ! * + ! < + t6 t8 (a)
(b) (c)
Figure 7.3 graph of thru-testable ADD S1. (a) ADD S1. (b)
R-graph of ADD S1. (c) Thru trees (T1, T2 and T3) for ADD S1.
1.4 the first input of division node 1.5 any data input of ADN.
Step 2: Compute the symbolic operations for each line in assignment value part and assignment condition part in terms of variable of read nodes. This is to obtain operational expression for each line. After the symbolic I1 A I2 B D C
t1=D’.(T=1)
t3=C
t2=J
t4=D’.(P<Q)’ O2 O1 M T N P J F G t5=(T!=1)
N
H
Q t6=F’.M
t7=(P<Q) t8=C’
I1 C
t1 t2 O
2
I2 t3 A t4 O1
(a) T1
(b) T2
I2 B O1
t6 t7
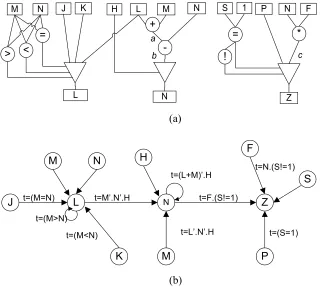
operation of addition in Figure 7.4(a), the operational expression for line a is (L+M).
Step 3: For each operation node (resp. ADN) on each ADD path, identify the logic, equality, relational and arithmetic operations or any combination of the operations that allows the data transfer from the input (resp. data input) of the operation node (resp.ADN) to its output.
3.1 For addition node and subtraction node, the conditions are inversion of the operational expression of the off-path input. For example, in Figure 7.4(a), in addition node in data of L is transferred to line a when the off-path input M is 0. (M‟). In subtraction node, data of line a is transferred to line b when the off-path input N is 0 (N‟).
3.2 For multiplication node and division node, the conditions are the operational expression of the off-path input. In multiplication node in Figure 7.4(a), data of read node N is transferred to line c when the off-path input F is 1 (F).
3.3 For ADN, the condition is the operational expression of the condition input that corresponds to the on-path input. For example in Figure 7.4(a), data of line b is transferred to write node Nwhen H is 1.
K
L
L M
N
P N
Z F J
M N H N S 1
a
b c
* =
-+ =
<
> !
(a)
J L N Z
K M P
N H
S M
t=(M=N) t=M’.N’.H
F
t=(M<N) t=(M>N)
t=L’.N’.H t=(L+M)’.H
t=(S=1) t=F.(S!=1)
t=N.(S!=1)
(b)
Figure 7.4 Thru functions extraction for ADD S2. (a) ADD S2. (b)
R-graph for ADD S2.
7.6 DESIGN FOR TESTABILITY METHOD
Definition 9. Let A be an input vertex and B be an output vertex. Let C be a vertex which activates a thru function tAB, C is called
an activator. If the ADD of the R-graph is not thru-testable, we can augment the R-graph using our DFT method by adding minimum number of edges with thru functions into the R-graph. Therefore, the R-graph becomes thru testable. Steps for DFT method are taken as follows:
the output vertex without considering whether the outgoing arc has a thru function or not. If the vertex is visited for second time, then the vertex is included in the feedback vertex set (FVS).
Step 2 For each vertex, choose the outgoing arc that has a thru function to continue the traversing. Otherwise the traversing is stopped.
Step 3 Group each thru function (TF) in the R-graph into set called TF1, TF2, TF3 and onwards as follows
3.1Initially include the first thru function into TF1.
3.2For any i, include the current thru function into TFi if
the following conditions i&iii or conditions ii&iii are satisfied
i. its input (resp. output) of the current thru function is same with the output (resp. input) of any thru function in TFi.
ii. its output of the current thru function is same with the output of any thru function in TFi and
the activators of the two thru functions are the same.
iii. its activator is different from any input or output of the thru functions in TFi.
3.3Create a new TFj (j≠i) if necessary.
Step 4 Check whether all the vertices in feedback vertex set (FVS) are covered by the generated thru function set. If not, group those vertices into FVS‟.
any thru function in the set.
Step 6 Repeat step 5 until all vertices in FVS‟ are covered by the generated thru function set. If FVS‟ is not empty, link the vertices with thru function such that a new thru function is formed.
Step 7 Check whether each thru function set has a primary input and primary output vertex or not. Otherwise, one primary input vertex (resp. primary output vertex) in the R-graph is included into the set. If R-graph does not have one, a new vertex is added into the set.
Step8 Add a new thru function so that the input (resp. output of the new thru function is the added new input (resp. output) vertex and the output (resp. input) of the new thru function is one of the vertices of any existing thru function sets.
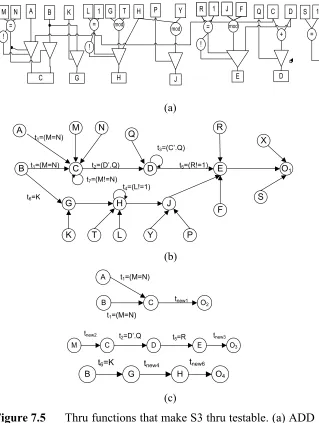
Example 6. Figure 7.5 shows the thru functions that are introduced to make ADD S3 thru-testable. Vertices C, D and H are included in the feedback vertex set (FVS). 3 set of thru function (TF), i.e. TF1 ={tAC, tBC}, TF2 = {tCD, tDE} and TF3
= {tBG} have been generated. A new output vertex O2 and a new
thru function tnew1 are added into R-graph of set TF1. Set of TF2
hasalso two new thru functions tnew2 and tnew3 which are connected
to vertex M and new output vertex O3. TF3 are added
with new thru functions tnew4 and tnew5. Vertex H is included in set
of FVS‟ because vertex H is not included in any generated thru function set. It is connected with vertex G and new output O4 with
new thru functions.
7.7 CASE STUDIES
B
C
E
O1
A
M N C S 1
D
Q D
H
L T
G
K G X
mod H 1 Y J P mod J 1 V J U
E 1 R F = ! = ! ! = + = mod mod (a)
B C D E
G H J
M Q O1 A t1=(M=N) t2=(D’.Q) R t3=(C’.Q) t5=(R!=1) t1=(M=N) K L t6=K N S X t4=(L!=1) t7=(M!=N)
T Y P
F
(b)
B C tnew1 O2
A t1=(M=N)
t1=(M=N)
C D E
t2=D’.Q t5=R
M O3
tnew2 tnew3
B G H tnew4
O4
tnew6
t6=K
(c)
Figure 7.5 Thru functions that make S3 thru testable. (a) ADD S3. (b) R-graphof ADD S3. (c) Set of thru function sets (TF1, TF2 and TF3).
original circuits and conventional full scan technique circuits in terms of fault efficiency, area overhead, test generation time and test application time. We expect our proposed DFT method will obtain complete fault efficiency. We expect the area overhead of the circuit with our DFT will be higher than that of the original circuit but same with the full scan circuit. Less test generation time is expected in circuit with our DFT compared to the original circuit and full scan circuit. For test application time, it is less than the full scan circuit but not so more than the original circuit.
7.8 CHAPTER SUMMARY
In conclusion, the new class of ADD called thru-testable ADD has been introduced. The DFT method has also been introduced to augment a given ADD with minimum thru function so that the ADD becomes thru-testable. We expect our proposed DFT method will achieve complete fault efficiency, lower area overhead, less test generation time and less test application time. For future work, we are going to describe the test generation model forthru-testable ADD.
REFERENCES
Abramovici, M., M. A. Breuer and A. D. Friedman. (1990). Digital Systems Testing and Testable Design. IEEE Press.
Carletta, J. E. and C. Papachristou. (1995). Testability analysis and insertion of RTL circuits based on pseudorandom BIST. Proc. Int. Conf. Computer Design. :162-167.
Chaiyakul, V. and D. D. Gajski. (1992). Assignment decision diagram for high level synthesis. Technical Report. :5-50. Cheng, K. T. and V. D. Agrawal. (1990). A partial scan method for
sequential circuits with feedback. IEEE Trans. Computer. 39:544-548.
International Conference on Computer Design. : 25-431. Chickermane, V. and S. M. Reddy. (1990). An optimization based
approach to the partial scan design problem. Pro International Test Conference. :377-386.
Chiu, S. S. K. and C. Papachristou. (1991). A Built-In-Self-Testing approach for minimizing hardware overhead. Pro International Test Conference. :282-285.
Dey, S. and M. Potkonjak. (1994). Nonscan design-for-testability of RT-level data paths. Proc. Int. Conf. Computer-Aided Design. :645.
Fujiwara, H. (1985). Logic Testing and Design for Testability. MIT Press.
Ghosh, I., N. K. Jha and S. Bhawmik. (1998). A BIST scheme for RTL controller/data paths based on symbolic testability analysis. Proc. Design Automation Conf. :554-559.
Ghosh, I. and M. Fujita. (2001). Automatic test pattern generation for functional register-transfer level circuits using assignment decision diagrams. IEEE Trans. Computer-Aided Design. 20(3):402-415.
Gupta, R. and M. A. Breuer. (1990). The BALLAST methodology for structured partial scan design. IEEE Trans. Computer. 39(4):538-544.
Hsu, F. F. and J. H. Patel. (1998). High level variable selection for partial scan implementation. Proc. Int. Conf. Computer-Aided Design. :79-84.
Huang, Y. et al. (2001). On RTL scan design. International Test Conference. :728-737.
Ohtake, S., H. Wada, T. Masuzawa and Hideo Fujiwara. (2000). A non-scan DFT method at register-transfer level to achieve complete fault efficiency. Proc. of Asia and South Pacific Design Automation 2000. :599-604.