University of Windsor University of Windsor
Scholarship at UWindsor
Scholarship at UWindsor
Electronic Theses and Dissertations Theses, Dissertations, and Major Papers
1-1-1964
The effect of majority opinion on the creative school child.
The effect of majority opinion on the creative school child.
Reta L. Stone University of Windsor
Follow this and additional works at: https://scholar.uwindsor.ca/etd
Recommended Citation Recommended Citation
Stone, Reta L., "The effect of majority opinion on the creative school child." (1964). Electronic Theses and Dissertations. 6370.
https://scholar.uwindsor.ca/etd/6370
NOTE TO USERS
Page(s) not included in the original manuscript and are unavailable from the author or university. The m anuscript
was scanned as received.
Missing Pages 57 - 59
til EFFECT OF MAJOBITT OPINION ON THE CREATIVE SCHOOL CHILD
by
Beta L* Stone
B.A. University of British Columbia, 1949
A Thesis
Submitted to the Faculty of Graduate Studies through the Departaent of Psychology in
Partial Fulfillment of the Rsfutrsttsiits for the Degree of .Master of Arts
at the
University of Windsor
UMI N um ber: EC52551
INFORMATION TO USERS
The quality of this reproduction is dependent upon the quality of the copy submitted. Broken or indistinct print, colored or poor quality illustrations and photographs, print bleed-through, substandard margins, and im proper alignm ent can adversely affect reproduction.
In the unlikely event that the author did not send a com plete m anuscript and there are missing pages, these will be noted. Also, if unauthorized copyright material had to be removed, a note will indicate the deletion.
®
UMI
UMI Microform EC52551 Copyright 2008 by ProQuest LLC.
All rights reserved. This m icroform edition is protected against unauthorized copying under Title 17, United States Code.
m S OF C0NTEKT3
ABSTRACT . . . . . . . . . . iii
... v
LIST OF TABLES vi
LIST OF FIGURES . . . . . . . . . vii
Chapter
I IHT1QBUCTI0H 1
Background of Related Research • . • 3
The Problem » • « • • « • 14
Chapter
II METHOD • • . 16
Subjects 16
Stltotlon • * . . * » • *
16
Tost of Qonf&mltj * « • • • • 16
Design of tha Sapor Lstental Situation • 19
Procedure • • • • • • • 22
Chapter
III RESULTS , 24
Chapter
IV DI30USSIGK AMD CQKCLUSXON . . . . . 34
Discussion . . • • • « • • 34
Conclusion • * . * • • • • 40
AFPUIDIX A 42
A P P M ) K ® . . . . . . . . . . 46
BIBLIOGRAPHI . . . . . . . . . . 55
A B '3 T R A C T
This study- was sn attempt to explore ths relationship
between creativity and intelligence and Children's behaviour
in a situation where they are confrontsd by a group of thoir
poors giving unaninous incorrect answers on a simple percept
ual test#
The experimental subjects were divided into four groups
on the basis of X*Q* scores and scores on a test of creative
thinking# The four groups weret A# high on both tests,
B» high on creative thinking, average on I.Q*, C# high on
X#Q# and average or lower on creative thinking, D. average
on 1«Q« and average or lower on creative thinking#
The perceptual test consisted of twelve pairs of white
cards# Bach pair consisted of one card with a single black
line and the other with three black lines* The task was to
judge which of the three lines on the one card was egual in
length to the single line on the other card of the pair*
Bach of the experimental subjects took the perceptual
test in company with a group of six peers who had been
instructed to give incorrect answers to eight of the twelve
A 1 S T E A S T (cont'd,)
An analysis of variance, with a co-variance adjustment
for the sex factor, did not yield statistically significant
differences between the total nuaber of tines subjects in
each of the four groups •followed1* the "Majority* group's
answers* When two groups were distinguished on the basis
of sex it was found that although the groups were virtually
the sane on creativity and Intelligence scores, the differ
ences on the "following" scores was significant at the .01
P E S F A G E
The author wishes to express appreciation to Rev* M* A,
Record, C.S.B. under whose direction this study was under*
taken and also Or. J. Callagan and Or. A. A. Snith for
advice and guidance. Thanks are also due to the officials
of the Windsor Public School system and especially to the
principal, teachers and pupils of Ada* C« Richards school*
Appreciation is also expressed to Dr. 1. P. Torrance
for his kind permission to use the Minnesota Tests of
LIST OF TABLES
Table Page
1 Number of Subjects in Each Grade.
Humber of Boys and Girls in Each Grade • 16
2 Humber of Boys and Girls in each of Four
Experimental Groups, A,B,C, and D • * IS
3 Lengths of Standard and Comparison Lines,
the Per Cent of Correct Judgments made by the Subjects on the First Presentation, the Responses of the "Majority** Group in
the Experimental Situation* . . . . 21
4 Bata Concerning the Subjects in Experimental
Group A » # • • • . * * . 29
5 Data Concerning the Subjects in Experimental
Group 5 • • • « • • • * • 29
6
Data Concerning the Subjects in ExperimentalGroup C * • • » • • • • • 30
7 Data Concerning the Subjects in Experimental
Group 0 * • * • • • * * • 30
$ Analysis of Variance and Co-variance Adjust
ments for the "Following" Scores of Subjects Grouped on the Basis of Intelligence and
Creativity* 32
9 Means and Standard Deviations for X*Q* Scores,
Creativity Scores and "Following" Scores for
Boys Group (11*26) and Girls Group (M"26) • 33
10 Comparison of the Ranges of Scores, the Medians
and Interquartile Range at Each Grade Level
on the Minnesota Tests of Creative Thinking 36
LIST Of FIGURES
Figure
1 Distribution of the Scores on the
Minnesota Tests of Creative Thinking.
F e w VII
*
...
2 Distribution of the Scores on the
Minnesota Tests of Creative Thinking,
Fora VII • » • » • • • •
3 Distribution of the Scores on the
Minnesota Tests of Creative Thinking,
Fora VII • • * • • • » •
4 Distribution of the Scores on the
Minnesota Tests of Croativ® Thinking,
For® VII • • • • • • • •
5 Distribution of the Scores on the
Minnesota Tests of Creative Thinking,
Fora VII • • • • • # « •
6
Median Scores for lath Grad# on theMinnesota Tests of Creative Thinking •
7 Relationship of Kean "Following* Scores
for Groups A,B,C, and D both before
and after adjustment for sex factor *
B
Developmental Curve for Median Scoreson Minnesota Tests of Creative Thinking,
Fora VII, obtained in this study * #
9 Developmental Curve for Mean Frequency
of Questions asked on part 1,
Aak-and-Qusss Test, 8, P* Torrance • • * •
C H A P T E R 1
I H T R O D U C T I O H
Creativity has interested mankind through all of
history, hut no systematic study has been attemptad until
recent years*
The concept of intelligence has engaged the interest
and attention of philosophers, psychologists and others
down through the ages* The work of Simon, Binet and
Weehsler at the end of the 19th and early in the 20th
century focused attention on the measurement of intelligence*
This area of research and study has been dominant until
recently* Since 1950, however, attention has begun to turn
more to other factors involved in learning* The concept
of creativity is receiving increasing attention.
As early as ld9&» G* V* Dearborn {1S9S, p* 1B3-190)
had observed, though rather casually, that giftedness in
intelligence and creativity were by no means synonomous*
By 1946 this observation had become a commonplace finding
but even today intelligence tests are essentially the same
and for most purposes, certainly in the school situation,
2
the Intelligence test score has been taken to be a
compreh-eneive representation of a child*s intellectual capacity*
In 1950, J. P. Guilford (1950, p. 444-454), speaking
before the American Psychological Association, described
research which he had recently begun, stated hypotheses
he had developed and outlined plans for the study of the
subject of creativity. His talk heralded a widespread
interest in scientific research into the whole study of
creativity - its definition, identification and develop
ment. This interest is reflected in the increasing number
of conferences being held on the subject and the growing
literature in psychology and education on this topic.
The recent, growing, world-wide concern about maximum
use of human potential has also been influential in the
development of this interest. As G* W. Taylor (1964, p* 3)
stateds "If we are to survive in international competition,
our most promising solution to this manpower problem is
for this nation to encourage and support the identific
ation and development of various types of important personnel.
One such type is the highly creative person, for even a few
such persons in science can keep our scientific movement
vigorously in front." The interest of the general public
3
during the lest few months in such publications as Reader* s
Digest and Parents Ktgftslns*
Background of Related Research
Intelligence and Creativity are not the Sane Thing
It has become generally accepted by researchers that
high intelligence as measured by X,Q* tests, and creative
ability, are not the sane thing, although, of course, they
may be found in the s m s person*
Guilford (1950# p* 447) states, “When we look into the
nature of intelligence tests, we encounter many doubts con*
corning their coverage of creative abilities#**An examination
of the content of intelligence tests reveals very little
that is of an obviously creative nature# Binet did include
a few Items of this nature in his scale...Group tests of
Intelligence have generally omitted such items entirely#»
Guilford*s conception of intelligence Is based on a factorial
theory* Through factorial analysis he has defined some
forty or so different Intellectual factors# ; e feels that
the typical intelligence test measures perhaps not more
than a half dozen of these and that there are also probably
several non-intellectual factors which contribute to success*
4
obviously creative la characters sensitivity to problems;
fluency (the ability to produce a larger number of Ideas);
ability to produce novel ideas; flexibility of mind; a
synthesising ability; an analysing ability; an ability to
organise and redefine; and an ability to re-evaluate.
There are probably other additional factors# Guilford also
recognises that creative productivity is undoubtedly depend
ent upon primary traits other than abilities - factors such
as motivation and temperament.
L. L# Thurstons (1952, p. 20) asserts. "To be extremely
Intelligent is not the same as to be gifted in creative
work. This may be taken as an hypothesis."
John E. Anderson (1956, p. 19) discussing The Nature
states that
.».within a group of brighter children some separation
can be made of those who are essentially orthodox and
conformist in their intellectual processes and those
who are not. ho must be careful here not to confuse
social conformity with intellectual conformity.
Irrespective of social conformity, some who score very
high on tests are id nationally very conforming and
accepting, while others are questioning and search
very high on intelligence tests are in life situations,
not only satisfied with routines but show little tend
ency to break away from routine types of thinking or
to manipulate ideas logically or creatively. Whether
these tendencies are habits that grow out of earlier
experience or are characteristics Which differentiate
types of thinking is not yet clear*
Getsels and Jackson have emphasised that understanding
of gifted children, those who do achieve or produce, has
been limited by a "too heavy reliance on the concept of
intelligence as reflected in the intelligence test*” They
state that (1962, p* 3)
Although the correlation between the I*Q* and learning
is positive - and we ought to say at once that we
recognise the I*Q* as probably the best single measure
we have - it nevertheless, rarely accounts for more
than one quarter of the variance in such crucial factors
as school achievement and academic performance*•♦More
over, it is commonly observed that many children who
are very high in intelligence as measured by I*J* are
not concealttantly high in such other intellectual
functions as creativity, and many children who are very
intelligence as measured by I*Q«
E* P. Torrance (1962),
in
discussing deflelences oftraditional X.Q* tests, points out that aaphasis in such
tests has been on the convergent, conforming type of think
ing. He mentions a comment by I. A. Taylor at the Third
(1959) University of Utah Research Conference on the
Identification of Creative scientific Talent, to the effect
that intelligence is "an invention of Western culture" and
that It selects and stresses the values important in our
society. Torrance discusses other deficiencies such as
over-emphasising certain academic values because they have
been important in the past and considering talent, creativity
and ability to conform as being the same thing or necessarily
found in the same person* A limitation found especially on
group tests of intelligence is the restriction on divergent
thinking imposed by multiple choice type questions* Ho
allowance is made for unique ideas though they may be correct*
Torrance and his associates at the University of Minn
esota, following a similar procedure to one used by Getzels
and Jackson, (1962) found comparable results* Both procedures
were as follows* Two .groups of children were differentiated
-a highly intelligent group r-anked in the upper twenty per
creative group ranked in the upper twenty par cent on
creative thinking tests hut not on intelligence. Though
the overlap was nail# those who were in the upper twenty
per cent on both were eliminated. It wee found that if
children were identified as gifted on the basis of intelligence
tests alone, approximately seventy per cent of the most
creative would be eliminated* Although there was an average
difference of over twenty-five I*Q. points between these
groups, there were no statistically significant differences
in any of the measures of school achievement (e*g# Oates
Heading, Iowa Basic Skills) used# Personality and envir
onmental factors were not considered in this Study*
Characteristics of the Creative Person
Although there have been numerous and varied studies
done in attempts to investigate the personality characterist
ics of creative individuals, not many of them have dealt
with children.
One study by Weisberg and Springer (1961) of gifted
fourth graders, rated highly creative children significantly
higher on strength of self-image, ease of early recall,
humour, availability of Oedipal anxiety and also uneven ego
development#
£• P* Torrance (1962, p. 66) has compiled a list of
Among the characteristics listed by Torrance the following
seemed of particular interest in the present study? a
tolerance of ambiguity! a tendency to question authority!
a non-conforming or divergent manner of thinking! an ability
to withdraw, be alone, not dependent on others*
Studies by Torrance (1962, p* 76) of fsally and school
situations indicate that the creative child is often not
the favorite of either teacher or parents* Teaehers and
peers agree In nominating him moot often for having wild
or si U y Ideas* Their work is characterised by ideas
"off the beaten track" or "outside the sold" and also by
humour, playfulness, relaxation and lack of rigidity*
Carl Rogers feels that the individual creates primarily
not because of any likely material reward but because it
satisfies soate need within himself* He mentions (1954,
p* 249*260) three inner conditions necessary for constructive
creativity! 1) an openness to experience which means lack
of rigidity, permeability of boundaries in concepts, beliefs,
perceptions, and hypotheses which implies a tolerance of
ambiguity, an ability to receive conflicting information
without the need to resolve the conflict immediately! 2)
an internal locus of evaluation! the value of a person's
of others but by himself, 3) the ability to "toy* with or
manipulate elements and concepts.
Cross-cultural studies being carried out by Terrenes
and his associates indicate varying developmental patterns
in other cultures. Thus far In the study, one of the concl
usions would seem to be that there is a relationship between
the development of creativity in the Individual and cultural
Influences and discontinuities* The indication seems to be
that in cultures which have a high degree to continuity,
the development of th% % m m t m Abilities also shew* more
the drop in the developmental curve
at the grade four level may be related to the increased
pressure felt by the child as he moves from the primary
grades to the interned iats grades where different methods
are used sad different are made*
Developmental Curves
The literature concerning the stages of creative
development offers several interesting observations. Early
in this century Kirkpatrick (1900) found that children in
the first three grades are more imaginative than children
in the fourth, fifth and sixth grades* Simpson (1922)
found a low point at the beginning of the third grade with
an Increase by the end of the year followed by an upward
10
Mearna {1911} stated that creative activity enjoys
free expression during the first three grades with sons
remaining in the fourth azid fifth grades and then a rapid
decline in the sixth and seventh grades*
Wilt (1959) describes a decline in creativity occurring
about the fourth grade during shat she calls the "stag© of
realism** and "gang ago1** She feels that this decline is
due to a need to conform to peer group standards and she
reports that much of the freedom of expression and thinking
disappears and in art more emphasis is placed on clothes,
symbols become stiff and male and female roles assume import**
anee* She feels that it is only an unusual child that is
able to resist the pressures to conform at this stage*
It will be seen that although the general trends are
similar sob* discrepancies occur* there are several
explanations* Although many workers have made observations
concerning the development of creative thinking abilities*
these have usually been only observations not systematic
investigations and have often not been carefully documented*
A wide variety of measures of creativity have been used and
also widely varying samples have been studied* Studies have
been mainly &ras«’8ect±onal and have usually been limited to
relatively Short spans of time, for example, the pre**achool
31
limited continuity. It Is only recently that any uniform
measures which may be used oyer the whole age range bare
been developed.
As with all Interpretations of age-level characteristics*
certain cautions must be observed. Although it is possible
to identify certain prominent characteristics within a
particular age group* allowance must always be made for
individual differences* Bather than looking for a norm of
average behaviour at any particular age* It is preferable
to look for the range of possible behaviour.
The group working at the Minnesota Bureau of Educational
Research have made an attempt to develop tasks suitable for
studying creative development over a wide age span. Growth
curves have been developed for grades one through twelve
and the graduate level. The general pattern of most of the
creative thinking abilities so far studied is as follows*
a steady increase from the first through the third grade)
a sharp decrease between the third and fourth grade followed
by some recovery during the fifth and sixth grades; another
drop between the sixth and seventh grades followed by growth
until the end of high school years. A major exception ia
the ability to formulate causal hypotheses. Although It
begins to develop slowly, it continues without the slump
Possible explanation# for this developmental phenomenon
may be found in many planes in research and theory in child
development* Harry Stack Sullivan (1953) sees a transition
period occurring between third and fourth grades during
which time the child is acquiring the skills of social
subordination and accc®mGdation, ostracism, and compromise.
He feels that by this time a careful sorting out of that
which is agreed to by authorities has been accomplished and
unusual ideas are laughed at, ridiculed, condemned* Others
are seen as source® of ridicule, and humiliation? therefore
communication with others becomes restricted, less free and
easy*
From an educational point of view, new stresses are
occurring at this period as the child moves from primary
to intermediate gradds# Such periods of new stress are
generally accompanied fey a decreased performance* Maalow
(1954) has used a hierarchy of needs which must fee satisfied
in order to allow the individual to move forward in growth.
He feels that as a child*s safety needs are satisfied,
higher needs and Impulses are. permitted to emerge* Where
a situation is admiring, praising, accepting, safe, gratify
ing, reassuring, supporting, ^threatening, non-valuing,
13
other feelings end drives. But society, in terns of
both peer groups end sehool-rooa situation and likely also
parental pressures, seem to suddenly stake extra demands on
children at this particular age.
M m
P. Torrance (1961) has reported on a continuingstudy investigating factors affecting the development of
creative thinking abilities in children* He has found that
the factors in nature and society which affect this develop
ment includes 1} the educational level at which the child
is. 2) different ways of handling and different behaviour
expected from boys as opposed to girls. 3) premature attempts
to eliminate phantasy. 4) restrictions on manipulativeness
and curiosity. 5) conditions resulting in both fear and
timidity in authToity and peer relations, 6) misplaced
emphasis on certain verbal skills. 7) over-emphasis on
prevention of error and emphasise the need for success. 3)
lack of resources for working out ideas; children are taught
what to think rather than how to think.
A Study of Group Pressures
In The Infiuance of tJi^_Qroiffl^on,..the Judgmsatsof
Children* Ruth W. Berenda (1930) usee simple perceptual
material in an experimental situation designed to consider
14
results indicate that rfien an individual child ia confronted
with a majority of his own classmates giving unanimous,
incorrect responses on simple perceptual material, there is
a statistically significant change in the judgments of the
experimental children in the direction of the group, she
found no significant relation between I.Q* and "following”.
The Problem
Several implications which are significant to the
present research merge from this background material. The
creativity of an individual is as likely as is his intellig
ence to influence the us® he makes of his abilities. Persons
who are highly creative tend to be able to accept the tension
of conflicting informatIon more easily, they are more
inclined to give unconventional responses; they worry less
about what others will think; they have a stronger and better
developed self-image; they will conform less to group pressure.
The purpose of the present research is to study the
relationship between creativity and children*a reaction to
group pressure. The hypothesis considered is that children
who score in the top 20 per cent in their grade level on
tests of creativity are less likely to give inoorrect answers
being given by their peers, then are children who score
C H A P T S B
II
9SETH0D
Sub
jestsOne hundred and sixty-eight children In grades two
through six of a Windsor public school were used in this
study. They 'ranged in age frost seven to twelve years and
included both boys- and girls# Table 1 gives a summary of
data concerning these children.
fable 1
Number of Subjects in Each Grade, Number of Boys and Girls
in Each Grade*
Grade fo# of Subjects !?&• of Boys No* of Girls
2 24 ii 13
3
28 n 174
33
20 135
39
22 176 44 23 21
Selection
Two tests were administered to all the subjects as
criteria to be used in selecting the four experimental
17
the Minnesota Tosts of Creative thinking and the Dominion
Group Test of Learning Capacity,
Fosm
B* Further descriptionof these tests say be found in Appendix S.
In grades four, five and six, the four sub-tests of the
Creative Thinking Battery were administered as a ©roup test
with each child writing down hi® own answers* In grades
two and three the two sub-tests which required verbal
responses were administered individually in order to eliminate
any handicap which the mechanics of spelling and writing
(or printing) would impose on the child. The tests were
scored and placed in rank order for each grade separately.
T.Q* scores for all pupils were also computed and listed
together with the creativity score.
On the basis of these two tests, four groups were
chosen. Group A was composed of children who scored above
the 60th percentile in their own grade on the Minnesota
tests and received an I.Q. score of U S or above. Group 8
was composed of children who scored above the Both percent
ile on the creativity tests but who received an I.Q* score
between 9B and 114* Group
0
was composed of children whoscored below the 60th percentile on the creativity teste
and received an I*Q. score of 116 or above. Group 0 was
composed of children who scored below the 60th percentile
18
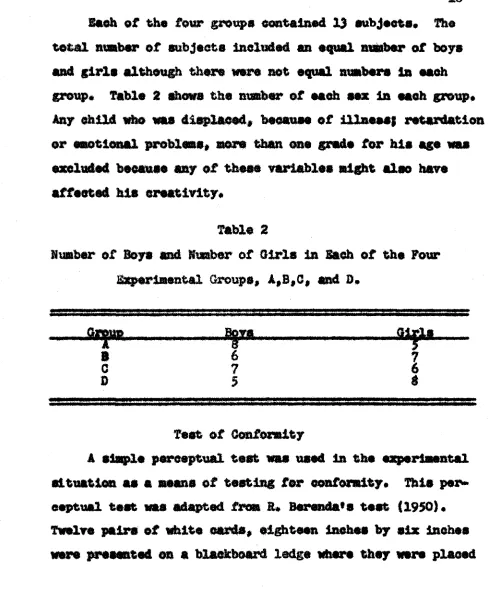
Each of the four groups contained 3J subject*. The
total ambe r of subjects included an equal a m b e r of boys
and girls although there were not equal ambers in each
group. Table ft Shows the a m b e r of each sea in eaeh group.
Any child who was displaced* because of illaeaef retardation
or emotional problems* more than m e grade for his age was
excluded because any of these variable® night also h a m
affected his creativity.
If umber of leys and limber of Girls in Each of the Pour
ftaperlmsntal Groups* A*BfG* and D.
A sla^le perceptual test was used in the eaqmrimental
situation as a means of testing for conformity. This per*
eeptual test was adapted from ft. Berenda’s test (1950)«
Twelve pairs' of white cards* eighteen inches by six inches
were presented on a blackboard ledge where they were placed
Table
fti G
ft
6
7
5
19
three feet apart, One card of each pair, the standard, M a c
\
contained a single fealek line one quarter inch wide and.
the other card, the eosipartsen, contained three black lines,
one of which to on the standard
card* The directions were as follows* "I hare here at the
right one line* On the other aide* 1 have a card with three
lines* You see that the three lines are not the sane sise*
ton also see that the lines are numbered one, two and three*
There is one line that is Just as long as the one line on
this card (pointing to the standard) * When X pet up the
two cards you will write your answer# on your paper*1*
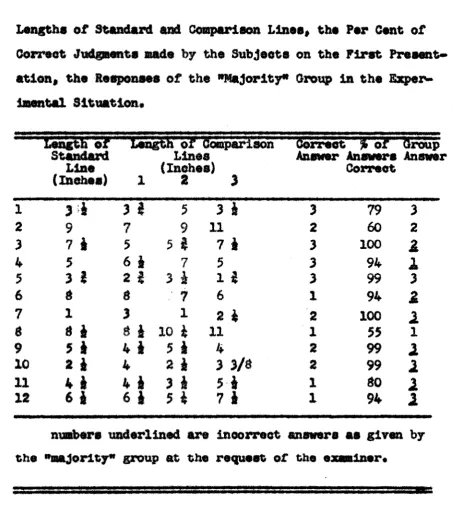
All pupils in the fir© grades, ineluding the subjects
selected for the ©xperiaenta! groups, were given this
perceptual test and, on the basis of these results, eight
Judgments which were among the easiest to make were selected
to be used as ones to which the «aaJority** would give ineorr*
set responses during the experimental situation* thus orovid-*
ing a pressure situation in which to observe the reactions
of the experimental subjects* Table 3 gives the data
con-earning the perceptual test.
Design of the Experimental Situation
A group of aim children, three boys and three girls,
during the experimental situation* A sociometric technique
was used to identify children with whom classmates did not
wish to associate and who would -therefore bo unsatisfactory
aa members of the majority group* The technique wao oe
followss the children in eaoh grade were asked to pretend
that the next day wao their birthday and their mother had
aaid they oould invite one friend to go to the show (movies)
with them* They were told to write down the name of the
one person in their class that they would invite* They
were then told that it turned out that friend oould not go
and ao they were to write down the name of the person they
would invite Instead* Again that person oould not go and
they were told to pick another friend* The results of
these choices were tabulated, three, points being given for
a first choice, two for a second and one for a third* In
choosing the children for the “majority* group, those who
received the highest scores (excluding pupils already chosen
for the four eaqperimental groups
A,
0,0 and 0) were chosen*The purpose of the "majority* group was to give incorrect
answers to the eight judgments on the perceptual test which
was administered again* Each of the experimental subjects
took the perceptual test a second time in company with the
"majority* group from his own classroom* The answers of
21
Table 1
lengths of Standard and Comparison Lines, the Per Cent of
Correct lodgments made bp the Subjects on the First Present*
ation* the Responses of the "Majority* Croup in the Exper
imental Situation*
1I«5^^r^C5SiSH^TTf^5arI^r^SSrrect^nSFTroup
Standard Lines Answer Answers Answer
Line (Inches) Correct
(mohaa) 1 2 3
1 3 >i 3 I
5
3 ft 3 79 32 9
7
9 11 2 60 23
7
i 55 1
7
ft 3 100 14 5 6
|
75
3 94X
5 3 1
2 |
3 4
i 4
3 99 36
a
S:
7 6 1 944
7
l
3 12 4
2 1001
$
s
|
* 4
10 4
3d 3* 1 55 19
5 i 4 i5
4
42
99 210 2 | 4
2 4
3 3/S 2 99 211 4 $ 4
4
3 ft5 4
1 SO 212
6
| 6 1 5 4 7 1 1 94 2matters underlined are incorrect answers as given by
22
the number of times he “followed* the "majority* group in
answers given, that Is, the number of times he conformed
to the pressure of the group#
A Two-way analysis of variance technique was used to
determine whether there was significantly less "following*
by the children who scored above the
doth
percentile thanby the children who scored below the 60th percentile, with
the intelligence factor controlled*
. Procedure
On the day that the testing was to be done to determine
which of the children would "follow" the "majority" group
in giving incorrect answers, the teachers were requested to
send the "critical" subjects, i,s* those children ehosen
for Groups A,B,0or 0, to the school library with work to
occupy themselves# .After they left the room, the "majority"
group were sent to another room where the experimental test
ing was to be done* They were instructed thoroughly about
the procedure to be followed* They were told they would be
taking the perceptual test again* they were requested to
give incorrect answers to eight of the judgnents# They were
given practice on their responses and the way in which they
They were instructed to alt In a particular order with a
apace left between the fifth and sixth child for the class
mate who aould Join than for the teat* The ©hu d who was
to alt in the first ©hair was given the answers that were
to be used and all the other children were Instructed to
give the sane answers as he did*
The *fcajority» group was then asked to return to the
hall and pretend to be arriving at the testing room at the
sane time as each individual “critical" subject wao brought
to the room from the school library*
The perceptual test was then presented with these
modified directions - "Ton will remember I showed you these
lines before* I have here at the right one line* On the
other side* I have a card with three lines* Ton see that
the three lines are not the same else* Ton also see that
the lines are numbered one, two and three* There is one
line among these three that is just as long as the one line
on this card (pointing to the standard). When I put up the
two cards* you will not write your answers as you did last
time* but each of you will give your answer out loud*" Al
though a pretense was made at recording the answers of all
the children* only the answers of the "critical" child each
C H A P T E R m
u d u i n
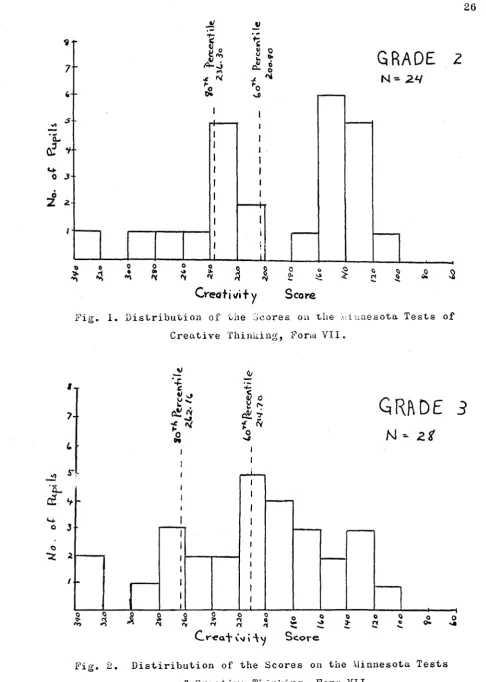
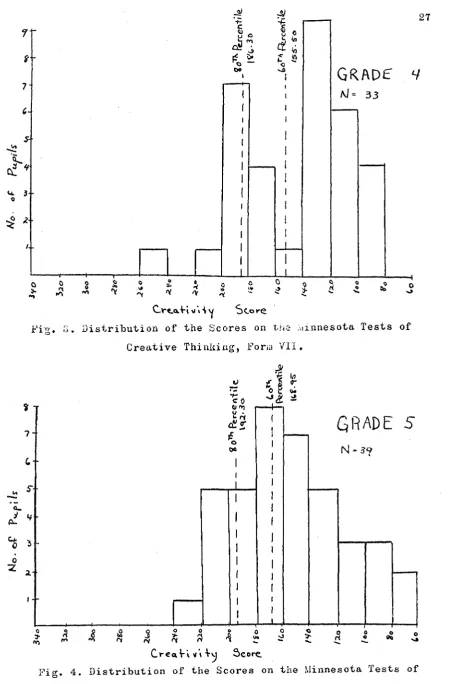
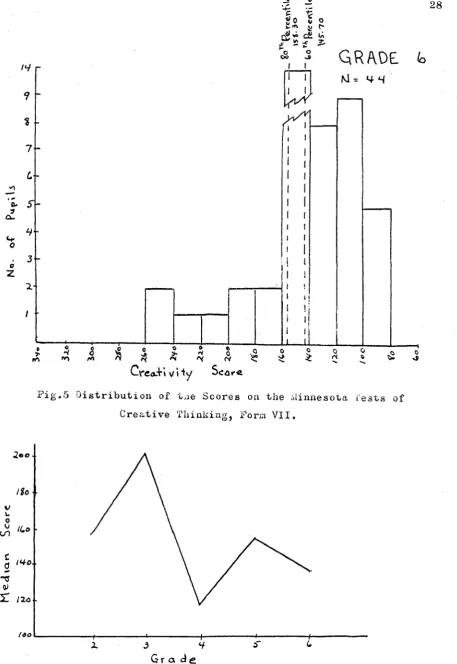
Figures 1 to 5 illustrate the distribution of scores
for each grad® on the Abbreviated Fora VII Minnesota Teats
of Creative Thinking. The $0th percentile and the 60th
percentile for each grade is indicated* These were the
cut off points used in selecting the four experimental
groups#
The scores received by grade 2 and 3 pupils were
generally higher than for the other three grades* The
seores in grades two and three also covered a wider range*
The medians for each grade were also calculated*
Fig* 6 shows the curve for the median score obtained at
each grade level* This curve follows very closely the
developmental curves that Torrance and his associates have
found for most of the creative thinking abilities*
Tables 4 to 7 summarise the information concerning the
subjects in each of the four groups selected - the I*Q*
scores* scores on the test of creative thinking, age, grade,
sax and the number of times they followed the "ma jority"
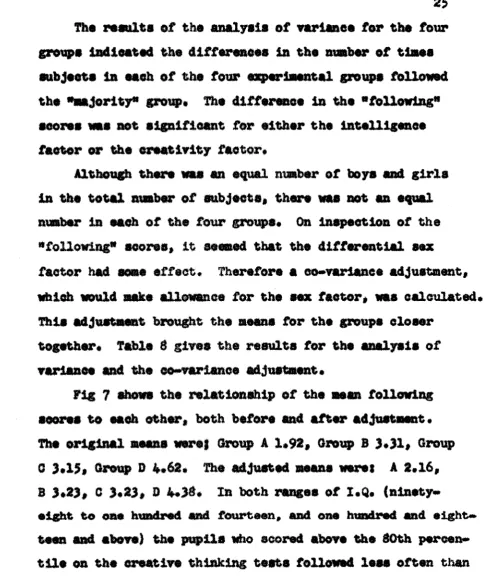
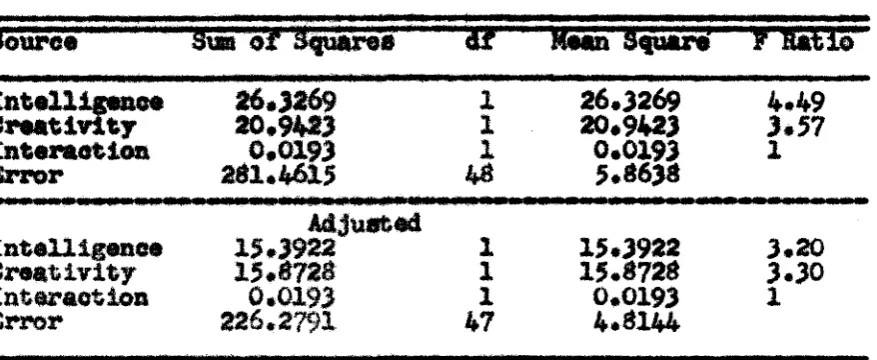
The results of the analysis of variance for tho four
grotto indicated tho differences la tho number of times
subjects to each of tho four experimental groups followed
tho "majority* grot#* The dlffere&ee la tho "following”
scores woo not significant for wither tho intolligoaeo
footer or tho creativity factor.
Although there wao an equal number of boys and girls
in tho total number of subjects, there was not am equal
number in each of tho four g r o u p s * on inspection of the
"following” scores, it seemed that tho differential sox
factor had seme effect* Therefore a co-variance adjustment,
which would make allowance for the sex factor, was calculated*
This adjustment brought the aeons for the groups closer
together* Table 6 gives the results for tho analysis of
variance and the eo-varianc© adjustment*
fig 7 shows tho relationship of the Bean following
scores to each other, both before and after adjustment*
The original means weref lineup A 1*92, Group B 1*31, Grot#
C 3*1$, Group D 4.62. The adjusted means worst A 2*16,
B 3*23# C 3*23# D 4*|t# In both ranges of 1*Q* (ninety*,
eight to one hundred and fourteen* and one hundred and eight*,
teen and above) the pupils Who scored above the doth percen
26
a.
0? V
0
3
o 2 *
l
s i §vfi
G R A D E 2
N »
Z.H
o
*>
2 0
♦V
\
ft-0 <> <2Crecfti «/i + y Score
Fig. 1. Distribution of the Scores on the Minnesota Tests of Creative Thinking, Form VII.
1 7 L sr
c£t
/v f * ft i j/I s
<£?
Q R R D E
3
hi- z t
£U
cE
vo 3
c
"2: *
/
f 7 - 9- 7-6 -c
^ A
KZ
5? j DO I 1 0i S
£ »C
'vfl
G R f t D e v
M= 33
o
J- 0 § £
'V M'So
• o ° u o 3 0
"V -y ^ i -- -■
C.V-e.a.H m\ A 'y Sco re
Distribution of the Scores on the Minnesota Tests of
Creative Thinking, Form VII,
&
%
«<»J i i % r.
O
g V*-*&
-0 o
N> C60
H O o Fig. » -7 -
c.--e>- T
‘S 5
o ~Z a-c o u • *■ r<
(t O'
fo ooGRADE 5
N - 3Q
a
ri s r<> o a
o
sJ >c ri0 *o
i a
s
H e d m r v Sc or e N 9 % 7 -
L-o- S
■3
a .u-
o
o
ZH-. 3
-0
> «■>3 tfi
s
i
A
0 <No* '*0oo O o»O I I
x r i
I I
I I
e A
i i
i__ L
o 5? s»0
Q 4
Q R A D E fc
M = 4 4
0
r< £
Cre<x.+» v i ■ty Scor«.
Fig.5 Distribution of tne Scores on the Minnesota Vests of Creative Thinking, Form VII,
■
Ha
ILo
iHO
Table 4
Data Concerning the Subjects In Experimental Group A
Subject Creativity X»Q*
Score
Age
Grade Sex Number of Times"Following**
1 (1) 331 121 7-7 2 F 1
2
(al 237 122 7-4 2 M0
3
;?! 233 1138*0
2 F 14
5) 239113
7-1 2M
15
25)
340118
8-0
3 M 46
53 2562.19
9-7 4M
07 i54) 217
119
9-11 4 M 33 ;55) 199
118
9-8 4 M 19 56) 199 136 9-5 4 F 1
10 94) 193 119 10-1 5 M 0
11 i95) 194 121 9-8 5 F 3
12 (91) 204 113
10-0
5 M 413 (134) 165 126 1C-1 6 F 1
lumbers in brackets Inllcate mastering in raw
data.
Appendix jTable 5
Data Concerning the Subjects in Experimental Group B
Subject Creativity I.Q.
Score
Age Grade Sex Number of Times
"Following"
1
4) 259 114M
2
1M
' " '02 3) 278 112 7-3 2
p
8
3 27) 294 111 8-2 3 F 7
4 29 272
110
8-0 3 Fa
5 57) 199 104 9-0 4 F 4
6 59 18? 100
9-7
4 M 27 61) 186 93 9-2 4
M
2S
60)
186 103 9-9 4f
39 89
211
n o
10-7 5f
010 87) 218
101
11-0 5M
1
11 126) 250 110
11-1
6 F 6Tabid 6
Data Concerning the Subject# in Experimental Group C
3uVJ«'
ei
grMtlrlty
■T;t
iV" Is*
'
'
0r4d«" 5 « 1
fmbtr
ofT g U
Score •Following*
i
W
1
1
m
13?
ini.ig>mm
7«*k
i
T
— —2 19
122
u
2
M
1
3 40
195
n s
3
F
24
¥
117 8*33
n
6
1 69
1199-8
4
H
4
6
70
132
119
9—S
4
f
8
7
S3
93
120
9*1
4
m
28
71
130
120
9*6
4
F
49
115)
132 131 9*8 5 F0
10
u s f
107 1339-5
5
M
411
ioaJ
154
11910*8
5
M0
12 157) 113 127
10*6
6
F 213 [166) 82 120 11*7
6
M0
Humber# .in brackets indicate numbering
a
i
I
AppendixTable 7
Sat# Concerning the Subject# in Experimental Group D
^^Sssss^^S^ifB!5^?!
S
^psalSes:?Ss
s
^5Ss
SfS
!
?Ss
Score "Following*
T
mmmt:
T T 42 :is 141 108 7-11 2 M 0
3 37 209 108 8*3 3 F 6
4 35 214 101 S—6 3 F 7
? 127 104 8*10 3 M 2
6 76 119 105 9-5 4 F 4
7 66 142 106 9*6 4
M
4S 109 146 106 10*2 5 M 7
9 U6) 133 107 10-7 5 F 4
10
11 117)142) 133144
104 106 9*10 10*8 1 F F 1
It 152} itt 10?
108
11*2 6 F 7
13 [ISt) H I 11*3 6 M 4
31
those who scored below the 60th percentile* The results
illustrated In this distribution is similar to the trend
which use expected in' setting up this study* although the
differences between the groups was not statistically signif
icant*
s
V
--I
—»
<ldj«jL.s+e cl
D
e
BU*4«r K*1' *^erce*\+«l*
CREAT'M >TV
o u t r tor* percentile
fig* 7 Relationship of mean **1*011011111®’* scores for
groups A., B* 0* and 0 both before end after adjustment for
sex factor*
Since it sewed that the sex factor affected the tend
ency to "follow", the raw data was reorganised into two
.groups, boys and girls* The
two
groups have an equal number32
Table
8
Analysis of Variance and Co*Variance Adjustments for the
"Following**
Scores of Subjects Grouped on the Basie of Intelligence and Creativity*Source Sum of Squares d3T~ Mean Square' " T W
Intelligence
Creativity 26*3269
1 26.3269 4.49
20*9423 1 20*9423 3.57
Interaction Error
O.OI93 261*4615
1
46 0.0193
5.6638
1
Adjusted Intelligence
Creativity
15.3922 1 15*3922 3.20
15.8728 1 15*8728 3.30
Interaction
Error 226*27910.0193
1 47
0.0193 4.8144
1
113*65 and for the girls 113*92 with standard deviations of
6*47 and 9*36 respectively# The mean creativity score for
the boys was 181*38 and for the girls 187*77 with standard
deviations of 61.58 and 59.48 respectively#
Tho
t-t#stscore for the difference between these means was #37 with
50 degrees of freedom# This difference is not significant#
The mean "Following" score for the boys was 2#08 and for the
girls 4*42 and the standard deviations 1*97 and 2*81# The
t*teat
m o m
for the difference between these means was 3*44with 50 degrees of freedom* This difference is significant
Table 9
Means and Standard Deviations for I.Q. Scores, Creativity
Scores and "Following* Scores for Boys Group {U“26) and
Girls Group (®H26)
I.Q* Scores Mean
Creativity Scores Mean
"Following” Scores Mean
Boys 113.65 8,4? 181.38 61,58 2,08 1.97
Girls 113.92 9.36 187.77 59.48 4.42 2.81
In
general, then, the distribution of scores on thecreativity test at the various grad© levels was similar to
distributions of most creative thinking abilities found by
Torrance and his associates. Although the trend shown by
the "following” scores of the four groups chosen on the
basis of intelligence and creativity is similar to the
hypothesised effect, the differences were not large enough
to be statistically significant. On the other hand, when
the total number of subjects was divided into two groups on
the basis of sex, it was found that although there was no
significant difference between them on intelligence or creat*
ivity, there was a statistically significant difference on
C H A P f I I X¥
DIS0U3SI0H
MID
G0HCLU3I0HDiscussion
Several points might to mentioned concern ins; the distr
ibution of creativity scores* ' The grade too and three
pupils tended to score higher* generally* than those in the
other three grades* Since ten of the four sub-tests were
administered individually to the grade two and three pupils*
it may be that the higher scores could be accounted for on
this basis* The examiner wrote down their answers for them
whereas the grade four* five and six pupils were required
to write down their o » answers*
In his introduction in the manual of directions for
use with this form of the tests of creative thinking*
Torrance mentions the need to recognise that many individuals
will be handicapped by group, written adminlstrati on even
at the adult level but that some find it easier to give
written answers than oral ones* He does not state specific
ally what studies have been made in connection with this
35
in administration could be affecting the developmental
curves to some extant, and that further work should be
carried out in this area*
A comparison of .fig*
B
and fig* 9 shows that thedevelopmental curve obtained in this study corresponds
closely with a typical curve obtained by S. P* Torraro e*
Fig.
B
gives the graph plotted from the median scores foreach grade on Form T O * Minnesota Test of Creative Thinking*
Fig* 9 is the curve plotted for the mean frequency of
questions asked on Part 1, Aak-and-Guesa Test obtained by
Torrance (1962, p. 93)* He cites this curve as fairly
typical of the general pattern of the developmental curves
of most of the creative thinking abilities that he and his
associates have assessed* The units of measurement for the
ordinates of the two graphs differ and therefore are not
directly comparable. However it 'Will be seen that the general
trends at each of the grade levels are similar* with one
exception* Torrance*s developmental curves show a steady
increase
from
the first through the third grade, a sharpdecrease between the third and fourth grade followed by
some recovery during grad© five and six, with a drop again
between grad® six and seven. In the present study the
curve is similar except that the second drop occurs between
M e an F r e q u e n c y M e d ia n S c o r e
30-
2oa-IVo-iLo
/Vo IZo-too ....i. i i ....
-r-/ 2. 3 H S <> 7
Cj rdde
Fig. 8. Develop/a©ut» 1 Curve for Median Scores on Minnesota Tests of Creative Thinking, Fora VII, Obtained in this Study.
io ..
? ■
s
--7
-<o
-y
--V “
3
-\
\ / \ '
Qirls
6>oyS
—f— -I- -y—
7
specific environmental or cultural pressure * for example,
a strict or emphasis on academic conformity, or a loss
progressive typo of curriculum in Windsor schools. Stoddard*a
content (1957# p* 191) would support this idea* He states!
"Creativity came close to being a lost cause in American
education* Progressive education, a phenomenon rarely
observed in pure fora, helped to revive its spirit*,,Tbe
urge to Inquire, to invent, to perform was stifled in
millions of school children," If education in Windsor
schools, or in this particular school or even this one
classroom, is less progressive, perhaps the earlier slump
in the creativity scores can be accounted for on this basis.
The difference in the curve obtained in this study could
be simply a function of this particular sample of children.
In any case the general over-all agreement with Torrance*s
results would suggest that the Minnesota Test of Creative
Thinking, Form fll was applicable and useful in this situat
ion and was measuring the same or similar aspects as it did
in the development of the test*
The narrower ranges of creativity scores at the higher
grade levels, as seen in Table 10, suggest that the older
children are more inclined to a homogeneous grouping that
scores shows thrae-quartera of the subjects grouped together
in less than half tha range# This trend would need to be
investigated further In groups with well-controlled sampl
ings,
unlfomlty
of intelligence and when it has beendefinitely determined that these tests are reliable at each
level and measuring the same thing at every age* Longitudinal
studies following the same children through all age levels
will point up these factors*
fable
10
Comparison of the langss of Scores, the Medians and Inter
quartile Range at Each Grade Level on the Minnesota Tests
of Creative' Thinking
Grade Range Median Interquartile Hang©
2 333-102 (229 pts.) 159.50 - 231.50 - 139.50 '
3 340-111 (229 pts.) 203.50 249.50 - 166.16
4 256-
BO
(176 pts.) 123*94 161.64 - 115.705 235- 70 (165 pts*} 15$*07 184.50 - 126,50
6 250- ®0 (170 pts.) 139*50 155.21 - 112.83
The hypothesis that children
who
score in the top twentypercent in their grade level on tests of creativity are less
likely to give incorrect answers on a simple perceptual test
in order to conform with answers being given by their pears,
39
confirmed by the results of this study* Although the trend
lies In the hypothesised direction* the dirrerences in
"following" were not statistically significant* If we
accept the premise that the Minnesota Tests of Creative
Thinking are actually pointing up creativity, then it would
seas that some other factor in the children*! background is
also influencing their ability to resist group pressure in
this situation* From the results of the present study it
appears that intelligence alone is not the determining factor
either* Perhaps some other personality factor or environ
mental background factor influences the child*s ability to
act independently. Further study with more precise controls
is needed* The use of a personality test as a criterion
of selection of subjects would
he
helpful and some investigation of parental attitudes and approaches which might be
influencing the child* s behaviour such as ov&r-criticalness,
suppression of imagination would also lead to a more adequately
controlled sampling.
The analysis of the results of this study on tho basis
of sax* indicates a significant difference in the amount
of "Following" done by boys and girls* The girls* even
though of similar intelligence and creativity are influe
nced much more by peer pressures in the present study than
40
.
boys are treated differently and expected to behave differ**
ently* We tend to look for and promote sensitivity in girls
and independence in boys*
In the present study, the group pressure is perhaps
taken by sons or all of the pupils as a social situation
rather than an intellectual one* As J. s. Anderson’s
statement, which was referred to on page three, suggests,
we should avoid confusing the two types of situation*
Perhaps the girls and even seme of the boys who scored high
on "following" interpreted it as a social situation in
which the task was to discover what the group was doing*
The simplicity of the perceptual task perhaps did not make
it seem like an intellectual situation* Some follow-up
discussion, with each subject would possibly have enabled
the examiner to determine how they viewed the situation*
From this point of view, the greater amount of "following"
by the girls could be a function of greater social sens
itivity rather than inability to resist group pressure.
Conclusion
Although the results of this study indicate a trend
in the hypothesized direction, they do not permit us to
say that either creativity or intelligence will determine
41.
his pssrs
giving incorrect answers on asimple perceptual
test.
It does appear that boys do not yield to group press
ure as easily as girls do. Further study
which
was set upto investigate this apparent trend would need to be done
to determine the dynamics involved.
Results
obtained in this study in connection with thedistribution of creativity scores at the grade two to six
grade level* tend to confirm results obtained by Torrance
on the development of creative thinking abilities in