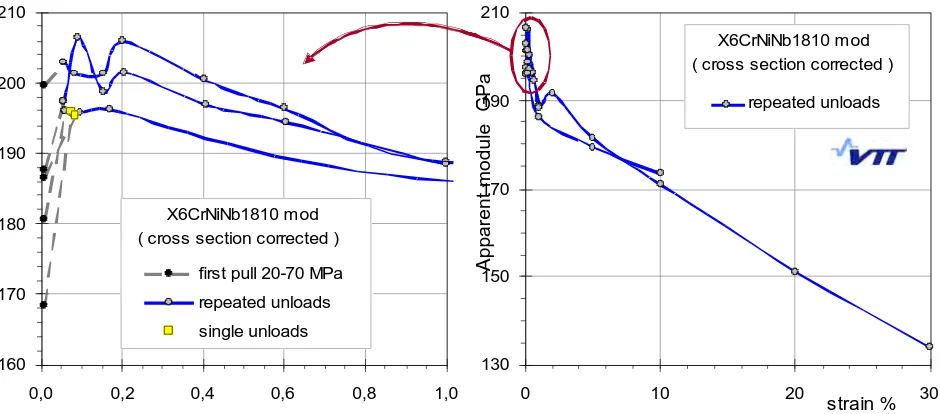
Fatigue curve and stress strain response for stainless steel
Full text
Figure


Related documents
In this paper distribution patterns of echinoderms, sediment textural analysis and physical parameters were dealt in three study sites, Gurgussum, Hirgigo and Tiwalet at the
6.1 Fault detection and isolation Scheme for actuator and flywheel spin rate sensor faults Assuming a single fault at any time, possible faults affecting the actuated reaction
Although piglet infection by S-INDEL PEDV Iowa106 also caused severe clinical signs in two litters (litter B and C), generally, the virulence of S-INDEL PEDV Iowa106 was lower
We aim to imple ment a robust moving object detection algorith m that can detect objects in variety of challenging rea l world scenarios.We organize the video
This paper has characterised several materials (RO-fine, RO-medium, washed sand and M165) and design mixes (DM1 and DMS) in terms of physical and chemical profiles,
In this study, we investigated the impact of GFR-Matrigel from different sources and xeno-free culturing conditions (E-8 medium and Vitronectin) on BMEC differentiation
Root mean squared (RMS) differences var- ied from 4.75 m, when compared to a densely gridded air- borne dataset over the Siple Coast region of West Antarctica to 33.78 m when
Additionally, a possibility to quickly insert into the drawing squares and rectangles (with a convenient determination of dimensions and the insertion point) has been added to
