Processing. (Under the direction of Dr. Michael S. Wogalter.)
Each year millions of people are injured as the results of using consumer products. One of
the ways to control hazards and minimize injuries is to warn people. Since the mid 1980s, a substantial body of warning research has revealed numerous factors that influence warning effectiveness. However, relatively little research has focused on the influence of product
advertisements in combination with warnings.
Research indicates that information from product advertisements may alter
expectations about the product by influencing individual’s attitudes and beliefs. The current research, comprised of one preliminary study and two experiments, investigates how
advertising in a magazine can influence people’s attitudes and beliefs toward products as well as warning memory. Based on the results of the preliminary study, six unknown brands were selected to be used for Experiment 1 and 2. Experiment 1 revealed that 6 times
exposures to ads showed significantly higher ratings of perceived effectiveness, familiarity, and perceived knowledge than one time exposure of an ad or a control condition (brand name and company information only). The results also showed that perceived hazard, effectiveness,
and knowledge ratings were significantly higher after viewing warnings with products than not viewing them.
Experiment 2 examined the effects of endorsements and embedded warnings in ads. Although no effect of endorsements was found on product perception ratings, significantly
The current research revealed that multiple exposures to ads changed people’s
attitudes or beliefs towards products. In other words, these findings demonstrate that ads may
mislead people to perceive products as more effective, more familiar, and more knowledgeable than they actually are. In addition, the results have showed that high
endorsement (expert endorser and government testing agency) condition increased warning
by Soyun Kim
A dissertation submitted to the Graduate Faculty of North Carolina State University
in partial fulfillment of the requirements for the Degree of
Doctor of Philosophy
Psychology
Raleigh, North Carolina
2011
APPROVED BY:
______________________________ _______________________________ Michael S. Wogalter, Ph.D. Christopher B. Mayhorn, Ph.D. Chair of Advisory Committee
DEDICATION
To my parents and my sister
아빠, 엄마, 그리고언니. 사랑합니다.
BIOGRAPHY
Soyun Kim was born in Seoul, Republic of Korea. She received her Bachelor of Science in
ACKNOWLEDGEMENTS
I would like to thank my parents and my sister (Joonkoo Kim, Hwasoon Lee, and Jihyun
Kim). My family has always been supportive, patient, and proud over the last years during my Ph.D. studies. Without my family’s love and support, my study would not complete.
I would like to express my special appreciation to Dr. Michael S. Wogalter. Since English is not my native language whenever I was struggling with writing publications or
dissertation, he revised my drafts several times repeatedly as well as gave me valuable advice. I cannot thank him enough! He has been my advisor, a mentor, as well as a collaborator. He has showed a role model as a strong researcher during my Ph.D. studies.
I have been very lucky in committee members. I am very grateful to my dissertation committee members, Dr. Christopher Mayhorn, Dr. Eric Wiebe, and Dr. Stan Dicks for their valuable comments, encouragement, guidance, and patience to work with me. Also I would
like to express my appreciation to Dr. Shevann Neupert for her valuable advice for statistic method and analysis.
My special thanks go to my friends. I cannot thank everybody by name but I would
like to record the following: Jeonghyun Lee, Boah Kang, Mamiko Arai, and Lisa Whitman for their support, encouragement, and precious friendship during my graduate years. Each moment we shared together made my graduate life always energetic and happy.
Lastly, I would like to thank all the faculty members and staffs at the NC State Psychology Department for giving me an opportunity to work as an instructor for the
TABLE OF CONTENTS
LIST OF TABLES ... vii
LIST OF FIGURES ... ix
Effects of Advertisements on Product Perception and Warning Information Processing ... 1
Factors that May Lessen the Warning Effectiveness ... 4
Advertising Effect ... 11
Advertising and Attitudes ... 11
Factors in Ads on Product Perception... 14
Embedded Warning Information in Ads and Product Perception ... 16
Repetition Effects ... 19
Effects of Warning Quality ... 21
Size ... 21
Signal Words and Signal Icons ... 21
Color/contrast ... 22
Pictorials ... 23
Format ... 23
Experiment 1 ... 24
Hypotheses ... 26
Method ... 28
Results ... 44
Product Perception Ratings ... 45
Warning Memory Test ... 51
Discussion ... 57
Experiment 2 ... 60
Hypotheses ... 68
Method ... 70
Results ... 79
Product Perception Ratings ... 79
Warning Memory and Reading Percentages of Warnings ... 84
Discussion ... 91
General Discussion ... 96
Summary of Results ... 96
Limitations ... 98
Implications ... 100
Directions for Future Research ... 100
REFERENCES ... 103
APPENDICES ... 117
Appendix A Brand Familiarity Questionnaire for Preliminary Study ... 118
Appendix B Informed Consent Form for Experiment 1 and Experiment 2 ... 120
Magazine Rating Form for Experiment 1 ... 124 Appendix E
Sample Product Rating form for Experiment 1 ... 126 Appendix F
Sample Ads used in Experiment 1 ... 128 Appendix G
Warnings with Products for Experiment 1 ... 131 Appendix H
Distractor Task for Experiment 1 - Need for Cognition Scale ... 137 Appendix I
Sample Warning Memory Test for Experiment 1 ... 139 Appendix J
Sample Familiarity Form - Experiment 1 and 2 ... 143 Appendix K
Sample Debriefing Form for Experiment 1 and Experiment 2 ... 145 Appendix L
Participants Assignments to Experimental Conditions for Experiment 1 ... 147 Appendix M
Instructions for Experiment 1 ... 152 Appendix N
Demographic Questionnaire for Experiment 2 ... 157 Appendix O
Magazine Rating Form for Experiment 2 ... 159 Appendix P
Sample Product Perception Rating Form for Experiment 2 ... 161 Appendix Q
Sample Ad for Experiment 2 ... 163 Appendix R
Sample Ad for Experiment 2 ... 165 Appendix S
Warnings with Products for Experiment 2 ... 167 Appendix T
Participants Assignments to Experimental Conditions for Experiment 2 ... 174 Appendix U
Distractor Task for Experiment 2– Need for Cognition Scale ... 179 Appendix V
Warning Memory Test for Experiment 2 ... 181 Appendix W
Instructions for Experiment 2 ... 185 Appendix X
Demographic Information Results – Experiment 1 ... 188 Appendix Y
Demographic Information Results – Experiment 2 ... 191 Appendix Z
LIST OF TABLES
Table 1 Mean Ratings of Perceived Familiarity ... 30 Table 2 Placement of Experimental Ads in Each Binder of the Magazine
... 34 Table 3 Latin Square Showing Product Advertisement Condition Combinations ... 35 Table 4 Questions given for Product Perception Rating Forms by Each Product
... 38 Table 5 Anchors with Description used in Rating Forms by Each Dimension of Perception ... 38 Table 6 Comparison between Weaker and Stronger Warning Quality
... 39 Table 7 Mean (SDs) Ratings for Perceived Hazard as a function of Frequency of Ads and Warnings on Warnings - on - Products Groups ... 46 Table 8 Mean (SDs) Ratings for Perceived Effectiveness as a function of Frequency of Ads and Warnings - on - Product Groups
... 47 Table 9 Mean (SDs) Ratings for Perceived Familiarity as a function of Frequency of Ads and Warnings - on - Products Groups
... 48 Table 10 Mean (SDs) Ratings for Perceived Knowledge as a function of Frequency of Ads and Warnings - on - Products Groups
... 49 Table 11 Mean (SDs) Ratings for Likely to Purchase as a function of Frequency of Ads and Warnings – on - Products Groups ... 50 Table 12 Correlation Coefficients Product Perception Ratings
... 51 Table 13 Mean (SDs) and Percentage (%) for Correct Answers for Warning Memory Tests by Frequency of Ads and Warning Quality ... 52 Table 14 Analysis of Variance for Memory Test Scores by Frequency of Ads and Warning Quality
... 52 Table 15 Mean (SDs) for Warning Memory Test Scores as a function of Warning Quality and Question Types
... 53 Table 16 Mean (SDs) and Percentage (%) for Correct Answers for Warning Memory Tests as a function of Products and Warning Quality
... 54 Table 17 Mean (SDs) for Warning Memory Scores for Each Test Item as a function of Warning Quality and Products ... 55 Table 18 Latin Square Showing Product advertisement Condition Combinations for
Experiment 2
Table 20 Statements Used for Ads by Products and Endorsement
... 74 Table 21 Mean (SDs) Ratings for Perceived Hazard as a function of Endorsement and
Embedded Warnings ... 81 Table 22 Mean (SDs) Ratings for Perceived Effectiveness as a function of Endorsement and Embedded Warnings
... 81 Table 23 Mean (SDs) Ratings for Perceived Familiarity as a function of Endorsement and Embedded Warning in Ads
... 82 Table 24 Mean (SDs) Ratings for Perceived Knowledge as a function of Endorsement and Embedded Warning in Ads
... 83 Table 25 Mean (SDs) Ratings for Likely to Purchase as a function of Endorsement and Embedded Warning in Ads
... 83 Table 26 Correlation Coefficients Product Perception Ratings
... 84 Table 27 Mean Warning Memory Scores as a function of Warning Quality, Endorsement, and Embedded Warning
... 86 Table 28 Means (SDs) for Each Memory Test Item as a function of Warning Quality and Endorsement
... 87 Table 29 Means (SDs) for Total Warning Memory Scores as a function of Warning Quality and Endorsement
LIST OF FIGURES
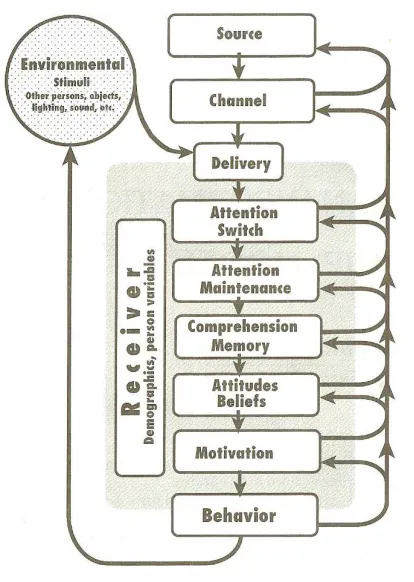
Figure 1 Communication-Human Information Processing (C-HIP) Model ... 4
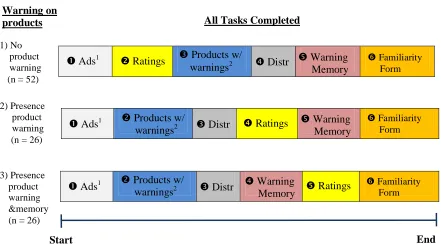
Figure 2 All Tasks Completed by Exposure to Warnings on Products Groups... 32
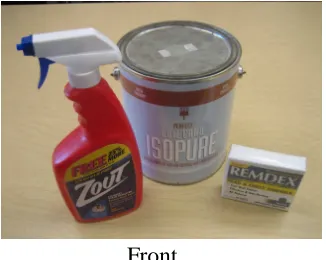
Figure 3 Three Consumer Products used in Experiment 1 ... 33
Figure 4 Three Binders and a Magazine 'Southern Living' ... 34
Figure 5 Examples of Three Versions of Ads for Each product ... 36
Figure 6 Control Conditions for Three Products ... 36
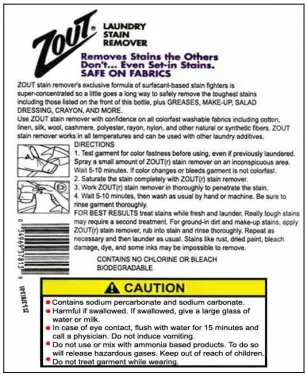
Figure 7 Warning Quality for 'Isopure' ... 40
Figure 8 Warning Quality for 'Remdex' ... 40
Figure 9 Warning Quality for 'Zout' ... 41
Figure 10 Participants during Experimental Session ... 43
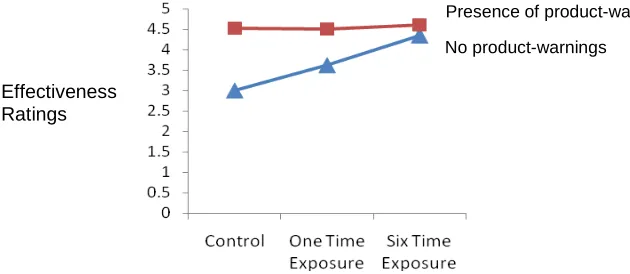
Figure 11 Means for Perceived Effectiveness Ratings as a Function of Warnings - ... 47
Figure 12 Mean Perceived Knowledge Ratings as a function of Warnings on Products ... 49
Figure 13 Mean Likely to Purchase Ratings as a function of Warnings on Products and Frequency of Ads ... 50
Figure 14 Three Consumer Products used in Experiment 2 ... 71
Figure 15 Example Ads for Three Products by Two Levels of Endorsement (one version for each) ... 75
Figure 16 continued ... 75
Figure 17 Embedded Warning in Ads for product 'Zilactin' ... 76
Figure 18 Warning Quality for 'Derma' ... 77
Effects of Advertisements on Product Perception and Warning Information Processing
Safety has been a major concern among workers, consumers, and manufacturers. To promote safety, warnings are used to communicate about hazard information to people. Over
the last three decades, a substantial body of warning research has revealed several varieties of factors that influence warning effectiveness. Given the breadth of the warning empirical research, several reviews of warning have tried to categorize factors that affect warning effectiveness. One of the most extensive reviews has done by Laughery and Wogalter (2006).
They reviewed factors with two categories: design factors and non-design factors. Before describing design and non-design factors in detail, the concept of warning system that needs to be addressed. A warning system encompasses many different sources of information
needed to accomplish the goals of the safety communication (Laughery & Smith, 2006). There are many components of a warning system for a product or environment. The warning system for a product, for example, may include a label on the product, a printed statement on
a container box, a package insert, an owner’s manual, and a verbal message at the point of purchase (Laughery, 2006). With respect to environment warning systems, the sources or media may include signs, auditory alarms, verbal instructions from others, and so on (Laughery et al., 2006). A warning system plays an important role when distinguishing
between design factors and non-design factors.
Design factors are relevant to the characteristics of warnings systems including warning size, location, color, signal word, pictorials, message length, physical interactivity,
warning systems. Rather, these factors are related to other factors such as receiver
characteristics or other environmental stimuli. Specifically, non-design factors represent the characteristics of the target audiences for whom the warning is intended and the situation is
which it is presented (Laughery, 2006). Perceived hazard, familiarity, social influence, modeling, and cost of compliance are included in non-design factors.
Another extensive warning literature review has been done by Rogers, Lamson, and
Rousseau (2000). They classified factors that influence warning effectiveness into two broad categories: person variables and warning variables. According to the definition in their review, person variables refer to factors that are specific to the individual who interact with
the warning. This category includes demographic (e.g., age and gender), cognitive aspects (e.g., familiarity and symbol comprehension), and personality variables (e.g., risk-taking style and perception control). Warning variables refer to the characteristics of the warning or
the context where the warning appears. These variables include physical features (e.g., color, layout, signal words, and type style) and more abstract characteristics (e.g., tone,
explicitness, and interactivity).
Although a substantial body of warning research has focused on factors that influence
whether or not a warning will be effective, little research has examined factors that may decrease or hinder warning information processing. Those factors may have various forms such as advertisements or promotional materials that imply an image of safety (Bohme &
mitigates concerns about narcotic risk instead of informing and cautioning the user of potential hazards. Thus, the appearance and content of OxyContin’s insert resulted in the drug being perceived as less dangerous than other similar medications. By 2001, OxyContin
addiction had become a significant public health problem in the U. S. In July, the FDA warned the manufacturer that it had failed to fully present the dangers of OxyContin and demanded that the drug company revised its insert language (FDA, 2001). Also, the FDA
ordered the manufacturer to send a letter to health care providers nationwide, explaining labeling changes and addiction risks of the medication (FDA, 2001).
The current research investigated non-designed factors that may lessen the impact of
warning information by affecting people’s product perception as well as the warning
information processing. Several factors influencing warning effectiveness were reviewed and organized by a communication-human information processing (C-HIP) model (Wogalter,
2006; Wogalter, Dejoy, & Laughery, 1999). The following is an overview of part of the review of the literature. Motivation and behavior stage is not discussed in the current research literature review. As one of the models of human information processing of warnings, C-HIP model has been extensively used to describe warning information
processing and organize the warning research literature in several stages by which warning information is transferred from a source, through some channel, via a means of delivery to a targeted receiver (see Figure 1). If all of the stages are successful, the warning process ends
environmental stimuli. These stimuli are extrinsic to the warning. Specifically they include
other people, other warnings, and other displays in the environment as well environmental conditions such as illumination and background noise (Wogalter, 2006, 5; Vredenburgh &
Helmick-Rich, 2006). With respect to a given warning, these other stimuli could potentially interfere with warning processing (Wogalter, 2006).
Figure 1. Communication-Human Information Processing (C-HIP) Model
Factors that May Lessen the Warning Effectiveness
result of compliance behavior to occur. This review focused on non-design factors (variables) that lessen or decrease warning effectiveness.
Attention switch and maintenance. The first Receiver stage in the C-HIP model is
Attention Switch and Maintenance. To be effective, a warning message must capture and hold the targeted recipient’s attention long enough for information to be processed.
Other stimuli in the environment may compete with the warning for attention switch
(Wogalter & Laughery, 2006). These stimuli include the presence of other persons or other warnings, and the tasks the individual is performing. Nighttime illumination is an important factor in the visibility of roadway signs and emergency vehicles. Hahn, McNaught, and
Bryden (1997) evaluated both physical measurements and subjective ratings to determine the visibility of roadway signs. They reported that the level of illumination of signs was highly variable and usually less than what was needed for optimal legibility. Weather condition also
influences the attention capture of a warning. Smoke, fog, and rain can reduce people’s ability to discern components of a warning (Vredenburgh et al., 2006). Clutter or visual noise can decrease the relative conspicuity and the likelihood of a warning to be detected (Vredenburgh & Helmick-Rich, 2006). Visual clutter may affect the early stages of
information processing. Wogalter, Rashid, Clarke, and Kalsher (1991) found that participants complied with a warning sign more frequently when the laboratory table was not visually cluttered with extraneous tools and equipment. Collins and Lerner (1983) studied the effects
Comprehension and memory. Once a warning was successfully noticed and
encoded, the intended message of the warning should be understood by receivers to
effectively communicate information and influence behavior (Wogalter, 2006). A distinction
should be made between comprehension and memory. Comprehension refers to understanding the safety information in the warnings. Memory indicates recall and
recognition of specific information in the warnings (Young and Wogalter, 1990). The current
research is designed to focus on warning memory.
A few studies have shown the effect of product perception on warning memory. Otsubo (1988) reported that participants who had previously used a tool similar to the one
presented during the experiment were less likely to recall the danger and avoidance
components of the warning message. In a series of meta-analyses of Argo and Main (2004) study, it was expected that consumers who were less familiar with a product would be more
likely to recall the warning information but the results was not significant even though the results were in the predicted direction.
Gardner-Bonneau, et al. (1989) investigated effect of target audience characteristics and warning information on warning memory. Specifically they investigated recall of
cigarette warning information by smokers and non-smokers. Participants were exposed to cigarette warnings printed on cigarette packs in magazine ads. Recall of warning information was measured immediately after exposure and one week later. The results showed that
Attitudes and beliefs. If a warning was successfully noticed encoded and understood,
still a warning might fail to elicit safety behavior, if the warning message does not concur with the receiver’s current beliefs and attitudes. Beliefs and attitudes refer to a person’s
knowledge that is accepted as true (Wogalter, 2006). Familiarity has been investigated as one of the belief dimensions using ratings (Wogalter, Brems, and Martin, 1993). Perceived hazard is also one of the dimensions of a belief/attitude. It describes people’s beliefs about
the dangers or risks associated with a product, task, or environment (Smith-Jackson and Wogalter, 2006). Perceived hazard goes by various names in the literature such as perceived hazardousness, perceived risk, and risk perception. Source credibility has been also
investigated as other belief dimensions using ratings (Wogalter, Kalsher, & Rashid, 1999). Numerous studies have shown that familiarity reduces warning processing. Dejoy (1999) presented a summary of findings on product familiarity that has been found to
decrease users’ perceived risk (Goldhaber & deTurck, 1988; Karnes, Leonard, & Rachwal, 1986) and the believability of the warnings (Andrew, Netemeyer, & Durvasula, 1991). Increased familiarity has been related to decreased precautionary intent, lower levels of compliance (Goldhaber & deTurck, 1988a, 1988b; Otsubo, 1988; Wogalter, Barlow, and
Murphy, 1995), and a lower likelihood or willingness to read warnings (LaRue & Cohen, 1987; Otsubo, 1988; Wogalter, Brelsford, Desaulniers, & Laughery, 1991).
Warning effectiveness tends to increase as a function of perceived hazard (Dejoy,
Wogalter, 1989; Otsubo, 1988). The converse is true. People are less likely to look for and read a warning if they do not believe a product is hazardous (Wogalter 2006).
Source has also examined related to warning effectiveness. As the first stage in the
C-HIP model (see Figure 1), the source is the originator or initial transmitter of the warning and safety communication where the intent is some combination of cognitive, affective, and behavior changes desired in the recipients (Cox and Wogalter, 2006; Wogalter, 2006;
Wogalter, Dejoy, and Laughery, 1999). The source can be a person, family members,
government agencies, manufacturers, coworkers, or public interest groups. Cox and Wogalter (2006) reviewed the role and characteristics of the source in the C-HIP model in determining
the effectiveness of communications to receivers. In warning research literature, the effects of source characteristics have been studied as factors that enhance the warning effectiveness.
While research has been investigated the effect of source characteristics on receiver’s
beliefs or attitudes, recently some researchers have questioned about antagonistic effect of source characteristic on receiver’s beliefs or attitudes. Bohme and Egilman (2006) argued that although several characteristics of a warning source that are essential to the development of an effective warning, the source’s own priorities, interests or motivation should be
considered. Bohme et al. (2006) warned that disregarding these characteristics (i.e., the source’s own interests or motivation) of the source may result in misunderstanding of the warning. More specifically, credibility of a source may or may not reflect their actual
the knowledge of some of its clients (Richards, 1978). IBT had been corrupting science, but its credibility level was high before a federal investigation into its practices.
A few empirical and case studies have investigated how manufacturer’s interests may
influence the development of warnings or safety information (Bohme et al, 2006; Egilman & Bohme, 2006). Research has shown that warning sources have interests that are antagonistic to the development of effective warnings (Egilman et al., 2006). Manufacturers have their
own goal as product sellers: increasing their sales. Engineers also have an expert duty to do that they shall hold paramount the safety, health and welfare of the public in the performance of their expert duties (Fundamental Canon of the American Society of Mechanical Engineers,
2000). That is, the engineer’s expert duty to protect consumers from harms is imposed on manufacturers through common law (Cox, 2006). That is, there is a tension for many products between efforts emphasizing the favorable aspects a product to sell their products
and the duty to protect consumers from harm (Cox, 2006). When the manufacturer’s common law, ‘duty to warn,’ is discussed, the impact of warning should be considered. Manufacturers have long “feared” that their sales are lost because of warnings and, at the same time, failure to warn could end up potentially substantial litigation expenses. This
dilemma has led that some industries have employed two strategies to fulfill safety requirements imposed by law or public opinion while minimizing the impact on profit: to warn inadequately and to produce media that misrepresent dangerous products as safe
misrepresent dangerous products as safe in order to contradict true warnings. For example, advertisements or promotional materials that shows an image of safety for products even though the product is dangerous in actuality. Greenman and Jones (2010) investigated key
drivers of consumer appeal by comparing tanning advertising strategies to those used by tobacco marketers. The results showed that both industries have relied on similar advertising strategies, including mitigating health concerns, appealing to a sense of social acceptance,
emphasizing psychotropic effects, and targeting specific population segments. Bohme et al. (2006) called these materials anti-warnings. That is, inadequate and anti-warnings have the effect by influencing beliefs and attitudes about products usually in a positive manner which
may lessen the impact of warnings (Bohme et al., 2006).
As discussed previously, attitudes or beliefs may be formed based on personal
experiences with a product (Wogalter, 2006) or based on incorrect or incomplete information
(Vredenburgh and Zackowitz, 2006). For example, perceived product familiarity is formed from not only prior personal experiences and frequency of use but also other factors
including seeing a product used, interacting with advertising, or experiencing other products perceived as similar (Ortiz, Resnick, & Kengskool, 2000; Rhoades, Frantz, & Miller, 1990).
Without personal experiences or personal knowledge of someone else being injured, people may lead to underestimating hazards or not thinking about them at all (Wogalter, 2006). One of the possible ways which may form these misled attitudes or beliefs without exposing to a
of the goals of the proposed research is to examine how advertisements affect attitudes or beliefs towards products and warning information memory.
Advertising Effect
Advertising is a ubiquitous form of communication about products, and people are commonly exposed to advertisements on radio, television, in magazines, newspapers, and websites on the internet. Advertisements are employed with a primary purpose of persuading
consumers to purchase products and services (Kardes, 2005) by influencing consumer’s attitudes or beliefs (Lippa, 1994). Each year the average American consumer is exposed to 182,000 advertisements in the mass media (Wilson & Wilson, 1998) and in 2003, U.S. firms
spent more than $240 billion on advertising (Kermouch, 2003). Research shows that
advertising has a huge impact on sales (Assmus, Farley, & Lehmann, 1984; Chandy, Tellis, MacInnis, & Thaivanich, 2001). In the following, several types of attitudes, and advertising
effect on change of those types of attitudes was discussed briefly.
Advertising and Attitudes
According to Kardes (2002), one way of classifying ads is in terms of the types of attitudes they are designed to change and in terms of consumers’ regulatory focus. He
suggested four types of attitudes. First, attitudes that serve a knowledge function summarize large amounts of information to simplify the world so as to enable consumers to make decisions quickly and easily. Second, attitudes that serve a value-expressive function
attitudes that serve an adjustment function help consumers approach pleasure and avoid pain more quickly (Katz, 1960; Smith, Bruner, & White, 1956). Each section will be described in the following section.
Knowledge appeals. Suppose that a consumer did not have attitudes, and he or she
was trying to order something at McDonald’s. Perhaps consumers would need to evaluate all relevant decision options each and every item on the menu such as relative benefits (e.g.,
taste, satiating properties) and costs (e.g., price, calories). However, fortunately, consumers have attitudes that enable them to make simple decisions quickly and easily without
evaluating every item on the menu carefully. In this case, attitudes are functional or useful by
summarizing large amount of information (Kardes, 2002). Ads in the category attempt to influence consumers using relevant factual information and logical arguments. The information in ads sometimes belongs to product attributes or benefits, and it often allows
consumers to infer their own conclusions. For example, “Isopure contain B vitamins” and “B vitamins give you energy” imply that “Isopure gives you energy.” Besides syllogisms, advertisers also use comparative ads that provide compelling reason for believing that an advertised product is better than others. In the case, comparative ads focus on a difference on
the same attributes dimension (e.g., hours of relief for cold medicine) or directly comparable aspects (e.g., 8 hours of relief is better than 4 hours of relief) (Zhang, Kardes, & Cronley, 2002).
Value-expressive appeals. Favorable attitudes toward Remy Martin Napolean cognac,
reflect conservative attitudes and lifestyles. Consumers are often concerned about the opinions that other have of them. The attitude that serve the value-expressive function help consumers manage the impressions that others form of them and meet other consumers with
similar taste and preference. Kardes (2002) discussed that some consumers are highly concerned about their images, and such consumers are susceptible to image appeals and celebrity advertising. Image appealing highlights the uniqueness of special people who buy a
particular brand, and celebrity advertising involves with the use of famous spokespersons who are liked by the target market (Kardes, 2002).
Ego-defensive appeals. Some attitudes serve a self-protective or ego-defensive
function (Kardes, 2002). Attitudes towards religious or political beliefs and protection devices such as insurance policies, medicines, and other health-related products are influenced by ego-defensive appeals. In other words, these beliefs are rarely influenced by
facts (knowledge appeals), or image (value-expressive appeals) (Kardes, 2002). For the category, authority figures (e.g., political leaders, religious leaders) and experts (e.g., doctors, scientists) are useful for changing ego-defensive attitudes. People are often blindly obedient to authority, especially when they seek political, financial, or security-related guidance
(Milgram, 1963). Advertisers sometimes take advantage of this blind obedience by
employing actors who look like leaders or experts (Kardes, 2002). Usually, this kind of ads works best for health and protection-related products by employing trusted authority figures
and experts to help consumers feel safe and secure (Kardes, 2002).
Adjustment appeals. Consumers purchase some types of products because the
because they taste bad or feel bad (Kardes, 2002). Specifically, ‘guilty pleasures’ should be advertised using adjustment appeals. Guilty pleasures include high-calorie beverages (ice cream, candy, cake, hamburgers), comfortable but ugly clothing (e.g., boxers, fuzzy slippers),
and entertainment products that no one wants to admit they like (e.g., gossip or porn columns in magazines). Kardes (2002) discussed that for this ads’ category, advertisements do not want to consumers to think too much about their decision. Complex argument is not needed,
image does not matter, and authority figures, expert, and fear are not influential. Ads in this category emphasize either benefits (e.g., simple pleasures, incentives) to encourage
consumers to purchase advertised brands or emphasize costs (e.g., pain, loss) to encourage
consumers to avoid competing brands and to purchase the advertised brands.
It seems to be clear that using different content of ads depends on the type of attitudes is effective in persuading consumers in that they can change consumer’s attitudes toward
products. However, studies examining the effect of ads on the specific dimension of product perception such as perceived risk or hazard are limited. In fact, perceived hazard is very important to warning effectiveness (Dejoy, 1997; Wogalter, 2006). Thus, the effect of specific aspects or factors in ads on perceived product risk or safety was discussed in the
following section.
Factors in Ads on Product Perception
Relatively little research has been done regarding the effects of specific factors or
authority, and the length of warranty. The product used for the study was a color computer monitor. Participants were asked to give ratings of perceived product safety. The results showed that product safety was significantly affected by all of the variables. Specifically,
with respect to source credibility, products that are promoted by a computer expert are perceived as having a higher level of product safety than an ordinary PC user, which was higher than a celebrity.
Reselius (1971) investigated eleven methods of relief: endorsements, brand loyalty, major brand image, private testing, store image, free sample, money-back guarantee,
government testing, shopping, expensive model, and word of mouth. The results showed that
store image, shopping, free sample, word of mouth, and government testing generally evoked a ‘neutral’ or ‘slightly favorable’ response. Endorsements, money-back guarantees, and private testing evoked a ‘slightly unfavorable’ response or ‘neutral. Biswas, Biswas, and Das
(2006) suggested that for high technology-oriented products (e.g., a computer), an endorsement by a person perceived to be an expert for that product was more effective in reducing perceived risk than an endorsement by a celebrity or by a non-celebrity non-expert. However, for low technology–oriented products (e. g., treadmill), these differential effects
were nonexistent.
As discussed above, research examining aspects or factors in ads on product
perception including perceived product risk or safety is fairly limited. Previous studies have
safety and quality. Thus, empirical research examining what factors in advertisements would influence people’s perceived risk or safety needs to be conducted systematically.
Embedded Warning Information in Ads and Product Perception
Besides factors that influence product perceived risk discussed earlier, another factor can be considered, warnings.
In general, the main purpose of advertisement is to promote the image of a product
and increase their sales by presenting positive images. However because of the worries that warnings might hurt their sales, manufacturers rarely include warnings or hazard information in their product ads. However, the few exceptions to this are when the law mandates that
warning information need to be included in advertisement. For example, advertisement prescription medications are required to include a balanced presentation of product attribute and possible contraindications and side effects (Code of Federal Regulations, 1999).
Little empirical research has investigated how the presence of warning information in advertisements influences product perception. The literature on the impact of warning
information in ads on product perceptions has showed the mixed results (Rogers et al, 2000; Stewart, Folkes, & Marin, 2001; Stewart & Martin, 1994). Some research has shown that
warning information in ads increased perceived risk and increased perceived effectiveness (Mason, Scammon, and Fang, 2007; MacKinnon and Lapin, 1998; Ursic, 1984). Mason, Scammon, and Fang (2007) investigated that the impact of disclosures (warning, disclaimer,
consideration of extent of product use, the specific and strong message contained in the product warning significantly impacted consumers’ safety evaluation. That is, participants who viewed a warning reported that lower perceived product safety than did those who
viewed a disclaimer or no-risk disclosure. Thus, the authors stated that product warnings appears to be a useful means for informing consumers about potential product risks and influencing product safety perceptions. With regard to the efficacy, the finding was that the
warning led to higher perceived efficacy ratings. Thus, the authors concluded that when warnings about potential product risks are available, they may be also impact efficacy perceptions in addition to safety perceptions. MacKinnon and Lapin (1998) also showed
similar results. They found evidence that warning information in ads increased perceived alcohol risk. Also they reported that there was a pattern that for drinkers, Surgeon General’s warning reduced advertising effects on perceived benefits (attractive, fashionable, fun, etc).
Ursic (1984) asked college students to evaluate storyboards containing three hypothetical brands for bug killers and for hair dryers. Participants were instructed to examine boards and rate each brand regarding its effectiveness and safety. One brand of bug killer warned about the danger of inhaling the product, and one brand of hair dryer warned of the danger of
electric shock. Results showed that the presence of a warning had a positive impact on participants’ perception of the effectiveness and safety of a brand.
FDA investigated the effect of risk disclosure of prescription drug (DTC)
risk disclosure (integrated within the ad vs. stand outing from the background). In terms of the television ad, subjects who viewed ads with longer and more specific risk disclosures had better recall of risk information. In addition, the ads containing general risk information were
more likely to be perceived as reassuring rather than conveying risk information (Morris, Brinberg, Klinberg, Millstein and Rivera, 1986). Wogalter, Paine, Mills, and Smith-Jackson (1999) investigated the effect of integrated/separated risk/benefit information in
direct-to-consumer drug advertisements on the knowledge acquisition and perceived effectiveness. The results showed that conspicuity was a very important factor. This can be seen by the better knowledge scores for the separate/color (read) and the separate enhanced (e.g.,
warning was boxed and contained yellow signal-word panel and an alert icon) condition and the better perceived effectiveness ranks.
On the other hand, some research has shown that risk information in ads seems not to
be having strong effect on product perception. Whisenhunt, Williamson, Netemeyer, & Andrews (2003) tested women’s perceptions of different weight loss product ads (health risks information vs. unrelated information vs. information intended to enhance the perceived effectiveness of product) to determine if body dysphoria (BD) affect women’s risk beliefs,
past behaviors, and intention to use weight loss products. The findings was that high BD women showed a general understanding of the risks involved with using the weight loss products regardless of the types of ad disclosures. But those health risk- related knowledge
stated that graphically highlighting the black-box warning on a DTC site had little impact on consumers. That is, bold graphical highlighting and labeling of black-box risks modestly affected consumer risk perceptions. Cox (2006) discussed that in the case of a rat poison or
an insecticide, consumers may choose the brand with the strongest warnings about dangers to humans and pets because they expect it to be the most potent.
While Mason, et al. (2007), MacKinnon et al. (1998), and Wogalter et al. (1999) have
suggested that warning information would increase product perceived risk or perceived effectiveness, Kees, et al. (2008) revealed that warning information do not have strong effect on consumers’ perception. Since the previous research showed inconsistent results, research
need to be replicated to evaluate the effect of warning information in ads. The current research should examine whether warnings in ads with printed magazine would lead to less favorable product perception by reducing the advertisement effect (e.g., increased product
perceived benefits, decreased product perceived risk, MacKinnon et al.,1998) and could be extended whether warnings in ads would influence perceived efficacy and perceived knowledge.
Repetition Effects
There was clear evidence that advertisements can influence consumers’
attitude/beliefs. Although numerous studies have examined the effect of ads, elicitation of attitude change by the number of ads exposure is not clear.
moderate level enhances, in general, its persuasive impact with attitudes or beliefs towards products (Bornstein, 1989; Conzola, 2003; Kusumo, Matsuda, and Sugimori, 2009). Bornstein (1989) suggested that exposure effect curve reaches ceiling effect generally after
10- 20 stimulus presentations. Conzola (2003) examined the effect of advertising on product perception by manipulating the number of ads exposures (0, 1, 3, and 5). The results showed that participants assigned higher ratings of familiarity and knowledge when they saw a
product advertised five times or three times with different ads compared to products for which they saw no ads. However, perceived safety ratings were not influenced. Kusumo, Matsuda, and Sugimori (2009) investigated the factors evoking consumer’s perceived safety
and feelings of nostalgia to the mere exposure effect. The results showed that the frequent repetition of an ad increased familiarity as well as the sense of safety of a product by mere exposure effect.
The minimum number of ads exposures was considered. Krugman (1972) suggested that three ads exposures is a minimum level for effective response. He stated that the first
exposure elicits a cognitive response, “what was it?” response from the reader. The second exposure elicits an evaluation of the product, and the third exposure serves as a reminder. He
argued that there is no fourth exposure psychologically. In other words, he argued that exposures beyond three are rarely influential.
Despite of the numerous previous studies, it seems that physically what number of
Effects of Warning Quality
Up to this point, discussion has focused on the non-design factors that influence warning effectiveness. Extensive reviews of design factors influencing warning effectiveness
have been done (Wogalter and Vigilante, 2006; Laughery and Wogalter, 2006; Rogers, Lamson, and Rousseau, 2000). Since the current proposed research presented consumer products with warning information to participants to examine the effect of warning quality,
several design factors were reviewed below.
Size
Bigger and boldness is generally better. Barlow and Wogalter (1991, 1993) reported
that bigger print size benefited encoding and recall. Young and Wogalter (1990) examined that print warnings with bigger, bolder print led to better memory for owner’s manual warnings.
Signal Words and Signal Icons
Signal words in warnings are used to attract attention and provide a comprehension
with regard to hazard level. Young, Wogalter, Laughery, Magurno, and Lovvoll (1995) investigated the relationship among safety sign components and found that the signal word
was considered the most important element. Wogalter, Jarrard, and Simpson (1994) reported that product with a signal word increased the perception of hazard than products without signal words. In the United States, standards such as ANSI Z535 (2002) and guidelines such
cause serious injury; and CAUTION is intended for hazards that might cause minor injury or damage to property (Laughery & Wogalter, 2006). Research has been shown that the
presence of the word DANGER is more likely to attract attention than CAUTION and
WARNING or no signal word (Adams, Bochner, & Bilik, 1998). People do not differentiate between CAUTION and WARNING with regard to hazard level, but both words are
interpreted as connoting lower hazard levels that DANGER (Wogalter & Silver, 1995).
The signal icon is an exclamation mark surrounded by a triangle. The inclusion of signal icon in print warnings has been recommended to attract attention and indicate the presence of a hazard (FMC, 1985). Young (1991) reported that the time required to find a
warning was significantly faster when a signal icon was present.
Color/contrast
A number of studies have examined the effects of adding color to visual warnings.
The color red has been consistently found to have the highest hazard connotation (Klein, Braun, Peterson, & Silver, 1993). Red is typically used to communicate the highest level of risk, followed by orange and yellow (Edworthy & Adams, 1996). Braun, Sansing, Kenny, and Silver (1994) compared the perceived hazard level of red, orange, green, and black signal
words and found that red was perceived as more hazardous. Chapanis (1994) reported that the signal word “danger” printed on a red background was interpreted as communicating the greatest amount of hazard. Besides the color red, the ANSI Z535 (2002) standard indicates
Pictorials
Research has shown that pictorials may serve two primary functions in warnings. They can help to attract attention to the warning, and they can convey content information
(Laughery & Wogalter, 2006). In general, pictorials enhance the conspicuousness of a warning. Laughery and Young (1991) examined that pictorials combined with color and borders were more effective in attracting attention than the individual features separately.
Also pictorials are useful in helping to increase comprehension (Laughery & Wogalter, 2006). Sojourner and Wogalter (1998) investigated the influence of pictorials on the comprehension and recall of pharmaceutical safety and warning information. The results showed that
instructions from the text and pictorials format were recalled more often than instructions from the other formats (e.g., text alone, pictorials alone or control, etc).
Format
The format in which warning information is presented influence reading of the warning text as well as memory for the warning information (Lesch, 2006). Research has shown that text presented as bullets in outline form is rated more appealing, easier to process, and more effective compared to other layout formats (Wogalter & Shaver, 2001). Young and
Wogalter (1990) varied the conspicuity of warning text and presence or absence of a pictorial. The results showed that participants showed better comprehension and recall in the
Experiment 1
As mentioned previously, advertising was employed in the current research as one of the possible avenues that may mislead consumers’ attitudes or beliefs towards products. The primary purpose of Experiment 1 was to examine whether product advertisements affect product perception as well as warning information processing. To examine the effect of ads,
frequency (the number of exposure) of ads was manipulated. As discussed previously, the effect of the repeated exposure to ads on attitudes or beliefs is unclear. Some research has shown that repeated exposure to ads does not affect judgments (Batra and Ray, 1986; Belch,
1982; Burke and Srull 1988; Rethans, Swasy, and Marks, 1986) whereas other studies have shown that increasing ads exposures from a low to moderate level enhances its persuasive impact with attitudes or beliefs towards products (Conzola, 2003; Kusumo, Matsuda, and
Sugimori, 2009). In addition, although the findings indicated that there was ads repetition effect, the number of exposures necessary to elicit change of attitudes is unclear. Krugman (1972) argued that three ads exposures is a minimum level for effective response. According to Bornstein’s (1989) meta-analysis, exposure effect curve reaches a ceiling effect generally
after 10- 20 stimulus presentations. Conzola (2003) conducted a study examining the effect of advertising on product perception by manipulating the exposure time (0, 1, 3, and 5). The results showed that participants’ ratings of familiarity and knowledge were higher in the 3
times or 5 times conditions with multiple ads than no ads condition. In addition, the familiarity rating of five exposures condition was higher than the 1 exposure condition.
and company information with no images) on product perception with the dimensions of perceived hazard, effectiveness, familiarity, and knowledge.
After exposing to ads, participants’ beliefs may be influenced by the ads. In other
words, participants may perceive more familiar, more knowledgeable, and more effective towards products and/or less hazardous toward products. This changed attitudes or beliefs after exposing to ads might be danger and may lead to personal injury because increased
familiarity tend to decrease consumers’ perceived hazard (Goldhaber & deTurck, 1988; Karnes, Leonard, & Rachwal, 1986) and also it is related to a lower likelihood or willingness to read warnings (LaRue & Cohen, 1987; Otsubo, 1988; Wogalter, Brelsford, DeSaulniers, &
Laughery, 1991). In this case, it should be considered that how the effect of ads (i.e., changed attitudes or beliefs) can be lessened as well as how consumers can make an informed decision when they purchase or use products. One of the possible solutions is to
provide warning information via a product. Research has shown that prior risk information about the products suppressed the increased familiarity as well as the sense of safety of a product by mere ads exposure effect (Kusumo, Matsuda, and Sugimori, 2009). In the current research, warnings with products were presented to participants after exposing to ads. To
examine and compare between changed beliefs after exposing only ads and those after exposing ads and warnings with products, the sequence of tasks was manipulated. Participants were assigned randomly into three groups: (1) No product - warnings, (2)
product ads but before product warnings. In other words, participants made their product perception ratings before they were presented to warnings with products. In the presence of product warnings group, after exposing to ads and warnings with products, product ratings
were taken and then warning memory was measured. In the presence of product warnings and memory test group, after exposing to ads and warnings with products, warning memory was taken, followed by product perception ratings. The description for three groups was
discussed in the Experimental design section in detail. Accordingly, a second purpose of Experiment 1 was to examine the effect of the presence of warnings with products on product perception with the dimension of perceived hazard, effectiveness, familiarity, and perceived
knowledge.
Further purpose of Experiment 1 was to examine the effect of warning quality of warnings with products presented to participants after exposing ads. Research has shown that
text presented as bullets in outline form is rated easier to process, more effective compared to other layout formats (Wogalter & Shaver, 2001). In the current research, warnings with the products were manipulated with two levels: weaker and stronger. In Experiment 1, the effect of warning quality on product perception ratings as well as warning information memory was
measured.
Hypotheses
Experiment 1examined the effect of advertisements on product perception as well as
measured as well. Based on the research purposes and the research reviewed, four hypotheses were developed.
The number of frequency of ads was manipulated; 1 time, 6 times, and control (only
product brand name and company information with no images). Based on the study objectives and research reviewed, four hypotheses for Experiment 1 were developed:
Hypothesis 1 - a (H1 - a): Similar to the Conzola study (2003), participants will
assign higher ratings of perceived effectiveness, perceived familiarity, and perceived knowledge with six times exposure of ads than 1 time exposure, which will then in turn be higher than control.
Hypothesis 1 - b (H1 - b): Participants will assign lower ratings of perceived hazard
with six times exposure of ads than 1 time exposure, which will be lower than control.
Hypothesis 2 (H2): Participants will show lowest warning memory score with six
times exposure of ads than 1 time, which will be lower than control. This will be consistent with the previous research that consumers tend to be less likely to read warnings on more familiar products (LaRue & Cohen, 1987; Otsubo, 1988; Wogalter,
Brelsford, Desaulniers, & Laughery, 1991) and less likely to look for and read a warning if they do not believe a product is hazardous (Wogalter, 2006).
A second purpose of Experiment 1 was to examine whether the presence of warnings
three groups depending on the completion of product ratings task: (1) no product warnings, (2) presence of product warnings, and (3) presence of product warnings and memory.
Hypothesis 3: Participants will show higher ratings of perceived hazard (Kusumo, et
al., 2009), effectiveness, familiarity (Kusumo, et al., 2009), and knowledge of product in the presence of product warnings or presence of product warnings and memory group than no product warnings group.
As discussed earlier, warnings with products were presented and the quality of warnings was manipulated as weaker and stronger.
Hypothesis 4 (H4): Participants will show higher warning memory scores in
stronger warnings than weaker warnings.
Method Preliminary Study
A preliminary study was conducted to evaluate the perceived familiarity of brand names for several types of products. Because attitudes affect recall (Ross, McFarland, and Fletcher, 1981) and once attitudes are formed they are very difficult to change (Ross and
Anderson, 1982), it seems that low perceived familiarity is necessary to examine the effect of ads on attitudes or beliefs and memory. Therefore, it was decided that only consumer
products with low perceived familiarity were chosen for the stimuli.
Ratings of several brand names of consumer products were evaluated on the dimension of perceived familiarity. Based on the results, a total of 6 brands were chosen to be used for Experiment 1 and Experiment 2.
different types of consumer products were examined; laundry stain remover, protein powder, hair removal, tub and tile cleaner, cold remedy, and cold sore ointment. Each product type had five different brand names. Participants were asked to rate their perceived familiarity
using a 9 - point scale, with the following numerical and verbal anchors: (0) Not at all
familiar, (2) somewhat familiar, (4) familiar, (6) very familiar and (8) extremely familiar (see Appendix A). The questions were part of a larger questionnaire concerning various beliefs
about safety and consumer products. Two orders of questions were used; one was a randomized order and the other was the reverse of the randomized order.
Table 1 shows a complete list of the products and their mean ratings and standard
deviations. Based on these ratings, only one brand with low perceived familiarity from each product category was selected. Three brand names of products with low perceived
familiarity: Zout (Laundry Stain Remover), Nature’s Best Perfect Zero Carb Isopure (protein
dietary supplement), and Remdex (Cold remedy) were chosen for Experiment 1. For
Table 1
Mean Ratings of Perceived Familiarity (highest to lowest order)
Brand Name Product Type Familiarity Mean (SDs)
Advil 7.23 (1.55)
Clorox 7.10 (1.78)
Tide 7.06 (1.86)
Tylenol 6.26 (2.24)
Oxi Clean 5.97 (2.42)
Blistex 5.57 (2.79)
Tilex 5.04 (3.07)
Oragel 4.80 (2.91)
Kaboom 4.09 (3.03)
Zantac 3.93 (2.98)
Abreva 3.89 (3.12)
CLR 3.40 (3.18)
Zicam 3.35 (3.15)
Whey Protein 3.09 (3.28)
Veet 2.72 (3.08)
Cytosport 2.04 (2.85)
Zap 1.46 (2.17)
Satin 1.25 (2.30)
Zout * Laundry Stain Remover 0.96 (2.15)
Lyzine 0.95 (2.09)
Hair No More 0.85 (1.67)
Isopure * Protein Supplement 0.38 (1.20)
Remdex * Cold Remedy 0.52 (1.26)
Nitro Tech 0.53 (1.68)
Zilactin + Cold Sore Ointment 0.53 (1.30)
Casein Protein 0.72 (1.85)
Seventh Generation Tub and Tile Cleaner 0.51 (1.55)
Derma+ Hair Removal 0.26 (0.94)
Opilca 0.14 (0.60)
Participants
A total of 104 undergraduates (66 males and 38 females) recruited from introductory psychology courses at North Carolina State University. Age range was 18-34 years old and the average age was 18.9 (SD = 1.9) years old. They received research credit for their
participation (see Appendix X for other demographic information).
Experimental Design
A 3 (Warnings on products groups: no product warnings vs. presence of product warnings vs. presence of product warnings and memory) x 2 (Warning quality: weaker vs.
stronger) x 3 (Frequency of ads: 1 time vs. 6 times vs. control) mixed – factorial design was employed. Warnings on products groups and warning quality were between-subjects factors and frequency of ads was a within-subjects factor.
Warnings on products groups were manipulated into three levels depending on when the product perception ratings were done: no product warnings, presence of product warnings, and presence of product warnings and memory. Figure 2 shows the task sequence for each
group including all experimental tasks and its different order. For no product warnings condition, half of the participants completed product perception ratings after seeing the product ads but before being exposed to the warnings with products. The other half of the
participants was split into two groups: presence of product warnings and presence of product warnings and memory. Participants in the presence of product warnings rated the products after seeing the ads and the warnings with products, but before the warning memory test. Participants in the presence of product warnings and memory group rated the products after
seeing the ads, the warnings with products, and completing the warning memory test. This division was conducted to examine and control for any possible carry over effects the product ratings might have on later tasks. This was decided a priori that if there were no statistical
Figure 2. All Tasks Completed by Exposure to Warnings on Products Groups
According to the total number of ads presented, frequency of ads was manipulated on
three levels: 1 time, 6 times, and control. In the 1 time condition, participants were exposed for one time for a product. In the 6 times condition, participants saw the product advertised six times with the three different ad versions given twice for each product and the order of presenting the three versions of ads was randomly assigned. In the control condition,
participants were exposed to only brief general product information such as the product name, brief manufacturer’s location information with no images (see Figure 6). A copy of samples of ads is shown in Appendix F.
Warning on products 1) No product warning (n = 52)
2) Presence product warning
(n = 26)
3) Presence product warning &memory (n = 26)
Start End
Ads1
Ratings
Products w/
warnings2 Distr
Warning Memory
Familiarity Form
Note. Distr – Distractor task. 1 manipulated by three levels with control, 1 time, and 6 times exposure.
2
manipulated by two levels with weaker and stronger. Products w/ warnings2 Warning Memory Warning Memory
All Tasks Completed
Ads1 Familiarity Form Ratings Distr
Ads1 Familiarity
Form Ratings
Products w/
The dependent variables were ratings of perceived hazardousness, effectiveness, familiarity, and knowledge for product perception. Warning memory was also measured.
Materials
Consumer products. As shown Figure 3, three different types of consumer products,
Zout (Laundry Stain Remover), Remdex (Cold Remedy), and Isopure (dietary supplement - protein powder) were used based on the preliminary study.
Figure 3. Three Consumer Products used in Experiment 1
Magazine binders. Experimental stimuli (e.g., a magazine) and general procedure
was similar with Conzola’s study (2003). The product ads were incorporated into a series of articles and other advertisements taken from Southern Living – monthly, lifestyle magazine
of the southern U. S. Articles and advertisements were clipped from back issues of Southern Living with the pages rearranged to incorporate the experimental ads. Each page was placed
in a clear, plastic, protective cover and all of the pages were numbered and placed in a
three-ring binder (see Figure 4).
Figure 4. Three Binders and a Magazine 'Southern Living'
Three binders were created. The experimental ads were inserted on pages 1, 8, 17, 20, 22, 25, 29, and 34 of the binder. That is, each binder had 8 experimental ads. The pages on which ads appeared for the various products are shown in Table 2. When ads were presented 6 times, three different versions of ads were repeated twice in a random order. The binder
numbers of the magazine correspond to the rows of the Latin Square shown in Table 3. The remaining pages of the binder included the magazine articles and other distractor ads. Besides the experimental ads, all other contents were same among three binders.
Table 2
Placement of Experimental Ads in Each Binder of the Magazine
Page # Binder 1 Binder 2 Binder 3
1 Zout Remdex Remdex
8 Isopure Remdex Zout
17 Isopure Remdex Zout
20 Isopure Zout Zout
22 Isopure Remdex Isopure
25 Remdex Remdex Zout
29 Isopure Remdex Zout
34 Isopure Remdex Zout
Table 3
Latin Square Showing Product Advertisement Condition Combinations
Binder Control 1 time 6 times
1 Zout Remdex Isopure
2 Remdex Isopure Zout
3 Isopure Zout Remdex
Magazine rating form. Participants rated the attraction of each page in the binder.
Attraction was defined as the likelihood the participant would stop and read the product advertisement. A 9-point Likert-type scale was used with the following anchors: (0) not at all likely, (2) somewhat likely, (4) likely, (6) very likely, and (8) extremely likely. The purpose
of the attraction rating task is to ensure that participants looked at each page in the binder. Attraction ratings were not analyzed (see Appendix D).
Product advertisements. A total of 9 ads were created to serve as the experimental
stimuli. Three different versions of advertisements were created for per product. The ads had images and statements about the positive function of the product. Statements were
incorporated into the existing ad copy or the ads used in previous study (Conzola, 2003) as multiple-lined text, placed near the center or bottom of the ads. Also some images or color
were modified using Adobe Photoshop software.
In the control condition, instead of presenting a full ad, it contained only brand name, contact information, and product company address with no images. All ads were printed in
Figure 5. Examples of Three Versions of Ads for Each product
Figure 6. Control Conditions for Three Products
The advertisements for the three products were rotated through the three levels of frequency of ads according to a Latin Square (see Table 3). Participants were assigned
according to Binder 1, 2, and 3. In each binder, three warnings on products groups of
participants were assigned randomly and they were exposed to the product advertisements. In Zout – version 1
Isopure Remdex – version 2
3
Isopure – version 3
the 6 times condition, participants saw the product advertised six times with the three different ad versions given twice and the order of presenting the three versions of ads was randomly assigned. The specific ads to which each participant was exposed are shown in
Appendix L.
Product perception rating forms. A separate product rating form was used for each
product. Each rating form comprised of five questions: perceived hazard, perceived
effectiveness, perceived familiarity, perceived knowledge, and likely to purchase. Purchase intent rating was added in the questionnaire to disguise the real purpose of the current research and to make participants believe that the purpose of the research was something
other than measuring attitudes or beliefs toward products. The questions given on the form were listed in Table 4. Each question was provided with a 9-point scale: 0 indicates low perception and 8 indicates high perception. Table 5 shows anchors with description for each
dimension of product perception. A sample of the rating form is shown in Appendix E.
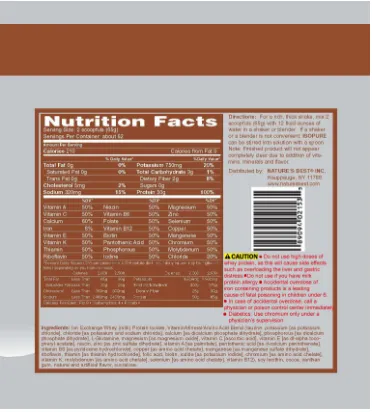
Products with warnings. Following exposing to ads, three products were presented
to participants for examination. Each product includes a brand name, instructions how to use the product, and warning information including potential hazard information. Product
information and warning labels were either removed from existing product and digitally scanned into a computer or color-copied from the stimuli from the previous study (e.g., Conzola, 2003). Those labels were attached onto existing products using self-adhesive paper.
Table 4
Questions given for Product Perception Rating Forms by Each Product
Products Questions given for product perception rating forms
Zout (stain remover)
(1) How hazardous would this product be to use?
(2) How effective would this product be at removing stains? (3) How familiar are you with this product?
(4) How knowledgeable are you about this product?
(5) How likely would you purchase this product in the future?
Remdex (cold remedy)
(1) How hazardous would this product be to use?
(2) How effective would this product be at reducing cold and cough? (3) How familiar are you with this product?
(4) How knowledgeable are you about this product?
(5) How likely would you purchase this product in the future?
Isopure (dietary supplement)
(1) How hazardous would this product be to use?
(2) How effective would this product be at improving muscle growth? (3) How familiar are you with this product?
(4) How knowledgeable are you about this product?
(5) How likely would you purchase this product in the future?
Table 5
Anchors with Description used in Rating Forms by Each Dimension of Perception
Dimension of perception Anchors with description
(1) Perceived hazard (0) Not at all hazardous, (2) Somewhat hazardous, (4) Hazardous,(6) Very hazardous, and (8) Extremely hazardous
(2) Perceived effectiveness (0) Not at all effective, (2) Somewhat effective, (4) Effective, (6) Very effective, and (8) Extremely effective
(3) Perceived familiarity (0) Not at all familiar, (2) Somewhat familiar, (4) Familiar, (6) Very familiar, and (8) Extremely familiar
(4) Perceived knowledge
(0) Not at all knowledgeable, (2) Somewhat knowledgeable, (4) Knowledgeable, (6) Very knowledgeable, and (8) Extremely knowledgeable
(5) Likely to purchase
(0) Not at all likely to purchase, (2) Somewhat likely to purchase, (4) Likely to purchase, (6) Very likely to purchase, and