Tests. (Under the direction of Dr. Joan J. Michael.)
Although widely used, there exists very little published research on the equivalence of
web-based cognitive ability tests used for employee selection to their original
paper-and-pencil versions. This issue is even further complicated by the limited research into the
effects of proctoring on these types of tests. To investigate this issue, data were analyzed
from the Wonderlic Personnel Test (WPT) and the Wonderlic Personnel Test-Quicktest
(WPT-Q). Using the Differential Functioning of Items and Test (DFIT) procedure, data
from 325 paper-and-pencil WPT administrations were compared to 325 web-based
proctored administrations of the test. To check for the effects of proctoring, 108
proctored administrations of the WPT-Q were compared to 104 unproctored
administrations again using the DFIT procedure. The results indicated that although the
differences in administration produced low levels of differential item functioning (DIF),
there was enough DIF to warrant conducting new validation studies when changing the
mode of administration.
The Effects of Mode of Administration on Timed Cognitive Ability Tests
By
Kyle Huff
A dissertation submitted to the Graduate Faculty of North Carolina State University in
partial fulfillment of the requirements for the Degree of
Doctor of Philosophy
March 27, 2006
Industrial/Organizational & Vocational Psychology
Approved By:
_____________________________ Dr. Joan J. Michael
Chair of Advisory Committee
_____________________________ _____________________________ Dr. Mark A. Wilson Dr. John Fleener
_____________________________ Dr. Paul Mulvey
Dedication
I would like to dedicate this dissertation to my friends and family. Without their support
and encouragement, I could never have made it this far. I would also like to dedicate this
to the memory of my cousin, Corporal Justin Huff, USMC, whom I will always
Biography
Kyle C. Huff was born on March 24, 1975 in St. Louis, MO. Kyle’s family
resides in Dunwoody, GA. After completing high school in Dunwoody, he attended the
Georgia Institute of Technology. He graduated in 1998 with a BS in Management and
two certificates: one in Social/Personality Psychology and the other in
Industrial/Organizational Psychology.
In the fall of 1998, he went on to attend Georgia College and State University in
Milledgeville, GA. While there, he supported himself working as a research assistant
conducting research on a variety of topics. He graduated from there with a MS in
Psychology in 2000.
In the spring of 2000, Kyle was accepted into the Industrial/Organizational
Psychology program at North Carolina State University. He has spent the last 6 years as
Acknowledgments
I would like to thank Wonderlic Inc for their generous support of this research.
Without them providing the data and test materials, this research would never have been
possible. I want to thank my advisor, Joan J. Michael, for her guidance on this project. I
would also like to thank Adam Meade, Bart Craig, and Phillip Braddy for their assistance
with the IRT analysis. Finally, I would like to thank the rest of my committee, John
Fleenor, Paul Mulvey, and Mark Wilson for their patience and help in the final stages of
Table of Contents
Page
List of Tables……… vi
List of Figures………... vii
List of Appendices………... viii
Introduction………... 1
Evolution of Computer-Based Testing….……… 1
Computer-Based Testing Concerns……….. 3
Web-Based Testing………... 4
Advantages of Web-Based Tests……….. 5
Web-Based Testing Issues……….... 6
Usability……… 11
Measuring Usability………. 13
Research Questions………... 15
Methods………..………... 17
Participants……… 17
Measures………...……… 17
Procedures………. 18
Proctored Administration………. 18
Unproctored Administration……… 19
Results………... 20
WPT………. 20
WPT-Q………. 22
Discussion………. 27
List of Tables
Table 1 DIF Statistics for Factor 1 of the WPT - Verbal Ability………. 39
Table 2 DIF Statistics for Factor 2 of the WPT - Logical Reasoning………….. 39
Table 3 DIF Statistics for Factor3 of the WPT - Mathematical Ability………... 40
Table 4 DIF Statistics for Items 1-45 of the WPT……… 41
Table 5 Differential Test Functioning (DTF) Results for the WPT……….. 41
Table 6 Correct and Attempted information for items 1-45 on the Wonderlic Personnel Test………. 42
Table 7 Response Types for the Web-Based WPT items 1-45……….. 43
Table 8 English as Primary Language………. 43
Table 9 Ethnicity………... 43
Table10 Means for the Proctored and Unproctored Group………. 43
Table 11 Gender………. 43
Table 12 Location of the Unproctored WPT-Q Administration………. 44
Table 13 Possible Distracters at the Testing Site for both the Proctored and Unproctored Administrations……….. 44
Table 14 DIF Statistics for Factor 1 of the WPT-Q - Verbal Ability………. 45
Table 15 DIF Statistics for Factor 2 of the WPT-Q - Quantitative Ability……… 45
Table 16 DIF Statistics for Items 3-29 of the WPT-Q……… 46
List of Figures
List of Appendices
Appendix A Environmental Survey……… 49
Appendix B Usability Survey………. 51
Appendix C Demographic Survey……….. 52
Table D1 Promax Rotated Loadings for the WPT……… 53
Appendix D Table D2 Promax Factor Correlations for the WPT………… 54
Table E1 Promax Rotated Loadings for the WPT-Q………… 55
Appendix E Table E2 Promax Factor Correlations for the WPT – Q……. 55
Table F1 Factor 1 Item Parameters for the WPT………. 56
Table F2 Factor 2 Item parameters for the WPT………. 56
Table F3 Factor 3 Item Parameters for the WPT………. 57
Appendix F Table F4 Item Parameter Estimates for Items 1-45 of the WPT………... 58
Table G1 Item Parameters for Factor 1 of the WPT-Q……… 59
Table G2 Item Parameters for the Factor 2 of the WPT-Q….. 59
The Effects of Mode of Administration on Timed Cognitive Ability Tests
The introduction of the computer to industrial/organizational psychology and
human resources has had a dramatic impact, and the results so far have been encouraging.
In general, reduced workload and increased productivity and efficiency have resulted
(Beaty, Fallon, & Barrett, 2002). This, of course, lets the human resource departments
become more strategic in nature. Unfortunately, computer technology has traditionally
not been well researched in the field. It is only recently that computers and the Internet
have received increased attention. Despite the recent advances in our understanding of
the effects of the computer in I/O psychology, much still needs to be done.
The primary aim of this paper was to expand what little is known about
web-based cognitive ability testing. To accomplish this goal, several different aspects of
computers in psychological testing were covered. First, it was important to understand
the role that computers have had in psychological testing. Next, there is a discussion on
computer-based testing. Finally, the issues involved with web-based testing have been
explored.
Evolution of Computer-Based Testing
Despite the relatively recent popularity of web-based assessments, the area enjoys
a rich history that extends back several decades. The first use of computers in
psychological assessment served as an alternative to hand scoring, which is tedious, time
advantages. Although psychologists who used this service enjoyed saving time, probably
the greatest advantage was the reduction in scoring error (Gregory, 2000).
As time progressed, the computer’s impact on psychological testing continued to
evolve. The first computer-administered test appeared in the 1970s. Eventually,
computers conducted the entire testing process, from administration to report generation,
thereby resulting in even more advantages in terms of timesavings, cost, and error
reduction. The popularity of computer-based testing continued to grow so that now, at a
minimum, large test publishers offer computer-based report generation (McBride, 1998;
Gregory, 2000).
The next logical step in this evolution was moving psychological testing to the
Internet. Web-based psychological testing offers even more advantages than
computer-based testing. However, the popularity of this type of testing grew very quickly, raising
concern about the lack of empirical research. In fact, there was so much concern that the
American Psychological Association formed a task force in the fall of 2000 to study
web-based psychological testing (Naglieri, Drasgow, Schmidt, Handler, Priftera, Margolis, &
Velasquez, 2004).
At each stage in the evolution, new problems were realized. For example,
equivalence or invariance issues between computer administered tests and the traditional
paper and pencil administrations were realized early. Later, when tests were moved to
the Internet, issues such as proctored versus unproctored tests arose. Throughout the
current study, several of these issues have been identified and explored in more detail;
however, it should be noted that the issues identified in this study are by no means
Computer-Based Testing Concerns
Probably the greatest impact of computers in the testing field came with
computer-based tests (CBT). As previously mention, CBT has several advantages over
traditional paper-and-pencil tests. One advantage is that the same computer that
administers the test can also score, interpret, and generate reports, thereby saving time,
paper, and money. Additionally, CBT allows test developers to realize the application of
computer adaptive testing. Computer adaptive tests are procedures that allow for
accurate and efficient measurement of a construct. Adaptive testing offers an advantage
of shorter tests, which save time, while increasing efficiency and power. Third, a
potential exists to expand the content and presentation styles. This potential can include
incorporating multimedia applications into tests as well as testing in ways that previously
were not feasible with paper-based tests. Finally, the computer has the potential to
measure facets that cannot be measured with paper-and-pencil tests or to measure
existing facets in new ways (McBride, 1998; Gregory, 2000).
As the advantages of computer-based testing became more apparent, major US
organizations have moved, or are in the process of moving, from paper-and-pencil tests to
computer-based tests for employee selection. Various problems have been encountered
as this stage emerged. First, the question arose concerning whether computerized
versions of tests are as reliable or valid as the paper-and-pencil tests. Research has
demonstrated that the psychometric properties of power tests appear to exhibit small or
even non-existent differences between paper-and-pencil and computerized versions.
Power tests are tests that allow plenty of time for a subject to complete all items, but the
However, speed tests, which are timed tests that contain items of uniform low difficulty,
but have time constraints that make it make it difficult for most people to complete all
items, can vary on both psychometric characteristics and construct composition
(Buchanan, 2000; Gregory, 2000; McBride, 1998). A third type of test, a power test with
a time limit is a combination of the two previous types of test. Examples of this type of
test include the Graduate Record Exam and the Scholastic Achievement Test. Research
has demonstrated that a well-developed power test with a time limit seems to maintain
the original properties of the paper-and-pencil version even in a computerized version
(Mead & Drasgow, 1993).
A second concern relates to the technology itself. Computer systems available for
purchase today are overall better than the computers manufactured just a few years ago.
Variations in operating systems, processing time, hard drive seek time, and displays can
all have an impact on testing (Buchanan, 2000; Gregory, 2000; McBride, 1998).
Web-Based Testing
Web-based testing (also called Internet-based testing) has some distinct properties
that make it different from computer-based testing. The most noticeable difference
between the two administration modes is that a web-based test is administered through a
web browser, whereas a computer-based test is not. Another major difference that could
exist between the two methods is the Internet connection. A test that is administered over
a high-speed Internet connection would enable the web-based test to appear very similar
to a computer-based test. However, the slower this connection is, the greater the
difference. Slower connection speeds could cause the test taker to have to wait for longer
feedback to be sent to the test taker. Since a web-based test is administered through a
web browser and possible differences in connection speed exist, Internet-based tests
should be considered as a different administration mode from computer-based tests.
Advantages of web-based tests. Despite these differences, all of the advantages
and disadvantages that exist for computer-based tests also exist for web-based tests.
However, web-based tests have additional advantages over computer-based tests. The
most obvious advantage is that it is possible for an individual to complete a web-based
test at nearly any time and at any place that they wish. In addition to this, almost any
computer lab can become a testing center. These two advantages are probably the most
cited reasons for engaging in web-based testing. Also, prior research has shown that
web-based tests can have increased psychometric properties over their paper-and-pencil
counterparts. Additional advantages include researchers being able to collect data much
more rapidly, conveniently, at lower costs, and from populations that are traditionally
difficult to reach. New tests can also be made available throughout the world almost
instantly. As a result of the minimal costs associated with web-based testing as well as
the scalability of web-based systems, additional test administrations have lower costs
than those for any other administration mode. Furthermore, the direct input of answers
by test-takers provides more accurate scoring than do traditional paper-and-pencil tests.
Finally, test norms can be continuously and immediately updated (Buchanan & Smith,
1999; Bridgeman, Lennon, & Jackenthal 2003; Lievens & Harris, 2003; Naglieri,
Draasgrow, Schmit, Handler, Prifitera, Margolis, & Velasquenz 2004; Polyhart, Weekly,
The advantages that can come from the use of a web-based test can be seen in the
following example. A government agency implemented an on-line selection system.
Their goal was to select current employees for participation in an information-technology
(IT) training course. The application process had four stages. During stage one,
interested employees filled out an application on-line. Those who possessed the
minimum requirements for the training were sent an e-mail inviting them to take an
on-line psychological test for stage two. Four hundred fifty applicants took the on-on-line test
at stage two. From that group, seventy-six individuals were selected for stage three. In
stage three, applicants took a proctored computer-based test similar to the first one.
Applicants who successfully passed this stage were invited for interviews (Beaty, Fallon,
& Barrett, 2002).
In, the end, the government agency selected sixty employees to participate in the
IT training. If the test had not been given on-line, it was estimated that it would have
taken six weeks to administer the test to every applicant. With the web-based system, the
proctored testing was finished in nine days. It was estimated that by using this system
there was a 500% savings in time for the organization (Beaty, Fallon, & Barrett, 2002).
Web-based testing issues. In addition to all of the advantages, there are a number
of issues that are associated with web-based testing. One of the major issues associated
with this type of testing, and a major question addressed by this paper, is that of
administration mode, proctored vs. unproctored and computer-based vs. web-based vs.
paper-and-pencil. Another important issue associated with based testing is that
web-based delivery systems have to deal with a broader range of computer hardware and
hardware and software settings, the amount of information that is displayed on the screen
and the legibility of that information may have an impact on test scores. Also, test
security and cheating have received much attention recently. Another popular issue is the
question of whether various groups have as equal access to the Internet as do other
groups. Finally, there is the possibility of normative issues arising with web-based tests.
These normative issues come into effect when someone from a different population than
that for which the test was designed takes the test. (Bridgeman, Lennon, & Jackenthal,
2003; Naglieri, Draasgrow, Schmit, Handler, Prifitera, Margolis, & Velasquenz, 2004;
Polyhart, Weekly, Holtz, & Kemp, 2003; Epstein, Klinkenberg, Wiley, & McKinley,
2001; Lievens & Harris, 2003). Research studying these issues has lagged behind the
development of new technologies and web-based testing trends.
Of the previous issues, equivalence of web-based tests to their paper-and-pencil or
computer-based counterparts was selected as the primary topic of this study. In general,
most of the research that has been conducted on the equivalence of web-based testing
occurs in the personality arena with very little testing occurring for web-based ability
tests. Thus, it appears that there is a need to demonstrate the equivalence of web-based
ability tests.
One of the few studies to demonstrate the equivalence of the web-based version
with a paper-and-pencil version on web-based cognitive ability tests was conducted with
the Wonderlic Personnel Test (Dembowski & Callans, 2000). In this study, participants
were divided into two groups, each taking a web-based version and a paper-and-pencil
version. Additionally, each participant completed two alternate forms of the tests. One
completed in the paper-and-pencil administration. The entire design was counter
balanced. Overall, the researchers were able to demonstrate equivalence, not only
between the two alternate forms, but also between the administration modes.
However, despite the finding of equivalence, the Dembowski & Callans (2000)
study had a major issue. The analysis consisted of t-tests between Wonderlic Personnel
Test forms and method of administration, a Wilcox Signed Rank test to compare
distributions, and a Spearman Rho to compute the correlation between forms. While the
analysis of the data revealed encouraging results, these types of studies have been
criticized, most notably by Epstein, Klinkenberg, Wiley, and McKinnley (2001) for using
limited statistical comparisons. Another important limitation of this study is that it did not
test to see if the web-based version of the Wonderlic Personnel Test is equivalent to it’s
paper-and-pencil counter-part in an unproctored setting.
Further complicating the issue of establishing the equivalence of web-based
measures, is this question of whether or not a test is administered in a proctored or in an
unproctored environment. Proctored web-based testing occurs when the test-taker
completes the test form in the presence of a test administrator. Unproctored testing
occurs when a test-taker completes the test form in any location with Internet access and
without direct supervision of a test administrator (Polyhart, Weekly, Holtz, & Kemp,
2003). Sinar and Reynolds (2004) have noted that more and more web-based testing is
being administered in unproctored settings.
The question was then raised whether a test administered in an unproctored mode
actually fits the definition of a standardized test. Namely, a standardized test can be
least, three parts to this “systematic procedure”. First, item content is chosen from the
behavioral domain that the test is supposed to measure. Second, the procedures for
administration are standardized such that each time the test is administered, directions for
taking the test and recording the answers are identical, time limits (if applicable) are the
same, and distractions are kept to a minimum. Finally, the scoring of the test is objective.
These three requirements are stipulated to try to insure that the test is free from
contaminants (Cascio, 1998; Gregory, 2000). Obviously, tests that are administered in an
unproctored setting violate the second part of the definition of a test because there is no
control in place for the distractions that could be present in an unproctored environment.
The issue of an unproctored environment is probably more critical for cognitive
ability tests than for personality tests, and probably even more so for timed tests than for
tests that are not timed. There are several factors in the test taker’s environment that can
cause contamination of test scores. These include temperature, humidity, illumination,
and noise. Noise in particular is a factor that must be controlled in testing (Gregory,
2000). Noise has been shown to cause decreases in performance on tasks, especially
when the noise is unpredictable, intermittent, and loud (Boggs & Simon, 1968).
However, the effect of noise on performance on psychological tests is an area that has
had very little research (Gregory, 2000). It seems likely that a person taking an
unproctored web-based test could be exposed to noise in the environment, such as music,
people talking, or a television being on in the background. However, it seems unlikely
that there would be more noises that are unpredictable, intermittent, and loud in these
scenarios. Therefore, the effects of an unproctored setting on web-based tests needs to be
Potosky and Bobko (2004) conducted a study comparing paper-and-pencil
versions of a timed cognitive ability test to a web-based unproctored version. The
researchers used repeated measures under simulated high-stakes testing conditions to see
if the tests were equivalent. Their results were mixed. First, the researchers correlated
the scores on the two versions of the test. For the cognitive ability test, they found a
moderate cross mode correlation. Additionally, Potosky and Bobko (2004) found
significantly different means between the two administration modes. Because of this, the
moderate correlation was probably a reflection of the sampling of similar behavioral
domains and not necessarily evidence of measurement equivalence.
In a study to test the equivalence of proctored versus unproctored environments,
Oswald, Carr, and Schmidt (2001) conducted research on web-based personality and
cognitive ability tests versus their paper-and-pencil counter parts. Using a 2 x 2 between
subjects factorial research design (proctored vs. unproctored and paper-and-pencil vs.
web), the researchers used confirmatory factor analysis to compare the equivalence of the
tests in the four conditions. They found that for the personality test, measurement
equivalence between paper-and-pencil and web-based was demonstrated only for the
proctored setting and not for the unproctored setting. For the ability measures,
equivalence was demonstrated between the paper-and-pencil and web-based tests in both
proctored and unproctored settings.
While to date, the research by Oswald, Carr, and Schmidt (2001) seems to be the
most comprehensive of the studies demonstrating equivalence in cognitive ability tests,
there are still some problems associated with the study. First, the researchers did nothing
gather any information about the environment in which the participants took the test in
the unproctored setting. Finally, there was no attempt to measure the usability of the
web-based tests.
After reviewing the available research, it is apparent that more research needs to
be conducted on the equivalence of web-based cognitive ability tests to paper-and-pencil
versions. Very few studies have investigated this issue. Unfortunately, the few studies
that have been conducted to date show inconsistent results.
Usability
Usability as a construct has several definitions. One definition offered by Nielsen
(2003) is that usability is a quality attribute of interfaces that assesses how easy it is to
use a particular user interface. Nielsen further divides usability into five components:
learnability, efficiency, memorability, errors, and satisfaction. On the other hand, an
alternate definition by Lundby & Mack (2003) defines usability as having three
components: efficiency, effectiveness, and user-satisfaction.
Nielsen (2003) reported that usability could affect employee productivity since
intranet systems (performance management systems, web-based employee surveys, etc.)
with low usability can cause the employees to waste time trying to use the system.
Additionally, Nielsen reported that the usability of a website has been known to affect
people’s perceptions of a website as well as to affect their use of that website. If a
website is difficult to use, difficult to read, or wastes people’s time, then they leave.
If these known effects of poor usability that are reported by Nelson (2003) are
applied to web-based testing, the results could be the same. If a person has difficulty
text of the test, then they could leave before they finish the test. However, there is
another possible test taking scenario that poor usability could cause. Poor usability could
cause people to complete the form incorrectly, thereby introducing much error into the
assessment process.
The importance of measuring usability of a computer-based or a web-based test in
a proctored testing environment using a relatively uniform standard hardware and
software configurations is apparent; however, measuring usability in an unproctored
environment in which computers could have a much broader range of hardware and
software settings is even more important. In one study that investigated this issue, Sinar
and Reynolds (2004) found that people who took an unproctored test at home rated the
test differently in terms of user friendliness than did people who took a proctored test or
an unproctored test outside of their home.
Another study investigating the effects of usability in computer-based and
Internet-based assessment (Bridgemen, Lennon, and Jackenthal, 2003) found that screen
size and resolution impacted verbal scores on SAT questions. Specifically, it was found
that participants who had more information on the screen tended to have higher test
scores on the verbal portion of the test than did those who had less information on the
screen. These results were not found in the mathematics portion of the test. It appeared
that scrolling between the passage text and the test items caused the difference. In terms
of web-based testing, this finding implies that the definition of a standardized proctored
test needs to be expanded to include appropriate hardware and software settings.
However, it should be noted that the verbal test used was composed of reading
questions regarding the text. Therefore, these results may only apply to this particular
type of question and not to all items that assess verbal ability. Also, the test used in that
particular study was a power test with what the authors called a generous time limit. It is
unknown at this point what effect a more stringent time limit might have had on the
results.
Measuring usability. The Internet has posed an interesting problem in assessing
usability. Traditionally, the interface that usability measures is the whole system. Lewis
(1995) stated that proper usability evaluations of a computer system would include not
just what a person sees on the screen, but also the keyboard, mouse, and other hardware
that is being used. Usability evaluations of web-based systems seem to evaluate only the
software interface. Limiting the scope of the interface to what is seen on the screen has
both strengths and weaknesses.
The strength is that this procedure simplifies the usability evaluation since all
combinations and permutations of hardware and software settings are not tested, thereby
saving resources. One weakness of this approach is that it can introduce additional error
into the measurement of usability. Since this possibility for additional error exists, then
the recommendation by Lundby and Mack (2003) of taking different types of
measurements, such as an efficiency measurement and a satisfaction measurement, when
conducting a usability evaluation seems to be even more important. An additional
problem with this limited definition of interface is that traditional user satisfaction
questionnaires were designed to measure the usability of the complete system.
For web-based testing, the definitions offered by Nielsen (2003) and Lundby and
the items are scored either right or wrong? If the test has detailed instructions, then what
is measured by Nielsen’s (2003) learnability (how easy it is for users to accomplish tasks
the first time they visit a website)? Also, learnability is not very useful in testing since
most tests seem to share a very similar layout. Effectiveness as part of the usability
construct seems very important in purchasing a product over the Internet, but seems to
have to do more with the overall quality of the test than with the usability of a web-based
cognitive ability test. Finally, memorability is not a property that is usually associated
with psychological tests. Memorability (Nielsen, 2003) is defined as a property of a web
page that assesses how easy it is for a person to reestablish proficiency upon return to the
website after a period of time has passed. Once again, if there are well-written
instructions and a standard test format, then memorability is not a property that applies to
a web-based test. If we adapt the learnability and memorability definitions to web-based
tests, it appears that there is a new component of usability that would have to do with the
instructions used with the web-based test.
Efficiency as defined by Nielsen (2003) is how quickly users can perform tasks.
Lundby and Mack (2003) defined efficiency as the level of resources expended by the
users in completing tasks. When measuring efficiency, both definitions suggest using
measures such as time spent on task. Nielsen defined satisfaction as how pleasant the
design is to use, whereas Lundby and Mack defined satisfaction as how satisfied users are
with the overall experience. These two components of website usability seem to tie into
web-based test usability. For example, efficiency could apply to what the test taker has
With the use of the three hypothesized usability components, it appeared possible
to use them to generate new measures of usability as they relate to web-based tests. By
integrating the various definitions, it appeared that a usability measure for a web-based
test should be composed of a rating of the instructions that accompany the form, an
assessment of ease of completing the test, and an overall estimate of satisfaction with the
test. To meet these needs, a survey was developed (see Appendix 2) for use in measuring
the usability of web-based tests. This survey appeared to be similar to the survey used by
Sinar and Reynolds (2004) that defined user friendliness as system speed, efficiency, ease
of navigation, and instructions for completion.
Besides assessing usability for informational and development purposes, there
exists a theoretical reason to measure usability as well. If hardware and software settings
affect test performance as they did in the Bridgemen, Lennon, and Jackenthal (2003)
study, then it is possible that the adverse effects of the hardware and software settings
could be detected by a usability measure. Therefore, when comparing a test that is
administered in a proctored environment to the same test administered in an unproctored
environment, then a comparison of the usability measures could reveal whether the
hardware and software settings had an effect on the test.
After reviewing the research on this issue, it is apparent that very little is
understood about the usability of web-based tests. In addition, very little information is
available regarding how a person would measure usability for a web-based timed test.
Research Questions
After reviewing the available research on web-based cognitive ability testing, it is
have tried to examine whether these types of tests are equivalent to their paper-and-pencil
versions or whether they are equivalent in proctored or unproctored settings have found
conflicting results. An additional problem exists since the majority of these studies used
limited statistical comparisons by relying on either correlations or statistics based on
linear equations. There has not been a study that used the Differential Functioning of
Items and Tests (DFIT) framework, which uses a nonlinear analysis. Finally, it is also
apparent that the effects of technology on web-based cognitive ability testing have been
overlooked in all of the studies specifically investigating test equivalence.
This study sought to investigate these neglected areas. Specifically, in this study
the following research questions were investigated:
1. To what extent are proctored paper-and-pencil and proctored web-based
versions of a timed cognitive ability test equivalent?
2. To what extent are web-based proctored and web-based unproctored versions
of a timed cognitive ability test equivalent?
3. To what extent did the relationship between a timed cognitive ability test and
a criterion variable remained the same?
4. To what extent do the different hardware and software settings in an
unproctored administration, as measured by a usability questionnaire, have an
effect on scores?
Methods
Participants
Participants in this study were 220 students in introductory psychology classes at
a large southeastern public university who were randomly assigned into either the
proctored web-based group (112 participants) or the unproctored web-based group (108
participants). In exchange for their participation, the subjects received one research
credit that was used to partially satisfy their course requirements. Additionally, archival
data from 650 adults, obtained from Wonderlic Inc, were analyzed as a part of this study.
These 650 participants were part of one of two groups, 325 participants that completed
the paper-and-pencil version of the Wonderlic Personnel Test (WPT) and 325
participants that completed the web-based WPT in a proctored setting.
Measures
The WPT is a timed test of cognitive ability for use in personnel selection.
Participants in this study completed form I of the WPT. Each test taker had 12 minutes to
complete the 50-item test (Wonderlic, 2006).
As part of this study, the undergraduate participants completed the web-based
Wonderlic Personnel Test-Quicktest (WPT-Q). The WPT-Q is a 30-item timed test of
cognitive ability for use in personnel selection that is available for administration over the
Internet. Each test taker had 8 minutes to complete the WPT-Q (Wonderlic, 2005).
In addition to the WPT-Q, the undergraduate participants completed three
questionnaires during this study. The first questionnaire, Environmental Questionnaire
(see Appendix A), was designed to assess the conditions in which the test is completed.
assess usability issues associated with the Internet administrations. These issues included
connection speed, ease of use, and visual layout. The final questionnaire, Demographic
Questionnaire (see Appendix C), was designed to gather data on various demographic
variables (age, gender, ethnicity, primary language, college GPA, year in college, and
SAT scores) that maybe associated with the participants’ scores on the WPT-Q.
Procedures
Participants registered for an administration time at the campus Experimetrix
website and were randomly assigned to one of two testing conditions; proctored Internet
or unproctored Internet. Testing occurred in computer laboratories for the proctored
Internet-based administration in a standardized setting. Administration of the instruments
occurred in groups no larger then 30. The participants in the unproctored Internet-based
administration were able to complete the test wherever they chose.
Proctored administration. Upon entering the computer laboratory, the
undergraduate participants were instructed to sit in front of a computer terminal
containing instructions that guided them through the rest of the study. The computers
that were used in this study where either a Dell Precision 650 with an 18” LCD Flat Panel
monitor (with resolution set at 1280x1024) or a Dell Dimension 4700C with a 15” LCD
flat panel monitor (with resolution set at 1024x768). First, participants were required to
read an Internet-based informed consent form. Then, they received instructions on taking
the WPT-Q. Administration of the WPT-Q followed the standardized instructions
exactly. After completing the WPT-Q, the participants were required to fill out the
Environmental Questionnaire, Usability Questionnaire, and the Demographic
Unproctored administration. Participants in this group first reported to a
computer laboratory similar to that in the proctored administration. Once there, they
were directed to sit at a computer and read over an electronic informed consent form,
directions for participating in the study, and complete a web-based form on which they
provided their contact information. After the participants left they room, they were then
sent three e-mails. The first e-mail was a set of instructions explaining how to participate
in the study. The second e-mail was an invitation to complete the WPT-Q. The third and
final e-mail contained a link to the questionnaire. Administration of the WPT-Q followed
the standardized instructions. After completing the WPT-Q, the participants completed
the Usability Questionnaire, the Environment Questionnaire, and the Demographic
Results
The results of this research were divided into two main sections. The first section
was concerned with the analysis of the WPT (Research Question 1) while the second
section was devoted to the WPT-Q (Research Questions 2 - 5). In each of these sections,
the results of an exploratory factor analysis of the items for the test and a Differential
Functioning of Items and Tests analysis are reported. These analyses are followed by
additional analyses that are specific to each test.
Wonderlic Personnel Test (WPT)
Research Question 1
Since there was little or no variability in items 46-50, these items were dropped
from the data sets and all subsequent analyses. Since this was a timed test, very few test
takers were able to reach these five items on either version of the WPT. Of those that
reached these five items, few were able to answer the questions correctly. In some cases,
no one was able to answer the items correctly. In fact, only item 48 had correct responses
on both the web-based version and paper-and-pencil version.
Exploratory Factor Analysis (EFA). As a first step in the analysis, an EFA was
conducted on items 1-45 from the WPT paper and pencil version to check for
unidimensionality using Mplus software version 3.13 (Muthen & Muthen, 2004). Since
the data were dichotomous, tetrachoric correlations were used with promax rotation.
Based on the analysis of the scree plot (see Figure 1), a three-factor solution seemed the
best fit for the data (see Appendix D for factor loadings). The first factor was named
named mathematical ability. Using this three-factor framework, the 45 items were split
into three scales. Items 1, 4, 8, 13, 22, and 24 did not appear to load on any factor.
Differential Functioning of Items and Test (DFIT). For the DFIT analysis, the
data were coded as correct, incorrect, or not reached for the participant’s responses to
each item per Ludlow and O’Leary’s (1999) recommendation. The three factors revealed
in the previous analysis, as well as items 1-45, were then subjected to a DFIT analysis
using the 2PL model. The analyses were conducted using the Bi-log-MG v3.0
(Zimowski, Muraki, Mislevy, & Bock, 2002), Equate v2.1 (Baker, 1995), and DFITD5
(Raju, 1999) programs. The DFIT analysis generated 88 differential functioning indexes
(39 Non-Compensitory Differential Item Function (NCDIF) indexes plus 3 Differential
Test Functioning (DTF) indexes, one for the each of the three scales, 45 NCDIF indexes
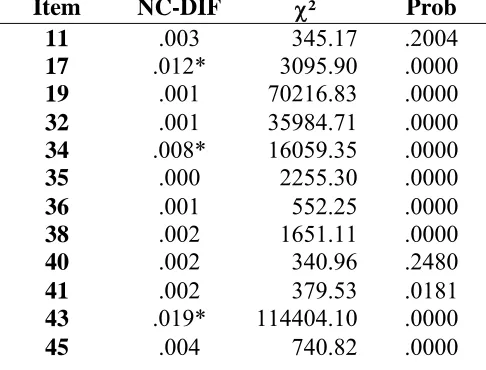
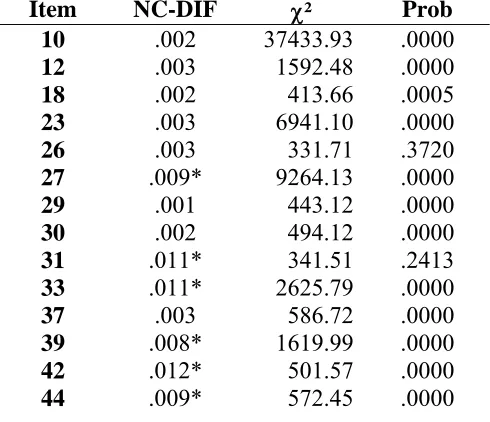
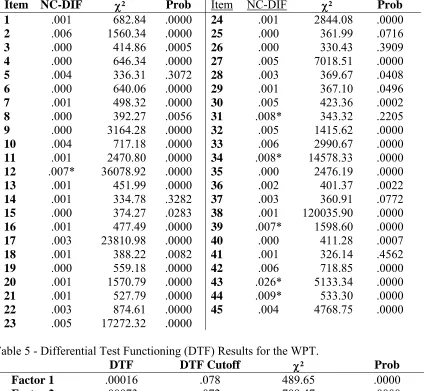
and 1 DTF index for items 1-45). The NCDIF indexes, along with the χ2 statistic, are
shown in Tables 1-4 for verbal ability, logical reasoning, mathematical ability, and items
1-45, respectively. The results of the DTF analyses are shown in Table 5. In DFIT
analyses, a difference in true scores for members of the various groups is considered
significant when the associated χ2 is significant and the NCDIF for an item exceeds an a
priori specified critical value. As show in Tables 1-4, several items demonstrated
Differential Item Functioning (DIF). While no items displayed DIF on the Verbal
Ability, both Logical Reasoning and Mathematical Ability had items that displayed DIF.
These items are 17, 34, 43 on Logical Reasoning and items 27, 33, 39, 42, and 44 on
Mathematical Ability. However, none of the three scales displayed DTF. The results are
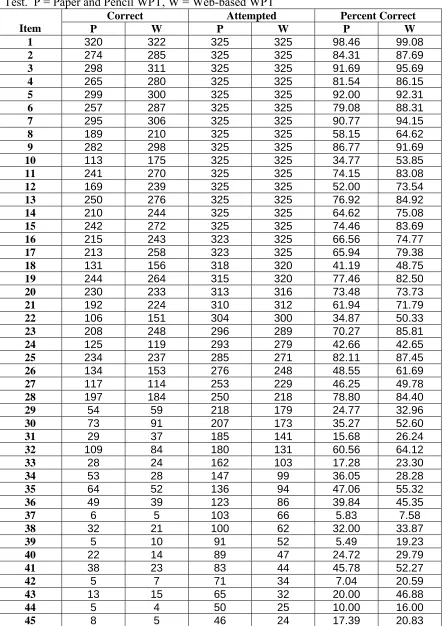
Comparisons of the different versions. Table 6 contains information on the
number of correct responses, number of participants who attempted each item, and the
percent of participants who got each item correct in relation to the number who attempted
the item. The most interesting information that this table reveals was that for about the
first half of the test, the web-based version had more participants attempt items than did
the paper-and-pencil version. This pattern changed for item 22 and the remaining items.
The paper-and-pencil version had more participants attempt items than did the web-based
version. However, for almost every item, the ratio of correct versus attempted was higher
for the web-based group then it was for the paper-and-pencil group. It appears then that
even though the web-based WPT had a higher correct to attempted ratio, it took longer
for people to complete.
For technical reasons, several of the response options differ for the two versions
of the WPT, and some of these differences warrant consideration. In general, participants
inputted their answers through the Internet in one of three ways, either through a
checkbox, a radio button, or a textbox. Of these three, checkboxes and radio buttons are
very similar. The checkboxes allowed participants to make multiple selections from a
list, whereas a radio button allowed only one selection to be made from a list. Textboxes
allowed a participant to type in data using the keyboard. Table 7 contains information on
the three response options and the items that use them. When this table was examined,
two things became clear. First, the checkbox was only used once for items 1-45 (item
Wonderlic Personnel Test – Quicktest (WPT-Q)
Only 212 participants out of the original 220 where used in the analysis. Of the 8
participants whose data were not included, one individual had missing data and was
therefore removed from the analysis. In addition, technical problems with the WPT-Q
necessitated removing data from seven participants in the unproctored group. The
technical problems that were reported came from a variety of sources. Three of these
participants were disconnected from the Internet while completing the test, three
participants had problems with their computers, and the final participant was unable to
complete the test as a result of problems with Wonderlic’s web server.
Research Question 2
Demographics. As a preliminary step, various demographic factors were
analyzed to compare the groups’ equivalence. All t tests were two-tailed. The two
groups were equivalent on English as a first language χ²(1, N = 205) = 0.0427, p > .05
(Table 8), ethnicity χ²(6, N = 204) = 2.3802, p > .05 (see Table 9), age t(188) = 0.83, p =
.83, d = .12 (see Table 10), credit hours completed t(195) = -1.14, p = .2516, d = -.16 (see
Table 10), GPA t(141) = 0.804, p = . 2334, d = .14 (see Table 10 for means), verbal SAT
score t(174) = .78, p = .4368, d = .12 (see Table 10), and Quantitative SAT score t(174) =
-0.42, p = .6715, d = -.06 (see Table 10). However, the two groups were different in
terms of their gender makeup in that the proctored group contained significantly more
males than females χ²(1, N = 207) = 4.8791, p ≤ .05 (see table 10).
To further test the gender factor, a Fisher’s z transformation was performed. The
data were grouped by gender to compare Pearson correlations coefficients between total
males was r = .47, df = 109, p < .0001 and for females was r = .62, df = 63, p < .0001.
These correlations were then analyzed using the Fisher’s z transformation. This analysis
resulted in an insignificant difference between the two correlations (z = 1.353, p = .1761,
two-tailed).
Exploratory Factor Analysis (EFA). As a first step in the analysis, an EFA was
performed on the proctored WPT-Q to check for unidimensionality using Mplus software
version 3.13 (Muthen & Muthen, 2004). Since the data were dichotomous, tetrachoric
correlations were used with promax rotation. Based on the analysis of the scree plot
(Figure 2), two-factor and three-factor solutions were considered. Using the combined
principles of parsimony and interpretability, a 2-factor solution was retained (see
Appendix E for factor loadings). Analysis of the items indicated that the first factor was
Verbal Ability, and the second factor was Quantitative Ability.
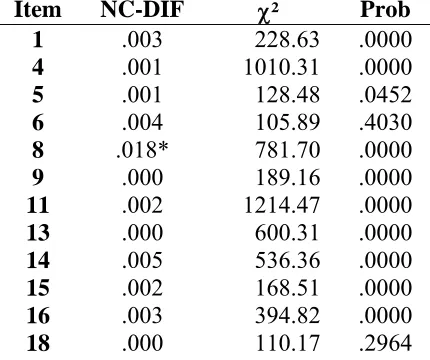
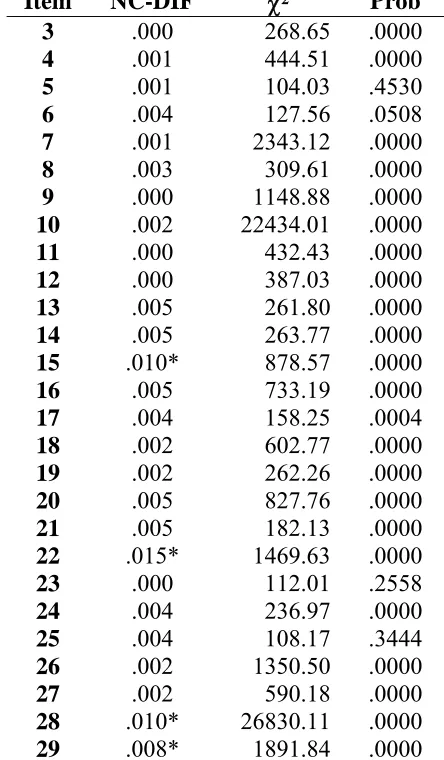
Differential Functioning of Items and Test (DFIT). For the DFIT analysis, the
data were coded as correct, incorrect, or not reached for the participants responses to each
item per Ludlow and O’Leary’s (1999) recommendation. The two factors revealed in the
previous analysis, as well as items 3-29, were then subjected to a DFIT analysis using the
2PL model. The analyses were conducted using the Bi-log-MG v3.0 (Zimowski, Muraki,
Mislevy, & Bock, 2002), Equate v2.1 (Baker, 1995), and DFITD5 (Raju, 1999)
programs. The DFIT analysis generated 56 differential functioning indexes (26 NCDIF
indexes plus 2 DTF indexes, one for each of the two scales, 27 NCDIF indexes and 1
DTF index for items 3-29). The NCDIF indexes, along with the χ2 statistic, are shown in
Tables 14-16 for verbal ability, quantitative ability, and items 3-29, respectively, and the
true scores for members of the various groups is considered significant when the
associated χ2 is significant and the NCDIF for an item exceeds an a priori specified
critical value. As shown in the tables 12-13, several items demonstrated DIF. These
items were item 8 on Verbal ability and items 22, 28, and 29 on Quantitative Ability.
However, neither factor displayed DTF. The results were similar for items 3-29 (see
Table 16).
Research Question 3
Comparison of correlation coefficients. The correlation coefficients for the
proctored and unproctored group were compared as an additional check for measurement
equivalence. As a first step, the Pearson correlation coefficients were computed between
the WPT-Q scores and the combined Verbal and Quantitative SAT scores for the
proctored (r = .41, df = 90, p < .0001) and unproctored group (r = .63, df = 82, p < .0001).
These correlations were then analyzed using Fisher’s z transformation. This analysis
resulted in a significant difference, z = 2.551, p = .0107.
Research Question 4
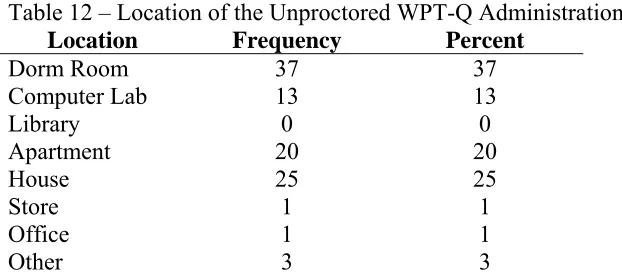
Environmental Questionnaire. While the proctored group participated in the
research in one of several computer laboratories, the unproctored group completed the
study in a variety of locations. The locations are summarized in Table 12. The
environment in which the WPT-Q was completed in for the proctored and unproctored
groups were compared using the results of the environmental questionnaire. The results
Research Question 5
Usability Questionnaire. To compare the usability of the proctored and
unproctored environment, responses to the usability questionnaire were scored 1 for
“Unsatisfactory” to 5 for “Excellent”. An EFA was conducted on the data using SAS
software version 9.1 to verify that the questionnaire was unidimensional. The Kaiser
Criterion and Scree Plot analysis both indicated a single factor solution. A Cronbach’s
Alpha reliability analysis yielded an α = .88. Therefore, it was concluded that the
usability questionnaire measured a strong single factor.
Since the previous analysis concluded a single factor for the usability
questionnaire, each participant’s responses were summed. The results were then
analyzed using an independent-samples t test, two-tailed. The sample means for the
proctored and unproctored groups were, respectfully, 30.76 and 29.74 and were not
Discussion
Following the format of the results section, this section has been divided into two
parts. The results of each test are first discussed independently. Then the overall
conclusions from this study are discussed.
Wonderlic Personnel Test (WPT)
Data from 650 participants who completed either the paper-and-pencil version of
the WPT or a web-based version were analyzed to investigate research question 1 of
whether or not paper-and-pencil cognitive ability tests are equivalent to web-based
cognitive ability tests. The analysis of the WPT revealed several items that displayed
differential item functioning (DIF) between the paper-and-pencil version and the
web-based version. Although only a minority of the items demonstrated differential
functioning, it can be reasonably concluded that the two versions of the test are not
completely equivalent.
Since only test scores were available for the analysis, causes for this differential
functioning are only speculative in nature, and the impact of the differential functioning
on test interpretation is unknown. However, in spite of the limited evidence, there
existed several possible explanations regarding the reasons why these two versions of the
test showed differential functioning. More insight regarding why the test behaved
differently in the two groups was gained by looking at the specific items.
From the analysis of the items used in the test it was indicated that participants
who completed the web-based WPT took longer to complete the test than did those who
completed the paper-and-pencil WPT and more textbox questions were used in the
However, if these findings are considered together with the fact that the WPT is a timed
test, then a possible psychological explanation surfaces regarding why the 8 items
demonstrated differential functioning -- namely self-efficacy.
Computer self-efficacy is a specific form of self-efficacy and is defined as a
judgment of one’s capability to use a computer (Compeau & Higgens 1995). Potosky
and Bobko (2004) hypothesized that individuals with high Internet self-efficacy would
find a web-based test easier and less stressful than would those with low Internet
self-efficacy, thereby allowing them to outperform individuals with low Internet self-efficacy.
It is possible that participants with low computer self-efficacy took longer to
complete the test than did participants with high computer self-efficacy. The textbox
questions could have been particularly problematic for the low self-efficacy participants.
If this phenomenon exists, then low computer self-efficacy could have a larger impact on
timed web-based tests than on tests that are not timed.
Wonderlic Personnel Test – Quicktest (WPT-Q)
Data from 212 participants were analyzed to investigate research question 2 --
namely whether or not a timed cognitive ability test functions the same in a proctored
web-based environment as it does in an unproctored web-based environment. Results of
the DFIT analyses indicated that several items on the WPT-Q did function differently for
the two conditions. The source of this differential function could have resulted from a
number of factors. The relatively small sample size used in this analysis may have
contributed to this result. However, the results of the Fisher’s z test, and the answer to
total SAT scores were significantly different for the proctored and unproctored groups,
thus strengthening the research findings for the second research question.
Demographic variables were ruled out as a factor in the differential functioning.
All but one of the analyses conducted on the demographic variables in this study showed
no significant difference between the proctored and the unproctored groups. The only
variable that did have a significant difference between the groups was gender. However,
since the two groups were equivalent in terms of SAT scores and GPA and the results of
the Fisher’s z, it is believed that the gender factor can probably be ruled out as the cause
of DIF.
These results were consistent with what appears to be the state of the field in
gender differences in cognitive ability. In this research area, the existence of differences
in cognitive ability between males and females seems to depend on the specific ability
being measured and on the sample on which the study was conducted (Feingold, 1996).
Research question 4 sought to see if the technology used was a source of the
differential functioning. In this study, the participants in the unproctored group had a
lower usability score, however the difference was not significant at the .05 level (but
would have been at the p < .1 level). This reported lower average usability score is
another possible reason for the differential functioning between the proctored and
unproctored test participants. These results corresponded to the results of Bridgemen,
Lennon, and Jackenthal (2003). These results agreed with their findings that screen
settings and resolution matter; however, the results go beyond their findings since the
current study seems to indicate that usability can affect non-reading comprehension items
The most likely source of the differential functioning, and the answer to research
question 5 of this study, was the environment in which the test was completed. Although
the proctored environment was not always ideal, the unproctored environment suffered a
much larger departure from ideal conditions. This finding was consistent with the
research conducted by Sinar and Reynolds (2004). However, what still remains unclear
is what in the unproctored environment might have caused the DIF. Additionally, these
results do not directly support the results of Boggs and Simon (1968) since it appeared
that performance did not suffer.
Unfortunately, the effects of computer or Internet self-efficacy cannot be ruled out
as the source of the differential functioning. However, it was believed that since these
specific self-efficacies are attributes of the person, any impact that they might have had
was controlled by the random assignment to the different conditions. Since random
assignment to the groups was used, it was assumed that varying levels of these
self-efficacies were equivalent for the two groups.
A final untested possible explanation to the differential functioning is that
participants in the unproctored group were subjected to a certain effects of group testing.
It has long been known that tests that are administered in a group setting have certain
disadvantages or risks over tests individually administered. One disadvantage is that a
person’s actual score will be different from their true score because of motivational
problems or difficulty following the directions. Additionally, these scores will not be
recognized as invalid (Gregory, 2000). It is likely that unproctored tests, even if
administered individually, share these problems with group-administered tests. It is very
because they were not aware of the instructions. Even though it is likely that such was
the case, it is unfortunately impossible to determine how extensive this problem was or
what affect it had on participant’s scores.
Overall Conclusions
In the present research, provocative results were found. The most important
findings related to the equivalence of proctored and unproctored web-based cognitive
ability tests and the equivalence of web-based tests and paper-and-pencil tests. These
results directly contradicted some of the research that has been conducted in this area
(Sinar and Reynolds, 2004; Oswald, Carr, & Schmidt, 2001); however, the findings
supported other research that has been conducted (Potosky and Bobko, 2004; Bridgemen,
Lennon, and Jackenthal, 2003). Several possible explanations exist as to why these
differences were found. It could imply that measurement equivalence between modes of
administrations could rest on the test specific test or the specific abilities that are being
measured. However, it is also possible that the type of statistical analysis made a
difference.
In general, the results showed that measurement equivalence was less than
perfect. The amount of measurement variance that was detected was small and limited to
only a few items. The fact that in all of the DFIT analyses that were conducted as part of
this study, no instance of DTF was discovered demonstrates that timed cognitive ability
measures still measure cognitive ability regardless of the mode of administration.
Therefore, the construct validity of web-based cognitive ability tests in general, and the
However, even though the presence of DIF was limited, there was enough DIF to
change the relationships between predictors and criterions. This result was most apparent
in a significantly different Fisher’s z test between the WPT-Q scores and the combined
SAT scores. The practical implications of this finding are most apparent for an
organization that wishes to change the mode of the their selection tests, such as from
paper-and-pencil to web-based proctored test or web-based proctored to web-based
unproctored. These organizations will need to conduct new criterion-related validity
studies because the criterion-related validity of the measures cannot be assumed to
remain the same when mode of test administration is changed.
Although unrelated to the question of equivalence of the administration modes,
this research produced provocative results in another area, i.e., the factor structure of the
WPT and WPT-Q. Both of these tests are supposed to measure g (Wonderlic, 2005;
Wonderlic, 2006). If these tests did measure g, then the factors should have been highly
correlated. However, in this study, the factors were moderately correlated at best and
uncorrelated at worst. Therefore, the results of this study suggest that the WPT and
WPT-Q should be better thought of as tests that measure several specific abilities and not
necessarily as a test that measures g.
Limitations
The major limitation of this study was the small sample size used in the analysis
of the WPT-Q data. In future research, larger sample sizes should be used, not only for
the analysis of proctored versus unproctored tests, but also with the analysis of
paper-and-pencil versus web-based tests. An additional limitation of the present research was
such measures might give more insight into the possible causes of the differential
functioning in research comparing the equivalence of web-based tests.
Another potential limitation in this research was the use of data from low-stakes
testing situations. The participants in this research did not have any external motivation,
such as getting a job, to perform at their best. Therefore, the results found in this study
might not replicate results from a high stakes testing situation.
Directions for Future Research
Research on these same questions needs to be continued. One issue that does not
seem to be resolved yet is whether the results of research investigating web-based test
equivalence are limited to specific tests, or can these results be generalized to the method
of administration of any test? Until more research is conducted, this question cannot be
answered.
Also, research incorporating both usability measures and self-efficacy measures
should become standard procedures when conducting this type of research. Very little
seems to be known about how either of these constructs is related to web-based tests.
The current research made significant contributions since not only was a method for
measuring usability in timed web-based tests used successfully, but also a new measure
of usability for web-based tests was introduced.
Research should also be conducted on how different response options, e.g.,
checkboxes, textboxes, and radio buttons, affect the outcome of web-based tests. It is
possible that usability and self-efficacy measures could assist in understanding what
In conclusion, provocative results were found during this research. Some of these
results supported past research, and some of them did not. In all, results suggested that
mode of administration matters. Only additional research will help to settle the question
of the equivalence of web-based cognitive ability testing. Future research should
continue to focus not only on what affects the equivalence of web-based tests, but also on
why researchers have found conflicting results.
References
Baker, F. B. (1995). Equate 2.1: Computer program for equating two metrics in item
response theory [Computer Program]. Madison: University of Wisconsin,
Laboratory of Experimental Design.
Beaty, J. C., Fallon, J. D., & Barrett, C., 2002. Proctored versus unproctored web-based
administration of a cognitive ability test. Paper presented at the 17th Annual
Conference for the Society for Industrial and Organizational Psychology (SIOP),
Toronto, Ontario.
Boggs, D. H. & Simon, J. R. (1968). Differential effect of noise on tasks of varying
complexity. Journal of Applied Psychology, 52, 148 – 153.
Bridgeman, B., Lennon, M.L., & Jackenthal, A. (2003). Effects of screen size, screen
resolution, and display rate on computer-based test performance. Applied
Measurement in Education, 16(3), 191-205.
Buchanan, T. (2000). Potential of the Internet for personality research. In M. H.
Birnbaum (Ed.) Psychological experiments on the Internet (121 – 140). San
Diego, CA: Academic Press.
Buchanan, T., & Smith, J. (1999). Using the Internet for psychological research:
Personality testing on the World Wide Web. British Journal of Psychology, 90,
125 - 144.
Cascio, W. F. (1998). Applied psychology in human resource management (5th ed.).
Upper Saddle River, NJ: Prentice Hall.
Compeau, D.R. & Higgins, C.A. (1995). Computer self-efficacy: development of a
Dembowski, J.M & Callans, M.C. (2000). Comparing computer and paper forms of the
Wonderlic Personnel Test. Paper presented at the Society for Industrial and
Organizational Psychology, New Orleans, LA.
Epstein, J., Klinkenberg, W.D., Wiley, D., and McKinley, L. (2001). Insuring sample
equivalence across Internet and paper-and-pencil assessments. Computers in
Human Behavior, 17, 339-346.
Feingold, A. (1996). Cognitive gender differences: where are they and why are they
there? Learning and Individual Differences, 8(1), 25 – 32.
Gregory, R. J. (2000). Psychological testing (3rd ed.). Needham Heights, MA: Allyn and
Bacon.
Lewis, J. R. (1995). IBM Computer Usability Satisfaction Questionnaires: Psychometric
Evaluation and Instructions for Use. International Journal of Human-Computer
Interaction, 7(1), 57 – 78.
Lievens, F. & Harris, M. M. (2003). Research on Internet recruiting and testing: current
status and future directions. In C. L. Cooper and I. T. Robertson (Eds.),
International Review of Industrial and Organizational Psychology (131 - 165).
Chichester, UK: Wiley.
Ludlow, L.H. & O’Leary, M. (1999). Scoring omitted and not-reached items: practice
data analysis implications. Educational and Psychological Measurement, 59(4),
615-630.
Lundby, K & Mack, M. (2003). Usability research: An introduction, general overview,
and practical applications for I/O psychology. Paper presented at Society for
McBride, J. R. (1998). Innovations in computer-based ability testing: promise problems
and perils. In M.D. Hakel (Ed.) Beyond multiple choice: Evaluating alternatives
to traditional testing for selection (23 – 40). Mahwah, NJ: Lawrence Erlbaum
Associates, Inc.
Mead, A.D. & Drasgrow, F. (1993). Equivalence of computerized and paper-and-pencil
cognitive ability tests: A meta-analysis. Psychological Bulletin, 114(3), 449-458
Muthen, L. & Muthen, B. (2004). Mplus 3.13 [Computer Program]. Los Angeles,
Muthen & Muthen.
Naglieri, J.A., Drasgrow, F., Schmit, M., Handler, L., Prifitera, A., Margolis, A., &
Velasquez, R. (2004). Psychological testing on the Internet, new problems, old
issues. American Psychologist, 59(3), 150-162.
Nielsen, J (2003). Usability 101: Introduction to usability. Retrieved August 1, 2004
from http://www.useit.com/alertbox/20030825.html.
Oswald, F. L. Carr, J.Z., & Schmidt, A.M. (2001). The medium and the message: Dual
effects of supervision and web-based testing on measurement equivalence for
ability and personality measures. Paper presented at the Society for Industrial and
Organizational Psychology, San Diego, CA.
Polyhart, R.E., Weekly, J.A., Holtz, B.C., & Kemp, C. (2003). Web-based and
paper-and-pencil testing of applicants in a proctored setting: are personality, biodata,
and situational judgment tests comparable? Personnel Psychology, 56, 733-752.
Potosky, D. & Bobko, P. (2004). Selection testing via the Internet: practical
considerations and exploratory empirical findings. Personnel Psychology, 57,