78:7 (2016) 75–81 | www.jurnalteknologi.utm.my | eISSN 2180–3722 |
Jurnal
Teknologi
Full PaperI
SOLATION
AND
C
HARACTERIZATION
OF
P
OLYHYDROXYALKANOATES
(PHA
S
)
P
RODUCING
B
ACTERIA FROM
B
RACKISH
S
TREAM
Nor Azimah Mohd Zain
a*, Laila Muftah Ali Zargoun
a, Nur Fatihah
Elias
a, Mohd Firdaus Abd Wahab
a, Mohd Suardi Suhaimi
ba
Department of Biosciences and Health Sciences, Faculty of
Biosciences and Medical Engineering, Universiti Teknologi Malaysia,
81310 UTM Johor Bahru, Johor, Malaysia
b
Department of Chemical Engineering, Faculty of Chemical
Engineering, Universiti Teknologi Malaysia, 81310 UTM Johor Bahru,
Johor, Malaysia
Article history
Received
11 May 2015
Received in revised form
20 January 2016
Accepted
15 June 2016
*Corresponding author
[email protected]
Graphical abstract Abstract
Polyhydroxyalkanoates (PHAs) are biopolymers which have similar characteristics with petrochemical plastics but a step better due to its biodegradable property. A total of 23 strains were isolated from two different brackish sources. In order to detect the PHAs granules, the PHAs producing bacteria were first screened with Sudan Black B staining. Twenty strains were observed with lipid granules and were subjected to further confirmation with Nile blue staining. From the Nile blue staining, only 10 strains have the ability in producing PHAs and 2 were identified as strong PHAs producers. This study focuses on the 2 strains named S1 and L1. Further identification procedure was carried out and found that strain S1 and L1 belongs to Pseudomonas sp. L1 strain was found to be promising for PHAs production since it accumulated PHAs for about 88.3%. The PHAs produced by this strain was analyzed using Fourier Transform Infrared Spectroscopy (FT-IR) and Nuclear Magnetic Resonance (NMR) analysis and was identified as poly-3-hydroxybutyrate (P-3HB).
Keywords: Polyhydroxyalkanoates, PHAs, Biopolymer, FTIR, NMR, P-3HB
Abstrak
Polialkanoat (PHAs) adalah sejenis biopolimer yang lebih baik berbanding plastik petrokimia kerana sifat biodegradasinya. Sebanyak 23 jenis bakteria telah diasingkan dari 2 punca air payau. Bakteria penghasil PHAs telah dipilih menggunakan pewarnaan Sudan Black B. 20 strain dikesan mempunyai granul lipid dan kemudiannya disahkan menggunakan pewarnaan Nile blue. Dari pewarnaan ini, hanya 10 strain mempunyai kebolehan menghasilkan PHAs dan 2 daripadanya dikenalpasti sebagai penghasil PHAs efektif. Fokus kajian ini adalah terhadap 2 strain yang diperolehi ini yang dinamakan S1 dan L1. Prosedur pengecaman seterusnya yang dijalankan medapati strain S1 dan L1 termasuk di dalam strain spesis Pseudomonas. Strain L1 adalah yang terbaik kerana mengumpulkan PHAs sehingga 88.3%. PHAs yang dihasilkan dianalisa menggunakan Spektroskopi Inframerah Transformasi Fourier (FT-IR) dan Spektroskopi Resonans Magnet Nukleus (NMR) dan dikenalpasti sebagai poli-3-hidroksibutirat (P-3HB).
Kata kunci: Polihidroksialkanoat, PHAs, Biopolimer, FTIR, NMR, P-3HB
1.0 INTRODUCTION
Increasing concern about environmental problems caused by plastic wastes lead scientist to find alternatives to replace plastics that made from non-renewable resources [1]. The usage of petrochemical plastics only turns this condition to become more serious due to its non-degradable properties. Besides that, the slow rate of conventional degradation and toxins released during the process has encouraged scientist to find its replacement. Production of bioplastics has been carried out but it is high in production cost and the availability of petrochemical make bioplastics economically unattractive [2].
Polyhydroxyalkanoates (PHAs) are a type of bioplastic. PHAs consist of 3-hydroxy fatty acid monomers that form linear, head-to-tail polyesters [3]. It is synthesized by bacteria and can be classified into short-chain-length PHA (3–5 carbon atoms, PHA SCL), medium-chain-length (6–15 carbon atoms, PHA MCL) and long-chain-length (more than 15 carbon atoms, PHA LCL) [4]. SSC PHAs normally have four to five carbon atoms and for LSC, it is first discovered in mixed cultures in activated sludge [4]. PHAs usually synthesized by bacteria when they are having some nutritional limitation. Furthermore, different types of bacteria will produce PHAs with different type of monomer composition, structure, and size and physiochemical properties.
Since bacteria can easily grow on media depending on their availability, it can be said that PHAs are the best candidates for replacing the petrochemical plastics [5]. Several microbes were identified to produce PHAs effectively. Some of it utilized inexpensive resources such as palm oil and triglyceride [5]. Researchers are investigating the possible inexpensive raw materials that can be used in PHAs production. Wide ranges of renewable carbon sources have been tested for examples like starches, alcohols, and industrial by-products.
Several studies regarding the isolation of PHAs producing bacteria from extreme environment has been done [6]. According to [6], some bacteria isolated from extreme environment might replace well-established, industrially implemented microorganisms in the near future aiming to a more productive and efficient polymer production process.
In this study, PHAs producing bacteria was isolated from two different hyper saline sources. The isolated bacteria were screened using Sudan Black B and further confirmed with Nile blue staining. Bacteria that able to produce PHAs were characterized using gram staining, biochemical test and 16S rRNA analysis. The accumulated PHAs were then identified using Fourier Transform Infrared Spectroscopy (FT-IR) and Nuclear Magnetic Resonance (NMR) analysis.
2.0 MATERIALS AND METHOD
2.1 Isolation of Bacteria
The isolation of PHAs producing bacteria from brackish stream of was done in two difference places. The samples were taken from Kampung Nelayan Kongkong and Taman Negara Tanjung Piai, Johor, Malaysia. Samples collected were enriched on two rich liquid culture media, which were Luria–Bertani [2] and Halophilic Medium (HM) [6]. Finally, the plates were incubated for 24 hours at 37 °C.
2.2 Identification of PHAs Producing Bacteria
2.2.1 Sudan Black B Staining
Cell smear was deposited on glass slide and heat fixed. The glass slide was immersed in 2% acetic acid for 5 minutes. Then, it was stained with 3% (w/v in 70% ethanol) of Sudan black B solution (Sigma) for 20 minutes [7]. The slide was immersed in xylene until it completely decolorized. The sample was counterstained with Safranin (Sigma; 5% w/v in deionized water) for 10 seconds, washed with water and dried.
2.2.2 Nile Blue Staining
The colonies on Luria Bertani agar plate were stained with 3ml of Nile blue solution and shaken gently at room temperature. After 20 minutes, the solution was removed from the agar plate and the plate was stood to dry the surface [8].
2.3 Bacterial Identification
2.3.1 Gram Staining
A single colony of bacteria was inoculated using sterile inoculating loop from the pure culture and mixed with drop distilled water on the microscope slide. The smear was stained with crystal violet for 1 minute and rinsed with distilled water. After that, iodine was added. Then alcohol which acts as decolourizer was added. The smear was counterstain with safranin for 1 minute and rinsed with distilled water. After that, slide was blotted with bibulous paper and observed under light microscope [9].
2.3.2 Biochemical Test
2.3.3 16S rRNA
DNA Extraction
In obtaining the pellet cell, 1ml of overnight culture was centrifuged for 2 minutes at 13,000-16,000x g. The supernatant was discarded. The cells were suspended in 480µl of 50mM EDTA. Then 120µl of lytic enzyme was added. The sample was incubated at 37 oC for 30-60
minutes. After that, it was centrifuged for 2 minutes at 13,000-16,000 x g and removed the supernatant. In cell lysis, 600µl of Nuclei lysis solution was added. The solution was gently pipetted to mix. Then, it was incubated for 5 minutes at 80 oC and cooled at room
temperature. The next step involved the addition of 3µl of RNase solution, mixed and incubated at 37 oC for
15-60 minutes (cooled at room temperature). After that, 200µl of protein precipitation solution was added to precipitate the protein (vortexed). The mixture was then incubated on ice for 5 minutes and centrifuged at 13,000-16,000 x g for 3 minutes. The supernatant was transferred to a clean tube containing 600µl of room temperature isopropanol and mixed. It was then centrifuged for 2 minutes at 13,000-16,000 x g. Then, 600µl of room temperature 70% ethanol was added and mixed. The mixture was centrifuged for 2 minutes at 13,000-16,000 x g. The ethanol was aspirated and the pellet was air-dried for 10-15 minutes. Finally, the DNA pellet was rehydrated in 100µl of rehydration solution for 1 hour at 65 oC (or overnight at 4oC). The
extracted DNA was run in gel electrophoresis (extraction was done using Promega kit A1120) [11].
Agarose Gel Electrophoresis
For agarose gel preparation, 0.5ml of agarose powder was dissolved in 50ml 1xTris Acetate EDTA (TAE) buffer. It is then heated in oven for 1 minute. 1µl of Ethidium bromide (EtBr) was added into agarose gel and mixed well. The mixture was poured into the tray and the comb was placed. After the gel was solidified, the sample was prepared. The gel was immersed in the 1xTAE buffer solution. Then 4µl of ladder was loaded in the first well followed by 5µl of DNA sample which was mixed with 2µl of loading dye and loaded in the next well [11, 12]. The electrophoresis process was carried out at 80V for 50 minutes. The image was viewed under UV transilluminator.
Polymerase Chain Reaction (PCR)
The 16S rRNA gene was amplified with PCR using the 27F primer and 1525R primer .These are complementary to the 5’-end and 3’-end of prokaryotic 16S rRNA genes. Amplifications was performed by 30 cycles as follows; after initial denaturation for 3 minutes at 95oC, cooling denaturation for 1 minute at 95oC, primer annealing for 1 minute at 55oC, and primer extension for 2 minutes at 72oC, with a final extension for 5 minutes at
72oC [13]. Sequencing of the PCR product was send to
First base and nucleotide sequences was analyzed using BLAST program within the NCBI database [13].
2.4 Confirmation of PHAs Production
2.4.1 PHAs Production
Minimal salt medium was prepared [5.8g/L K2HPO4,
3.7g/L KH2PO4, 1g/L (NH4)2SO4, 0.2g/L MgSO4.7H2O,
date molasses, and trace element solution]. Date molasses was used to replace glucose as a carbon source for the bacteria to produce PHA. The strains were grown in 250 Erlenmeyer flask containing 100ml minimal salt medium [14]. Samples were collected after 4 days of experiment. Experiment was done in triplicate
2.4.2 PHAs Extraction
The fermented culture was transferred into 50ml falcon tube and centrifuged for 15 minutes at 10,000 rpm to wash the pellet. This step was done in 3 times washed with distilled water. Then, the pellet was mixed with EDTA and distilled water and kept in refrigerator for 1 day. After that, the sample was centrifuged for 10 minutes at 10,000 rpm. The sample was poured in glass plate and dried in oven (70 oC). The dried sample was
dissolved in chloroform and evaporated at room temperature. The product was further analyzed using FT-IR and NMR analysis [14]. The PHAs accumulation was calculated using the formula below.
PHA accumulation (mg/L) = Dry weight of extracted PHA (mg/L) X100 Dry cell weight (mg/L)
2.5 PHAs Characterization
2.5.1 Fourier Transform Infrared Spectroscopy (FT-IR) Analysis
In this analysis, the PHAs produced (solid sample) was directly analyzed. A Nicolet iS5 FTIR spectrometer was used with spectral range, 4000-400 cm-1 [14].
2.5.2 Nuclear Magnetic Resonance (NMR) Analysis
The extracted PHA was dissolved in 10mg/ml of deuterochloroform (CDCl3). Then, it was analyzed on a
Bruker topspin 2.1 spectrometer [14].
3.0 RESULTS AND DISCUSSION
3.1 Isolation and Identification of PHAs Producing Bacteria
indicates the present of intracellular lipid granules. Basically, Sudan Black B is slightly basic dye and will interact with acidic group in lipid compound thus stained the lipid granules [8].
Sudan Black B showed a low selectivity for PHAs granules [8]. The bacterial strains were further tested using Nile blue staining to confirm the PHAs granules since Nile blue will specifically stain PHAs granules with the blue colors [8]. It is a basic oxazine dye which
formed oxazone by spontaneous oxidation in aqueous solution and thereby stained the colony [15]. Only 10 strains were able to produce PHAs. A total of 2 strains labeled as strain S1 and L1 were identified as strong PHAs producers. Figure 1 explains the results from Sudan Black B staining and Figure 2 shows the positive Nile blue staining.
Figure 1 Sudan Black B staining for L1 and S1 strains
Positive Positive Negative
Figure 2 Nile blue staining for L1 and S1 strains
3.2 Bacterial Identification
3.2.1 Gram Staining and Biochemical Tests
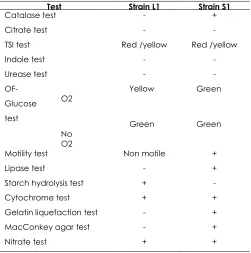
Both strains from the Nile blue staining were first identified using gram staining and followed by biochemical test. Based on the gram staining results, both isolated bacteria were identified as gram negative bacteria. The classification was based on the morphology of cellulolytic bacteria [9]. For gram positive bacteria, it will remained the blue-purple color after decolorization with alcohol but gram negative bacteria become transparent and retained in orange-red color after counter stain with Safranin [9]. All bacterial strains were examined using light microscope under 40 x lenses. Both L1 and S1 are rod in shape. The colony and morphological characteristics of the selected strains were also studied. Besides that, biochemical teats were done to both strains. Table 1 summarizes the results for biochemical tests for the both strains.
Table 1 Biochemical test
Test Strain L1 Strain S1
Catalase test - +
Citrate test - -
TSI test Red /yellow Red /yellow
Indole test - -
Urease test - -
OF-Glucose test
O2 Yellow Green
No O2
Green Green
Motility test Non motile +
Lipase test - +
Starch hydrolysis test + -
Cytochrome test + +
Gelatin liquefaction test - +
MacConkey agar test - +
Nitrate test + +
Positive Positive Negative
3.2.2 16S rRNA
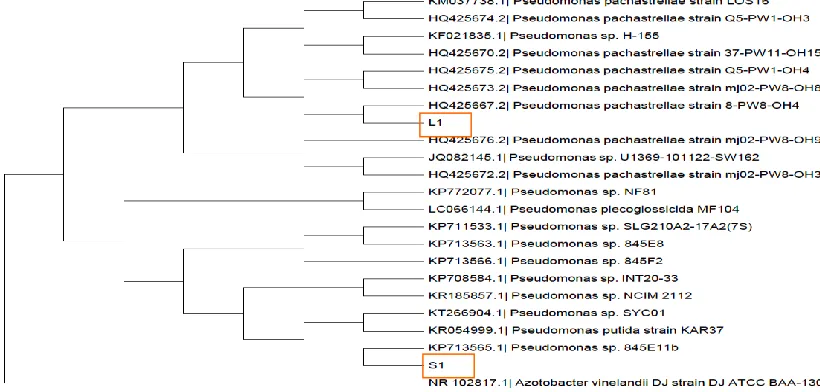
All of the strains were further identified using 16S rRNA analysis. Comparison of 16SrRNA gene sequences of the strains with those available from nucleotide BLAST
program within the NCBI database shown that strain L1 and S1 were both related to Pseudomonas sp. Figure 3 shows the phylogenetic tree drawn by the neighbor joining method using MEGA 6 software.
Figure 3 Evolutionary relationships of L1 and S1
The evolutionary history was inferred using the Neighbor-Joining method [15]. The bootstrap consensus tree inferred from 1000 replicates [16] is taken to represent the evolutionary history of the taxa analyzed [16]. Branches corresponding to partitions reproduced in less than 50% bootstrap replicates are collapsed. The evolutionary distances were computed using the p-distance method [17] and are in the units of the number of base differences per site. The analysis involved 23 nucleotide sequences. Codon positions included were 1st+2nd+3rd+Noncoding. All positions containing gaps and missing data were eliminated. There were a total of 285 positions in the final dataset. Evolutionary analyses were conducted in MEGA6 [18]. Azotobacter vinelandii was used as out group.
3.3 Confirmation of PHAs Production
Both strains were further subjected to PHAs production confirmation. Only the Pseudomonas sp. (L1) was found to form PHAs. The PHAs accumulation for Pseudomonas sp. (L1) is 88.3%. The results can be viewed in Table 2. The accumulation of PHAs from strain L1 was comparable with PHAs obtained from Halomonas hydrothermalis reported by Shrivastav et al which accumulated PHAs 75% of DCW [19]. Strain S1 unable to produce the PHAs because of the condition used is not preferable for the growth.
Table 3 PHAs production
Strain Cell dry weight (CDW) (mg)
PHAs (mg)
PHAs accumulation
(%)
Pseudomonas sp. (L1)
157.4mg 139mg 88.3%
3.4 PHAs Characterization
3.4.1 FT-IR Analysis
FT-IR analysis was done on the polymer produced by L1 strain. This analysis helps in identification of functional groups from the samples. The IR spectroscopic analysis gave further insights into the polymer’s chemical structures [20]. Purified polymer from strain Pseudomonas sp. (L1) showed strongest band at 1720 cm-1 which indicates ester C=O valence
Figure 4 FT-IR spectra of PHAs extracted from Pseudomonas sp. (L1)
Another characteristic of band for PHB was visible near 1282 cm-1 [21]. Pseudomonas sp. L1 had a visible
band at 1276 cm-1, which indicates C-O stretching
groups. Another peaks formed in the region of 2922 cm-1. This peaks is nearly the same with standard PHB
which confirming the presence of PHB in the sample [20].
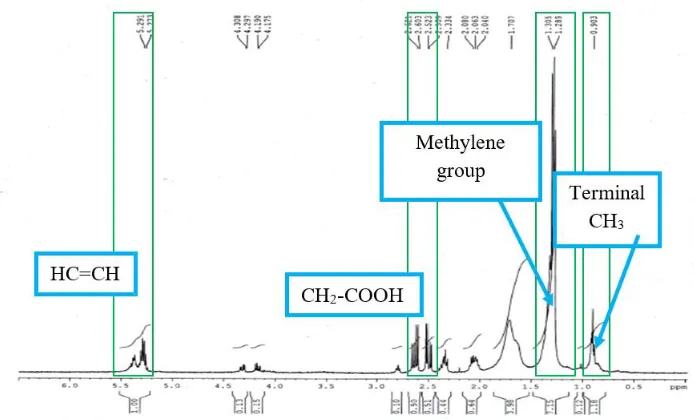
3.4.2 NMR Analysis
For further confirmation on type of PHAs produced, the polymer produced was also subjected to NMR analysis. The analysis of the spectra produced by the
Pseudomonas sp. (L1) shows the following signals: -CH=CH at 5.30 ppm, -CH2-COOH at 2.50 ppm, methylene groups ranging from 1.25 to 1.57 ppm, and a terminal –CH3 at 0.9ppm [14]. The spectra was similar to the PHB standard spectra. Figure 5 shows the spectra produced by Pseudomonas sp. (L1). The expected type of PHB produced from Pseudomonas sp. (L1) is Poly-3-hydroxybutyrate (P-3HB) [22]. The expected structure from the analysis is shown in Figure 7. The spectra formed are more or less similar to the result obtained by [22]. This P-3HB can be classified as short chain length PHAs since it has 3 carbons.
Figure 6 Structure of P-3HB
4.0 CONCLUSION
PHAs producing bacteria was successfully isolated from hyper saline water stream. The bacteria was then characterized using biochemical test and 16srRNA. Comparison of 16S rRNA gene sequences of the strain with those available from nucleotide Blast program within the NCBI database shows that strain L1 was related to Pseudomonas sp. The PHAs produced was then characterized using FT-IR and NMR spectroscopy, and was identified as P-3HB, a short chain length PHAs.
References
[1] Kamilah, H., Tsuge, T., Yang, T.A., and Sudesh, K. 2013.
Waste Cooking Oil As Substrate For Biosynthesis Of Poly (3-hydroxybutyrate) and Poly (3-hydroxybutyrate-co-3-hydroxyhexanoate): Turning Waste Into A Value Added
Product. Malaysian. Journal of Microbiology. 9: 51-59.
[2] Verlinden, R. A., Hill, D. J., Kenward, M. A., Williams, C. D.,
Piotrowska-Seget, Z., and Radecka, I. K. 2011. Production of Polyhydroxyalkanoates From Waste Frying Oil By
Cupriavidusnecator. AMB Express. 1: 11.
[3] Chaudhry, W. N., Jamil, N., Ali, I., Ayaz, M. H., and Hasnain,
S. 2011. Screening For Polyhydroxyalkanoate (PHA)-Producing Bacterial Strains And Comparison Of PHA Production From Various Inexpensive Carbon Sources.
Annals of Microbiology. 61(3): 623-629.
[4] Ramsay, B. A., Saracovan, I., Ramsay, J. A., and
Marchessault, R. H. 1994. A Method for the Isolation of Microorganisms Producing Extracellular Long-Side-Chain
Poly (B-hydroxyalkanoate) Depolymerase. Journal of
Environmental Polymer Degradation. 2(1): 1-7.
[5] Hwan, S. J., Jeon, C. O., Choi, M. H., Yoon, S. C., and Park,
W. 2008. Polyhydroxyalkanoate (PHA) Production Using
Waste Vegetable Oil By Pseudomonas sp. Strain DR2.
Journal of Microbiology Biotechnology. 18: 1408-1415.
[6] Rodriguez-Contreras, A., Koller, M., Dias, M.M.d.S., Calafell,
M., Braunegg, G., and Marqués-Calvo, M. S. 2011. Novel Poly [(R)-3-Hydroxybutyrate]-Producing Bacterium Isolated
from a Bolivian Hypersaline Lake. Food Technology and
Biotechnology. 51(1): 123-130.
[7] Legat, A., Gruber, C., Zangger, K., Wanner, G., and
Stan-Lotter, H. 2010. Identification of Polyhydroxyalkanoates in
Halococcus and other Haloarchaeal species. Applied Microbiology and Biotechnology. 87(3): 1119-1127.
[8] Kitamura, S. and Doi, Y. 1994. Staining Method Of Poly
(3-Hydroxyalkanoic Acids) Producing Bacteria By Nile Blue.
Biotechnology Techniques. 8(5): 345-350.
[9] Pommerville, J. C. 2010. Alcamo's Fundamental of
Microbiology. (8th), Jones and Bartlett Publishers International, London.
[10] Garrity, G. M., Bell, J. A., and Lilburn, T. G. 2004. Taxonomic
Outline of the Prokaryotes Bergey's Manual of Syatematic Bacteriology, New York.
[11] Thieman, W. J., and Palladino, M. A. 2009. Introduction to
Biotechnology. 2nd. Pearson/Benjamin Cummings, San
Francisco.
[12] Minden, J. S., Dowd, S. R., Meyer, H. E., and Stuhler, K.
2009. Difference Gel Electrophoresis. Electrophoresis. 1:
156-161.
[13] Song, J. H., Jeon, C. O., Choi, M. H., Yoon, S. C., Park, W.
2008. Polyhydroxyalkanoate (PHA) Production Using Waste
Vegetable Oil By Pseudomonas sp. Strain DR2. Journal of
Microbiology and Biotechnology. 18(8): 1408-1415.
[14] Shrivastava, A., Mishraa, S. K., Shethiab, B., Panchab, I.,
Jaina, D., and Mishra, S. 2010. Isolation Of Promising Bacterial Strains From Soil And Marine Environment For
Polyhydroxyalkanoates (Phas) Production Utilizing
Jatropha Biodiesel Byproduct. International Journal of Biological Macromolecules. 47(2): 283-287.
[15] Saitou, N. and Nei, M. 1987. The Neighbor-Joining Method:
A New Method For Reconstructing Phylogenetic Trees.
Molecular Biology and Evolution. 4: 406-425.
[16] Felsenstein, J. 1985. Confidence Limits On Phylogenies: An
Approach Using The Bootstrap. Evolution. 39: 783-791.
[17] Nei, M. and Kumar, S. 2000. Molecular Evolution and
Phylogenetics. Oxford University Press, New York.
[18] Tamura, K., Stecher, G., Peterson, D., Filipski, A., and
Kumar, S. 2013. MEGA6: Molecular Evolutionary Genetics
Analysis version 6.0. Molecular Biology and Evolution. 30:
2725-2729.
[19] Shrivastav, A., Mishra, S.K., Shethia, B., Pancha, I., Jain, D.,
Bhattacharya, S., Patel, S., Mishra, S. 2010.
Biodegradability Studies Of Polyhydroxyalkanoate (PHA) Film Produced By A Marine Bacteria Using Jatropha
Biodiesel Byproduct As A Substrate. World J Microbiol
Biotechnol. 27: 1531-1541.
[20] Spiekermann, P., Rehn, B. H. A., Kalscheuer, R., Baumeister,
D. and Steinbuchel, A. 1999. A Sensitive, Viable-Colony Staining Method Using Nile Red For Direct Screening Of Bacteria That Accumulate Polyhydroxyalkanoic Acids And
Other Lipid Storage Compounds. Archives Microbiology.
171(2): 73-80.
[21] Shah, K. 2012. FTIR Analysis of Polyhydroxyalkanoates by
Novel Bacillus sp. AS 3-2 From Soil Of Kadi Region, North
Gujarat, India. Journal of Biochemical Technology. 3(4):
380-383.
[22] Hong, K., Sun, S., Tian, W., Chen, G.Q., Huang, W. 1999. A
Rapid Method For Detecting Bacterial
Polyhydroxyalkanoates In Intact Cells By Fourier Transform
Infrared Spectroscopy. Applied Microbiology and
Biotechnology. 51: 523-526.
[23] Shamala, T. R., Chandrashekar, A., Vijayendra, S. V. N. and
Kshama, L. 2003. Identification of Olyhydroxyalkanoate
(PHA)-producing Bacillus sp. using the Polimerase Chain
Reaction (PCR). Journal of Applied Microbiology. 94(3):