UTM/RMC/F/0024 (1998)
BORANG PENGESAHAN LAPORAN AKHIR PENYELIDIKAN
TAJUK PROJEK :
Saya _______________________________________________________________________
(HURUF BESAR)
Mengaku membenarkan Laporan Akhir Penyelidikan ini disimpan di Perpustakaan Universiti Teknologi Malaysia dengan syarat-syarat kegunaan seperti berikut :
1. Laporan Akhir Penyelidikan ini adalah hakmilik Universiti Teknologi Malaysia.
2. Perpustakaan Universiti Teknologi Malaysia dibenarkan membuat salinan untuk tujuan rujukan sahaja.
3. Perpustakaan dibenarkan membuat penjualan salinan Laporan Akhir Penyelidikan ini bagi kategori TIDAK TERHAD.
4. * Sila tandakan ( / )
SULIT (Mengandungi maklumat yang berdarjah keselamatan atau Kepentingan Malaysia seperti yang termaktub di dalam
AKTA RAHSIA RASMI 1972).
TERHAD (Mengandungi maklumat TERHAD yang telah ditentukan oleh Organisasi/badan di mana penyelidikan dijalankan).
TIDAK
TERHAD
TANDATANGAN KETUA PENYELIDIK
Nama & Cop Ketua Penyelidik
Tarikh:
CATATAN : * Jika Laporan Akhir Penyelidikan ini SULIT atau TERHAD, sila lampirkan surat daripada pihak
berkuasa/organisasi berkenaan dengan menyatakan sekali sebab dan tempoh laporan ini perlu dikelaskan sebagai SULIT dan TERHAD.
MOHD FOR MOHD AMIN
CLASSIFICATION OF FILLED JOINT BASED ON THE
CHARACTERISTICS OF ITS CONSTITUTIVE COMPONENTS
/
CLASSIFICATION OF FILLED JOINT BASED ON THE
CHARACTERISTICS OF ITS CONSTITUTIVE COMPONENTS
(PENGKELASAN KEKAR BERINTI BERDASARKAN KEPADA
SIFAT-SIFAT KOMPONEN UTAMANYA)
MOHD FOR MOHD AMIN
EDY TONIZAM MOHAMMAD ASSOC. PROF. IR AZMAN BIN KASSIM
ONG HENG YAU
PUSAT PENGURUSAN PENYELIDIKAN UNIVERSITI TEKNOLOGI MALAYSIA
CLASSIFICATION OF FILLED JOINT BASED ON THE
CHARACTERISTICS OF ITS CONSTITUTIVE COMPONENTS
(PENGKELASAN KEKAR BERINTI BERDASARKAN KEPADA
SIFAT-SIFAT KOMPONEN UTAMANYA)
MOHD FOR MOHD AMIN
EDY TONIZAM MOHAMMAD ASSOC. PROF. IR AZMAN BIN KASSIM
ONG HENG YAU
RESEARCH VOTE NO:
71825
Jabatan Geoteknik & Pengangkutan
Fakulti Kejuruteraan Awam
Universiti Teknologi Malaysia
CLASSIFICATION OF FILLED JOINT BASED ON THE CHARACTERISTICS OF ITS CONSTITUTIVE COMPONENTS
(Keywords: Filled joint, behaviour, components, field and laboratory assessments)
Filled joints in rock mass pose a number of constructional problems. When filled joints are reckoned to be critical to an engineering structure, their behaviours are often studied using expensive in-situ testing and complex full-scale physical
modelling. This is because sampling of an undisturbed filled joint is almost impossible to undertake. As such, a means of anticipating the behaviour and characteristics of this critical geological discontinuity is important. One method to predict the behaviour of filled joint is through systematic classification based on its essential components, particularly those features that control the behaviour of the joint under shear and compressive load.
Exposed filled joints in granite rock in Lahat, Perak, have been selected for the field study. The field assessments indicate there are several components of filled joint that exhibit certain geological and mechanical characteristics which can be identified and assessed in the field and laboratory. For the infilling material, the essential
features include thickness, weathering grade and texture. For the host joint blocks, the features include texture and roughness of the joint surface and weathering degree of the blocks. The weathering grade of the infill and joint blocks are geological
characteristics that can be graded according to the standard classification system. The samples of infilling were further evaluated in the laboratory using index and
characterisation tests like sieving, compression and shear tests.
This study has shown that there are several essential components of filled joint that can be used to predict its behaviour. These components can be easily
characterised and evaluated in the field and laboratory. The characteristics of the infilling material and roughness of joint surface are among the features that control the behaviour of filled joint, and subsequently can be used as classification index for predicting the joint behaviour.
Key researchers:
Mr. Mohd For bin Mohd Amin Mr. Edy Tonizam bin Mohammad Assoc. Prof. Ir Azman bin Kassim
Ong Heng Yau
E-mail : [email protected] Tel. No. : 07-5531726
PENGKELASAN KEKAR BERINTI BERDASARKAN KEPADA SIFAT-SIFAT KOMPONEN UTAMANYA
(Katakunci: Kekar berinti, tingkahlaku, komponen, penilaian di tapak dan makmal)
Kekar berinti yang wujud di dalam massa batuan boleh menimbulkan pelbagai masalah dalam bidang pembinaan. Jika kekar berinti diramalkan kritikal terhadap sesuatu struktur binaan, tingkahlaku kekar tersebut selalunya dikaji dengan
menggunakan kaedah ujian di tapak dan model fizikal skala besar yang kompleks dan mahal. Ini kerana proses perolehan sampel kekar berinti yang tak cacat merupakan sesuatu yang amat sukar untuk dilaksanakan. Oleh yang demikian, satu kaedah bagi meramalkan tingkahlaku ketakselaran geologi yang kritikal ini amat penting
diwujudkan. Pengkelasan secara sistematik bagi komponen-komponen utama kekar berinti merupa satu pendekatan yang sesuai bagi tujuan ini terutamanya, komponen yang mempangaruhi kelakuan kekar ini di bawah pengaruh beban ricih dan
mampatan.
Beberapa singkapan kekar berinti yang wujud di dalam batuan granit di
kawasan Lahat, Perak, telah dipilih untuk tujuan kajian di tapak. Penilaian di lapangan menunjukkan terdapat beberapa komponen kekar berinti yang memperlihatkan ciri-ciri geologi dan mekanikal tertentu yang boleh dikenalpasti dan dinilai di lapangan dan juga di makmal. Bagi bahan intinya, sifat-sifat yang berkaitan termasuk
ketebalan, gred perluluhawaan dan tekstur. Bagi blok kekar pula, ciri penting termasuk tekstur dan kekasaran permukaan kekar dan tahap perluluhawaan blok tersebut. Gred perluluhawaan inti dan blok kekar dan adalah sifat-sifat geologi yang boleh digredkan mengikut sistem pengkelasan piawai. Sampel inti kekar yang diperolehi telah diuji secara lebih terperinci di makmal menggunakan ujikaji indeks dan pencirian seperti ujian ayakan, mampatan dan ricih.
Kajian ini menunjukkan wujud beberapa komponen kekar berinti yang boleh digunakan bagi meramalkan kelakuannya. Komponen-komponen in mudah untuk dicirikan dan dinilai di lapangan dan di makmal. Sifat-sifat bahan inti dan kekasaran permukaan kekar adalah antara komponen yang amat mempangaruhi kelakuan kekar berinti, dan seterusnya boleh digunakan sebagai indeks pengkelasan bagi meramalkan kelakuan kekar.
Penyelidik utama:
En. Mohd For bin Mohd Amin En. Edy Tonizam bin Mohammad
PM Ir Azman bin Kassim Ong Heng Yau
E-mail : [email protected] Tel. No. : 07-5531726
TABLE OF CONTENTS
CHAPTER TITLE PAGE
1 2 TITLE DEDICATION ABSTRACT ABSTRAK
TABLE OF CONTENTS
LIST OF TABLES
LIST OF FIGURES
LIST OF SYMBOLS
LIST OF APPENDICES
INTRODUCTION
1.1 Introduction
1.2 Background Problems
1.3 Objectives of Study
1.4 Significance of Study
1.5 Scopes of Study
1.6 Organisation of Thesis
LITERATURE REVIEW
2.1 Introduction
2.2 Joint
2.2.1 Filled Joints
2.3 Filled Joint Elements
2.3.1 Material of Infilling
3
4
2.3.2 Particle Shape of Infill Material
2.3.3 Thickness of Infilling
2.3.4 Particle Size Distribution
2.3.5 Surface Roughness
RESEARCH METHODOLOGY
3.1 Introduction
3.2 Field Study
3.3 Sample Preparation
3.3.1 Infill
3.3.2 Artificial Joint Block
3.4 Preliminary Tests
3.4.1 Static Compression Test
3.4.2 Uniaxial Compression Test
3.4.3 Direct Shear Test on Infill Material
3.4.4 Direct Shear Test on Joint-Infill
Boundary
3.5 Field and Laboratory Test Equipment
3.5.1 Uniaxial Compression Machine
RESULT AND ANALYSIS
4.1 Introduction
4.2 Field Investigation
4.2.1 Schmidt Hammer Test
4.2.2 Joint Roughness Coefficient
4.3 Preliminary Tests
4.3.1 Particle Size Distribution and Specific
Gravity
4.3.2 Static Compression Test
4.3.3 Uniaxial Compression Test
4.3.4 Direct Shear Test on Infill Material
4.3.5 Direct Shear Test on Joint-Infill
5 CONCLUSIONS AND RECOMMENDATIONS
5.1 Introduction
5.2 Conclusions
5.3 Recommendations
REFERENCES
APPENDICES A-M
64
65
66
67
LIST OF TABLES
TABLE NO. TITLE PAGE
2.1
4.1
4.2
4.3
4.4
4.5
4.6
Classification of joint filler by origin
JCS at different parts of joint system
Particle size and content of infill sample
Density of infill before and after static compression test
UCS and E Values of rock specimens
Settlement of infill sample at different stages
Shear characteristics of infill with and without preloading
10
38
41
44
51
58
LIST OF APPENDICES
APPENDIX TITLE PAGE
A B C D E F G H I J K L M
Probable weathering stages of filled joint in
granite
Comparison of uniaxial compressive and uniaxial
tensile strengths of rocks
Corrections for reducing measured Schmidt
hammer rebound (R) when the hammer is not used
vertically downwards
Weathering grade and rock properties
Strength classification based on point load index;
Unconfined compressive strength of the main rock
types; Categorization and description of rock
based on its uniaxial compressive strength
Data of Rebound hammer test
Calculation of surface roughness
Specific gravity of infill particles
Result of Static Compression Test
Data of preliminary test (direct shear test on
preloaded infill material alone)
Data of preliminary test (direct shear test on
non-preloaded infill material alone)
Data of preliminary test (direct shear test on
smooth joint-infill boundary)
Data of preliminary test (direct shear test on rough
LIST OF FIGURES
FIGURE NO. TITLE PAGE
2.1 2.2 2.3 2.4 2.5 3.1 3.2 3.3 3.4 3.5 3.6 3.7 3.8 3.9
Layers and movement of grains of infill
Four categories of discontinuity filling thickness
Grain arrangement in
(a) coarse-grained sample
(b) fine-Grained sample
Typical roughness profiles and suggested nomenclature
Condition at joint wall-infill interface for granular infill at
(a) rough joint surface, and (b) smooth joint surface
Site location map
Highly jointed granite outcrop selected for the field study
Filled-joint system, infill sandwiched between two joint
blocks
Measuring of Joint Surface Roughness
(a) Concrete block with saw-toothed surface
(b) Schematic diagram of saw-toothed surface
Schematic diagram of static compression test
Model of specimen tested In uniaxial compression test,
(a) Intact Rock, (b) Matched Joint, (c) Mis-matched Joint,
(d) Filled Joint (t = 10mm) and (e) Filled Joint (t = 20mm)
UCT test specimens
Direct shear test for the investigation of shear strength of
joint-infill boundary for
(a) Smooth joint
(b) Rough joint
3.10 4.1 4.2 4.3 4.4 4.5 4.6 4.7 4.8 4.9 4.10 4.11 4.12 4.13 4.14 4.15 4.16 4.17 4.18 4.19 4.20
MaTest 500 compression machine used in UCT
Filled joint system with no banding of weathering grade
across the infill and joint blocks
Joint surface profiles (a) JRC = 14.1 and (b) JRC = 4.7
PSD curve of infill material
Infill sample divided according to the grain size
Compressibility vs. infill thickness graph
Compressibility vs. normal stress graph
Stress-strain relationship of intact rocks
Stress-strain relationship of matched-joints
Stress-strain relationship of mismatched-joints
Stress-strain relationship of filled joint (10mm infill)
Stress-strain relationship of filled joint (20mm infill)
Stress-strain relationship of different rock specimens
Particle size distribution of infill material after UCT
Shear stress versus displacement, for infill with preloading,
under sormal stress of
(a) 133 kPa
(b) 264 kPa
Shear stress versus displacement, for infill without
preloading, under normal stress of
(a) 133 kPa
(b) 264 kPa
Shear stress versus displacement, for infill samples with
and without preloading
Normal versus shear displacement, for infill sample with
and without preloading
Shear stress versus displacement, for smooth soil-rock
contact
Shear stress versus displacement, for rough soil-rock
contact
Shear stress (at 10 mm shear displacement) versus normal
shear stress, for smooth and rough joint-infill contact
4.21 Normal versus shear displacement, for shearing of different
LIST OF SYMBOLS
∆x - Shear displacement
∆y - Vertical displacement
σp - Shear stress
σn - Normal stress
σc - Unconfined compression strength
φ - Basic friction angle
τ - Peak shear strength
γ - Dry density of rock
c - Coefficient of cohesion
IA - Infill material alone, with normal stress of 133 kPa
IB - Infill material alone, with normal stress of 264 kPa
IC - Infill material alone, with normal stress of 396 kPa
JRC - Joint roughness coefficient
PSD - Particle size distribution
R - Rebound number
RUA - Rough unfilled joint, with normal stress of 133 kPa
RUB - Rough unfilled joint, with normal stress of 264 kPa
RUC - Rough unfilled joint, with normal stress of 396 kPa
RFA - Rough filled joint, with normal stress of 133 kPa
RFB - Rough filled joint, with normal stress of 264 kPa
RFC - Rough filled joint, with normal stress of 396 kPa
SFA - Smooth filled joint, with normal stress of 133 kPa
SFB - Smooth filled joint, with normal stress of 264 kPA
SFC - Smooth filled joint, with normal stress of 396 kPa
SUB - Smooth unfilled joint, with normal stress of 264 kPa
SUC - Smooth unfilled joint, with normal stress of 396 kPa
TFA - Smooth joint filled with very thin infill, with normal
stress of 133 kPa
TFB - Smooth joint filled with very thin infill, with normal
stress of 264 kPa
TFC - Smooth joint filled with very thin infill, with normal
stress of 396 kPa
UCT - Uniaxial compression test
XIA - Non-preloaded infill material alone, with normal stress
of 133 kPa
XIB - Non-preloaded infill material alone, with normal stress
CHAPTER 1
INTRODUCTION
1.1 Introduction
Geological processes and tectonic movements tend to create various
geological discontinuities in rock masses such fault and joint. Due to the presence of
these discontinuities, rock masses are often weak, anisotropic and inhomogeneous.
Consequently, excavation work in a rock mass can be subjected to various problems,
particularly in terms of stability. Among these discontinuities, joints are the common
weakness planes in rock outcrops, particularly in intrusive igneous rock like granite.
In tropical countries, high temperature and rate of rainfall help to induce a
desirable environment for continuous and intensive weathering of rock. Weathering
can affect both the surface and interior part of a rock mass. Joints (secondary
permeability) allow water and other weathering agents to penetrate into the rock.
Upon weathering, the material of the joint surface is being disintegrated and
decomposed to form a completely weathered (CW) material which is much weaker
than the host rock. This leads to the accumulation of weak infill material in the joint
aperture, or in other words, a completely weathered material is being “sandwiched”
in-situ deposition. It involves in-wash of CW surface materials into the originally
open joint (in this case the infill material is not due to gradual weathering of the host
rock). Both weathering of the joint surface and the in-situ deposition in the joint
aperture are the processes that lead to the formation of the most critical geological
discontinuity in rock, namely filled joint.
The presence of weathered material in joint aperture induces a high degree of
inhomogeneity into this weakness plane and leads to the unique behaviours of filled
joint. Normally, materials that fill the joint apertures are highly weathered rock of
grade V (completely weathered rock) and grade VI (residual soils). The infilling
material is often more compressible and crushable than intact rocks. The varying
particle size, shape and mineral composition induce significant variations in the infill
material. Together with the weathered joint surface, the nature of contact between
the interfacing joint surfaces and the nature of the infill create a very complex
deformational behaviour of filled joints as compared to unfilled (clean) joint.
Filled joint often exhibits high deformability and low shear strength when
subjected to loading. These characteristics are unfavourable for any civil
engineering constructions particularly when it involves excavation of rock mass.
They may induce instability into excavated surfaces such as rock slopes and tunnel
walls. Therefore, the properties and behaviours of filled joints must be understood
and appropriately interpreted to ensure adequate information is available for the
design and construction of structure in rock mass that exhibits filled joints. In
summary, filled joint is not only a critical discontinuity in rock, but also a complex
1.2 Problem Background
Being the most critical discontinuity in rock masses, filled joints display
behaviour that are critical to engineering constructions. Specifically, its
deformability, compressibility and shear behaviours are thought to be detrimental to
the stability of any excavation in rock. In addition, each constitutive component of
filled joint, such as joint surface, infill material and joint blocks, displays its own
discrete characteristics. Each characteristic of the constitutive component
contributes to the behaviours of filled joint, interactively. Therefore, sufficient
knowledge on the characteristics of each relevant component is essential to
understand the overall behaviours of filled joint under loading.
Due to its uniqueness and complexity, detailed study must be carried out on
this critical discontinuity. In-situ testing, full-scale laboratory modeling and
computer simulation are often used to study verify its behaviour. However, these
methods are relatively expensive and complex to undertake. Moreover, sampling of
undisturbed filled joint for laboratory testing is almost impossible to be conducted.
Therefore, an appropriate method in interpreting the behaviour and criticality of
filled joint is essential. This method should be suitable to characterise the filled
joint, specifically its characteristics that are relevant in predicting its behaviour.
These characteristics must be those properties that can be easily measured and
evaluated using relatively simple laboratory and field tests.
1.3 Objectives of Study
This study is undertaken in order to achieve the following main objectives:
1. To identify and to select the constitutive components of filled joint which
2. To assess the relevant characteristics of the selected components and to
evaluate their degree of significance in controlling the joint behaviour.
3. To use the selected components and their respective characteristics as
parameters for classifying and for predicting the behaviour of filled joint.
1.4 Significance of Study
The behaviour of filled joint specifically under shear and compressive load is
significantly affected by its constitutive components, which include type of infill,
surface of joint blocks and thickness of infill. By verifying the interacting effect
between these components, a general behaviour of filled joint can be established.
The general behaviour may serve as guidelines in predicting and evaluating the level
of criticality of filled joint on any excavated surface in rock.
1.5 Scopes of Study
The scopes of this study, among others, cover the following aspects:
1. A filled joint resulting from in-situ deposition and with granular, granite
residual soils as infilling.
2. Characteristics of filled joint components selected for study are thickness of
3. Laboratory tests were carried out on model of filled joint consisting of cast
concrete as joint block (flat surface and saw-toothed surface) and granular
granite residual soil as infill material.
4. Model filled joint were subjected to compressive and shear load to obtain the
general deformation behaviour of the respective components.
1.6 Organisation of Report
This report consists of five chapters. Introduction, problem background,
objectives and scopes of study and its significance are outlined in Chapter 1. Chapter
2 comprises some important theories and past researches about filled joint. Chapter
3 focuses on the methodology of this research, which includes field study and
laboratory assessments. The test results and analysis of data are discussed in Chapter
4. Finally, Chapter 5 summarises the research findings and recommendations for
CHAPTER 2
LITERATURE REVIEW
2.1 Introduction
Rock mass is an inhomogeneous and anisotropic material. It is formed by intact
rock substance and very often disrupted by different types of discontinuities such as
joints, bedding planes, cleavage and fractures, formed either by tectonic deformation,
sedimentation or weathering process (Wan Mohd Kamil, 2002). The strength of rock
mass does not normally depend on its material characteristics, but on the strength of the
discontinuities in it. Unfortunately, these discontinuities are often weaker than the rock.
Therefore, the strength and characteristics of discontinuities must be studied to interpret
the stability of the rock mass involved. Among that, filled joints are likely to be the
weakest elements of any rock mass in which they occur and to exert a significant
influence of its behaviour (de Toledo and de Freitas, 1993).
In the field of rock engineering, certain important characteristics of filled joints can
be interpreted through laboratory tests on simulated and artificial joints model. Many
conditions. Throughout the years, quite a number of researches have been carried out to
study various characteristics of filled joints, they include authors like de Toledo and de
Freitas (1993 and 1995), Phien-Wej et al. (1990), Pereira (1990), Papaliangas et al.
(1993) and Ladanyi and Archambault (1977).
The outcomes of these studies have contributed significantly towards the
understanding of the behaviour and characteristics of filled joint, particularly the effect of
this discrete discontinuity on the deformational behaviour of rock mass. This
understanding is vital in assessing and predicting potential slope failure or rock sliding,
which is mostly related to planar weaknesses, like filled joint (Waltham, 2002).
2.2 Joint
Price (1966) described joints as cracks and fractures in rock along which there has
been extremely little or no movement. In geological terms, the word “joint” is frequently
treated as an omnibus term and has been used to describe structures that vary widely in
character. They have occurred and are present within all types of rock (Bell, 1983).
Hence, joints are often encountered during excavation of any rock masses.
Since earlier days, the formation and origin of joints have attracted many
researchers’ interest. Many types of forces have been advocated to account for the
formation of joints, which include torsion, compression and shear, tension and also
fatigue phenomenon. Price (1966) suggested that the majority of joints are
post-compressional structures, formed as a result of the dissipation of residual stress after
Rock masses are continually affected and modified by weathering and erosion.
Mechanical weathering, or disintegration, breaks down rock mass into smaller blocks by
physical interaction (friction between rock and water, wind, raindrop, etc.) and the action
of temperature.
Beavis (1992) explained that joints develop through different processes in different
rock masses. Igneous rock is formed when the hot lava (from the inner of earth) cools
down and solidifies (when it flows to the outer surface of earth). However, hot lava
continues to flow upwards to the surface. The up-pushing lava tends to crack the rock
solid above and creates fracture or joints in it. Joints may also develop in igneous rock
due to the shrinkage of rock mass when magma cools down. In sedimentary rocks, joints
develop when the rocks shrink, due to the drying process of rocks. In summary, joint, as
other types of fractures, are formed as a result of different processes, such as
mineralization, metamorphism, crushing, brecciation, mylonitization, metasomatic
replacement, etc. (Chernyshev and Dearman, 1991).
Ladanyi and Archambault (1977) categorized joints into four classes to ease studies
of joints:
i) Clean
ii) Coated
iii) Filled with clay-like infilling
2.2.1 Filled Joints
Filled joints possess very unique characteristics. However, some of them resemble
the properties of an unfilled joint or fracture. It is believed that filled joints develop
gradually from unfilled joints, so as to maintain their certain behaviours and
characteristics.
Generally, there are two types filled joints based on the origin of the infill. Infill
within the apertures of joints may result from continuous weathering of joint surface, or
in-situ deposition of ground surface materials from the nearby area.
Mohd Amin et al. (2000) briefly described the formation of filled joint in granite
through continuous weathering (see Appendix A). Joints or fractures are discontinuities
(weak plane) that are permeable. Water will penetrate through joint surface, and cause
weathering to happen. The least stable feldspars at joint surfaces will firstly be broken
down during weathering. Further weathering can be noticed by the penetration of
discolouration inwards from the joint surfaces. Hydrolysis of feldspars and mica
eventually increases the volume of the rock material. Expansion of joint block tends to
push and press the opposite joint surfaces together. When compressed, the joint surfaces
will crack and break down into small pieces. Consequently, joint surfaces open up and
fresh rock (initially deep inside the joint) exposed, and subjected to continuous
weathering. The torn pieces from the weathered joint surfaces, form the infilling between
the joint apertures. As they are of smaller pieces, they possess greater effective surface
for weathering. Therefore, the infillings of a filled joint is often of highly weathered
Beavis (1992) explained that weathering and the releasing of load above rock due
to erosion would lead to the forming of an opened joint. These joint openings, might be
clean without infillings, or filled with secondary minerals. These minerals could have
been caused by hydrothermal changes or transportation, or weathering. Wide opened
joints near to the surface of earth may contain infillings deposited from the earth surface.
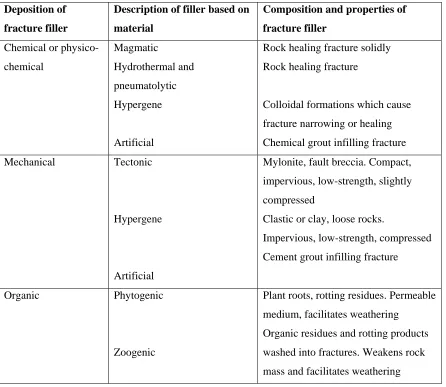
Chernyshev and Dearman (1991) drew up a classification chart of joint filler, based on its
mode of deposition (see Table 2.1)
Table 2.1: Classification of joint filler by origin (after Chernyshev and Dearman, 1991).
Deposition of
fracture filler
Description of filler based on
material
Composition and properties of
fracture filler
Chemical or
physico-chemical
Magmatic
Hydrothermal and
pneumatolytic
Hypergene
Artificial
Rock healing fracture solidly
Rock healing fracture
Colloidal formations which cause
fracture narrowing or healing
Chemical grout infilling fracture
Mechanical Tectonic
Hypergene
Artificial
Mylonite, fault breccia. Compact,
impervious, low-strength, slightly
compressed
Clastic or clay, loose rocks.
Impervious, low-strength, compressed
Cement grout infilling fracture
Organic Phytogenic
Zoogenic
Plant roots, rotting residues. Permeable
medium, facilitates weathering
Organic residues and rotting products
washed into fractures. Weakens rock
2.3 Filled Joint Elements
Filled joints pose very unique and complex behaviours due to their components are
made up of materials of different properties. There are numbers of components having
significant influence on their characteristics. These components are to be studied
individually to enable the interpretation of their interactive effect on a filled joint’s
behaviours to be made. Over the years, numbers of studies on filled joints have been
carried out. Generally, certain joint elements have been recognized as having significant
influence on joint behaviours, such as the material of infillings, the thickness of infillings
and the contact condition between joint block and infillings. Changes in these elements
directly lead to alteration of joint properties.
2.3.1 Material of Infilling
In filled joint, the physical and mineralogical properties of the material separating
the joint walls are the primary concern in determining its shear strength and
deformational characteristics. Filling materials vary greatly in their mechanical
characteristics, from very soft to very hard and strong (Franklin and Dusseault, 1989).
Tulinov and Molokov (1971) defined five types of filling material according to the
genesis:
i) Loose material of tectonic crushed zones
ii) Products of decompression and weathering of joint walls
iv) Filling material of karst cavities, which has been formed by leaching
carbonaceous rocks and then shifted by the ground water flow
v) Filling material of joints and cavities brought from the surface; or it may be of
a mixed origin
Brekke and Howard (1972), on the other hand, distinguished seven major groups of
joints / infilling materials according to their strength:
i) Healed joints
ii) Clean discontinuities
iii) Calcite fillings
iv) Coatings / fillings with chlorite, talc and graphite
v) Inactive clay
vi) Swelling clay
vii) Material that has been altered to a more cohesionless material (sand-like)
The main difference between sand and clay is their permeability. Clay is
considered soil of very low or non-permeability while sand is a highly permeable soil.
The low permeability increases the effect of pore water pressure on the strength of soils.
In low permeable soil, water is trapped inside the pores when the soil is compacted.
Contrary, in highly permeable soil, like sand, pore water is drained out of soil
immediately once the soil is loaded and does not influence to the strength of sand. Cheng
and Evett (1987) described that, since the shear strength of most cohesionless soils is
resulted from the interlocking between grains, values of friction angle differ little whether
the soil is wet or dry. This clearly explains that moisture content display very small
Mohd Amin and Awang (2002) carried out uniaxial compression test on
modeled filled joints and found that a significant reduction in joint stiffness and Young’s
modulus (about 20 times smaller) may occur when weak material, like CW granite, is
present in joint aperture. This is due to the high axial-strain and low Young’s modulus
exhibited by the infill material. The series of tests conducted strongly indicated the effect
of infilling on the compressibility of joint.
2.3.2 Particle Shape of Infill Material
Particle shape has a pronounced effect on properties of soil, such as, void ratio,
compressibility, crushability, etc. Varying particle shapes can lead to drastically different
engineering properties even on granular soils at the same relative density (Holubec and
D’Appolonia, 1973).
Generally, particle shape is defined by its angularity/roundness and sphericity.
Sphericity is the ratio of the surface area of a sphere having the same volume as the
particle to the surface area of the particle, while angularity is a measure of the curvature
of the corners to the average curvature of the particle (Holubec and D’Appolonia, 1973).
Judging from the aspect of angularity, particle shape can be divided into five main
categories, which are angular, sub-angular, sub-rounded, rounded and well rounded
(Franklin and Dusseault, 1989).
Holubec and D’Appolonia (1973) studied the effect of particle shape on the
engineering properties of granular soils. With the increase in particle angularity, the
or the friction angle is found to be greater for soils with more angular particles (also
proven by Koerner, 1970). It is because the angularity provides interlocking effect
between grains, thus increasing the resistance to shear. Whenever a grain is considered to
be a polygon of a finite number of sides (high angularity), the concept of rolling friction
is no more valid and is to be replaced by overturning friction (Pereira, 1990). Besides,
the more angular the particles are, the greater the failure strain for a given relative density
will be. Tests carried out showed that crushed stone with angular particles has greater
elastic and permanent deformations than crushed gravel composed of rounded particles
(Haynes, 1966; Dunlap, 1966; Holubec, 1969). Particle angularity is also proven to
contribute to the resistance to the dynamic penetration of soils. However, angular
particles are found to be more crushable than the spherical grains (Feda, 2002).
2.3.3 Thickness of Infilling
Thickness of infilling layer has significant influence on filled joint’s strength. The
range of infill thickness with regard to the particle size limits the type of movement of
the filler particles. Pereira (1990) studied the movement of grains in a filler of thickness
twice greater than the grains size (see Figure 2.1). When sheared, grains with contact to
the flat and planar joint surface tend to roll. However, grains on the other side may block
the rolling motion and force it into sliding motion. In the middle of infill layer
Figure 2.1: Layers and movement of grains of infill (after Pereira, 1990)
At the same time, it can be expected that when the filler is a-grain-thick, contact of
grains to flat surface on both sides allow a rolling motion to take place, imposing only a
low rolling friction rather than the high sliding friction.
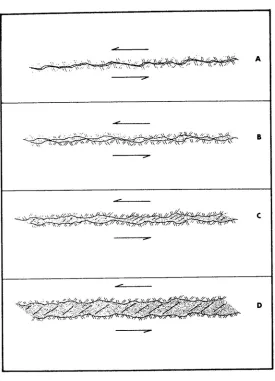
Barton (1974) idealized four hypothetical thickness of clay filling in a rough,
undulating joint (Figure 2.2). The shear characteristics of these filled joints can be
briefly described as below:
A) Almost immediate rock/rock asperity contact. Shear strength will be very little
different from the unfilled strength because the rock/rock contact area at peak
strength is always small. Dilation due to rock/rock contact will cause negative pore
pressures to be developed in filling if shearing rate is fast.
B) Similar to A, but a larger displacement is required to reach peak shear strength.
Reduced dilation reduces tendency for negative pore pressures.
C) No rock/rock contact occurs anywhere, but there will be a build up of stress in the
filling where the adjacent rock asperities come closer together. Greater shear
occur, avoiding the increase in pore pressure that can reduce the effective stress on
the filling.
D) The influence of the rock walls will disappear, as the infillings are several times
thicker than the asperity amplitude. If the filling is uniformly graded and mostly
clay or silt, the shear strength behaviour can be estimated by basic soil mechanics
principles.
Over the years, many researchers have done their studies on the effect of infill
thickness to the strength of the joint systems. Majority of them have shown that when the
infill layer is thicker, the joint system is weaker. Aora and Trivedi (1992) found out that
for filled joint with thicker infilling, its uniaxial compressive strength is relatively smaller
than the unfilled one. Through triaxial test on filled joint, Sinha and Singh (2000) proved
the weakening of joint system by the increasing infill thickness.
Lama (1978) on the other hand, analyzed the shear strength of rough joint with
clayey materials, by Regression Method. Likewise, he proved that when the thickness of
infill increases, the shear strength of the joint system decreases. Adding to that, his study
suggested that the minimum shear strength of the joint system is of the filler alone. This
means, when the infill is very thick, the shear strength of joint is equal to the shear
strength of the filling material alone. Phien-Wej et al. (1990, 1991) supported this
argument by proving that when the thickness of clay layer in filled joint approaches twice
of the roughness amplitude or asperities of the joint surface, the shear strength of the joint
system will reach its minimum, which is of the filler alone. However, for a flat planar
joint filled with granular material, its shear strength is similar to the shear strength of the
filler alone at any infill thickness.
However, there are other authors who postulated a different and extended
interpretation. For example, Papaliangas et al. (1990) advocated that the infill/rock wall
interface might have less shear resistance compared to the infill material, highlighting the
probability that the shear strength of the filled joint might be lower than the shear
strength of the infill material alone. Adding to it, they found that when the infill
thickness increases, greater shear displacement is to be achieved in order to reach the
2.3.4 Particle Size Distribution
Particle size distribution (PSD) is the content of grain of different sizes in a soil
sample. It is an important parameter for classifying granular and relative coarse soil
sample. It describes soil sample physically, from which, subsequently, the physical and
mechanical behaviour of the sample can be interpreted.
Generally, potential crushing of mineral grain increases with the grain size (Hardin,
1985; Ong, 2000). Contact area between coarser grains is smaller, compared to finer
grain (see Figure 2.3). Therefore, when loaded or stressed, the effective stress on each
grain is much larger, resulting in greater crushing of grains. Feda (1971) proved that
poorly graded sample with high content of voids is more crushable than the well graded
sample.
Figure 2.3: Grain arrangement in (a) coarse-grained sample (b) fine-grained sample
(After Ong, 2000)
Farmer and Attewell (1973) proved that, apart from the crushability,
compressibility of a soil sample also increases with its grain size. The presence of large
place. Compression comes mostly from the rearrangement of grain particles to fill the
voids within.
2.3.5 Surface Roughness
Surface roughness is a measure of the inherent surface unevenness and waviness of
the discontinuity relative to its mean plane (Brady and Brown, 1985). It is a major factor
determining the shear strength of a joint. The nature of the opposing joint surfaces
influences the behaviour of rock mass as the smoother they are, the easier movement can
take place along them (Bell, 1983).
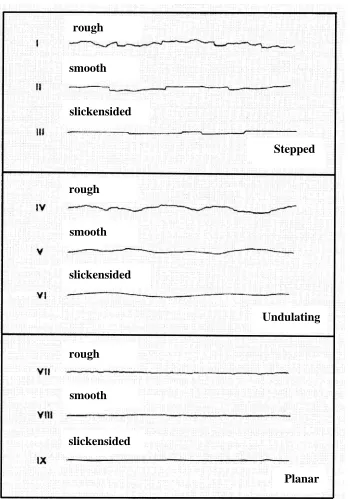
Figure 2.4 shows the typical joint roughness profiles and nomenclature suggested
by Barton (1978). It is recognized that the shear strength generated from the joint surface
Figure 2.4: Typical roughness profiles and suggested nomenclature (after Barton, 1978)
In filled joint, the effect of surface roughness to the shear strength is reduced by the
presence of infill material. However, when the infill thickness is within the interfering
zone , joint surface roughness still contributes significantly to the joint shear strength. slickensided
slickensided slickensided
rough
smooth
Planar Undulating Stepped
smooth
The movement of infill grains at the interface layer is greatly influenced by the
boundary effect (the infill-joint wall contact condition). The boundary effect is even
more significant on granular infill. With reference to Figure 2.5(a), if the joint surface is
rougher than the infill grain, it will hold the particles to position. Failure of joint will
happen only if the stress applied overcomes the sliding friction of the infill. However, on
a smooth joint surface, infill grains are not retained from movement. Infill particles are
allowed to rotate for particles rearrangement to take place. A much lower resistance is to
be overcome for grains to rotate than to slide. Therefore, the shear strength of a smooth
filled joint is relatively low, resulted by the rolling friction at the infill-wall interface
rather than sliding friction (Pereira, 1990 and de Toledo and de Freitas, 1993).
Figure 2.5: Condition at joint wall-infill interface for granular infill at (a) rough joint
surface, and (b) smooth joint surface (after de Toledo and de Freitas, 1993) (a)
CHAPTER 3
RESEARCH METHODOLOGY
3.1 Introduction
This chapter highlights the various field study and preliminary laboratory
tests in order to obtain a representative physical model of filled joint to be used in the
main testing program. Actual conditions of filled joint in the field were observed and
certain properties of filled joint were tested in-situ. A number of physical tests on
the infill material were also carried out in the lab mainly to understand its
characteristic before being modeled in the main tests. The properties of filled joint,
which could not be assessed in the field, were accordingly simulated and modeled in
the laboratory based on field data. The main testing programme carried out in
laboratory was direct shear test. A large shear box apparatus was designed and used
to shear the joint specimen up to 25 mm. Different joint surface textures, infill
thickness, and normal stress were modeled on artificial filled joint model. The shear
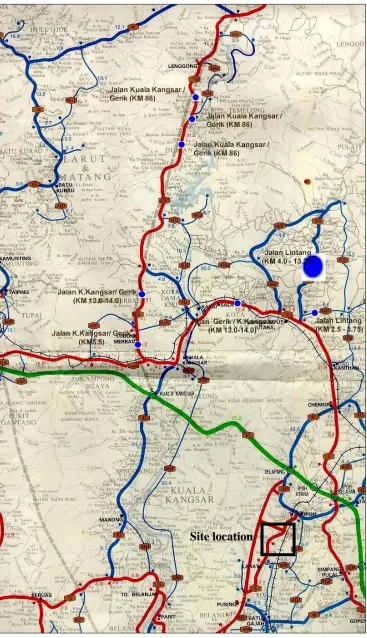
3.2 Field Study
Field study was carried out on an outcrop of filled joint in granite rock. The
site is located at Lahat, along Ipoh-Lumut trunk road, about 10 km south west of
Ipoh (see Figure 3.1 and Figure 3.2). This filled joint was resulted by the in-situ
deposition of surface material into the joint apertures. The infill material comprised
of mainly decomposed weathered granite (see Section 2.4).
The relevant components of filled joint that contribute to its behaviours were
identified and accordingly evaluated using index test and visual assessment (see
Figure 3.3). These components included infill thickness, joint surface roughness,
weathering condition of joint, joint surface hardness. Rebound number (Schmidt
Hammer Test) was taken at different parts of the joint block (i.e. fresh rock,
weathered rock and surfaces of joint apertures). The rebound numbers obtained were
corrected according to the direction of Schmidt hammer when in use, as suggested
by Brown (1981) (see Appendix C). The unconfined compression strength (UCS) of
rock surface was then calculated by using Equation 3.1 (Miller 1965).
( )
0.00088 1.01log10 σc = γR+ ……(3.1)
where (σc) = Unconfined compression strength of surface (MN/m2)
γ = Dry density of rock (kN/m3) (26 for granite) (Daly, et al., 1966;
Waltham, 2002)
Figure 3.2: Highly jointed granite outcrop selected for the field study
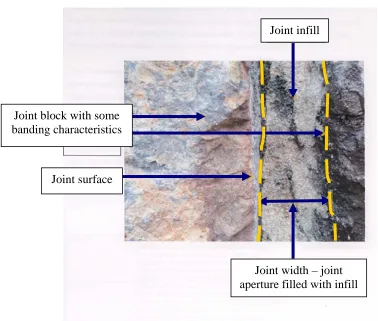
Figure 3.3: Filled-joint system, infill sandwiched between two joint blocks Joint block with some
banding characteristics
Joint surface
Joint infill
Basic concept of Franklin and Dusseault (1989) was modified and adopted in
measuring in-situ Joint Roughness Coefficient (JRC) of the filled joint. A
straightedge steel ruler (100 cm length) was placed on the joint surface and photos
were taken with the ruler, joint surface and the shadow of ruler on joint surface
clearly shown (see Figure 3.4). As the photos were taken in the afternoon, the
shadow of ruler on the joint surface reflects the exact surface roughness. From the
photo, the shadow of ruler on joint was traced onto graph paper.
Figure 3.4: Measuring of JRC
The Centre Line Average (CLA) method by Tse and Cruden (1979) was
adopted in calculating the joint roughness. The edge of ruler was taken as a
reference plane to measure the asperities amplitude. The central plane of the
asperities was determined and relative asperities heights relative to the centerline
were measured. Equation 3.2 and 3.3 were used to calculate the JRC.
∫
=== x L
x ydx
L CLA
0 1
∑
=
≈ N
j j y
N 1
1
JRC = 2.76+78.87 CLA …(3.3)
The surface profile (JRC) and joint properties (JCS) obtained from in-situ
investigation were discussed in detail in Section 4.2.1 and 4.2.2. These results were
taken in account in the design and modeling of the filled joint in laboratory
assessments.
3.3 Sample Preparation
3.3.1 Infill
Samples of infill material were scratched out of the filled joint and packed
into plastic bags. They were then oven-dried overnight. Foreign substances, such as
grass roots were removed from the sample. Fine particles that cling on to larger
particles were loosened to minimized amalgamation effect. This was done manually
without using any machine or hammer, to prevent potential crushing of the grains.
These samples were then sieved to obtain its particle size distribution (PSD),
according to BS1377: Part 2 (1990). The entire infill sample tested in laboratory test
was reconstituted according to this PSD obtained (shown in Figure 4.3). Apart from
PSD, the specific gravity of the infill particle was also investigated.
The details of the PSD and specific gravity of infill material are discussed in
3.3.2 Artificial Joint Block
Artificial joint blocks were made from Grade 60 concrete. The mix design of
the cast concrete was cement: sand: coarse aggregate (20 mm maximum size) of 1:
1.2: 3; water to cement ratio was 0.34. To increase workability, superplasticizer was
added into the cement mix (about 1% of cement). The mix was design in such a way
as to provide controllable and reproducible joint block with more regular and
uniform surface roughness. To obtain surfaces similar to joint surface in rock, Two
types of surface textures were prepared and these were flat and planar surface
representing smooth-surfaced joint, and saw-toothed surface representing rough joint
surface (see Figure 3.5).
Figure 3.5: Schematic diagram of saw-toothed surface
3.4 Preliminary Tests
A number of preliminary tests were carried out prior to the main testing
programme. They were undertaken to verify the basic behaviours of the infill
material that may have interactive effects on the behaviour of the model filled joint.
The information obtained from these tests served as guidelines in designing the
methods and procedures used in the main testing programmes. Most importantly,
this information was essential in designing and fabricating the large shear box 15 mm
equipment. For example, the amount of dilation and compression that can be
expected when the model joint was sheared under specific normal load.
3.4.1 Static Compression Test
This was a non-conventional test where certain procedures were adopted to
achieve the required result. The test was termed as static compression test and was
carried out to study the compressibility and deformability of infilling material under
static load. The effects of infill thickness and magnitude of applied stress were
compared against the compressibility of the infill.
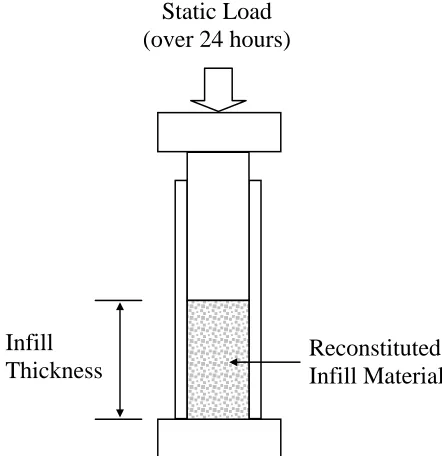
Reconstitutive infill samples of certain weight (300, 400 and 500 g) were
filled into the compression mould under loose condition (see schematic diagram in
Figure 3.6). The thickness of the infill in the mould was measured and the initial
infill density was calculated. The relationship between infill density and thickness
was investigated. Static normal load (109 kPa, 132 kPa and 155 kPa) was then
applied onto the infill material for 24 hours. The settlement of infill was measured.
The void ratio of the tested sample (before and after test) was calculated. The
reduction of void ratio throughout the test was calculated as the compressibility of
Figure 3.6: Schematic diagram of static compression test
3.4.2 Uniaxial Compression Test
Uniaxial compression tests (UCT) were carried out on joint model of smaller
scale. This test was to verify the effect of discontinuity plane (i.e. joint) on the
behaviour of intact rock, as mentioned by (Goodman, 1974). The main
characteristics observed in this test were the amount of compression displayed by
various types of joint. Data on Uniaxial Compressive Strength (UCS) and the
Young’s Modulus (E) of joint models were collected.
Normal compressive load was applied at a constant increasing rate (1.5
kN/sec) onto specimen. The specimens tested consisted of intact rock, matched rock
joint, mis-matched rock joint and filled joint model (see Figure 3.7 and Figure 3.8).
For this investigation, granite core samples of 52 mm diameter (D) were used. The
core samples were sawn into two and rejoined, to create an artificial smooth,
matched joint. The smooth surfaces of joint blocks were grinded to become rough Infill
Thickness
Reconstituted Infill Material Static Load
and undulated, which were then paired into mis-matched joints. The overall height
(H) of the specimen was limited to 104 mm to maintain an H/D ratio of 2.
The infill material used was the reconstitutive sample as discussed in
previous section. Infill material was filled in between of joint blocks with smooth
surfaces to simulate filled joints.
Figure 3.7: Model of specimen tested in uniaxial compression test, (a) Intact rock,
(b) Matched joint, (c) Mis-matched joint, (d) Filled joint (t = 10 mm) and (e) Filled
joint (t = 20 mm)
Figure 3.8: UCT test specimens
(a) (b) (c) (d) (e)
H=104mm
Continuous readings of normal load and vertical displacement were recorded
throughout the test, till the failure of the specimen. The stress-strain curve for each
specimen tested was plotted to obtain its E and UCS. These results were compared
in order to verify the effect of clean joint and infilling to the properties of intact rock.
3.4.3 Direct Shear Test on Infill Material
The shear behaviour of the infill material alone was investigated using a
small-scale direct shear test apparatus. The test was undertaken by filling the shear
box (dimension 100 x 100 x 40 mm) with reconstitutive sample of infill material (see
Section 3.3.1) under loose condition.
Two types of loading conditions were imposed on the infill prior to shearing,
and these were with preloading and without preloading. In the shear tests with
preloading, the sample was subjected to a normal compressive load (σpre) of 133 kPa
for duration of 30 minutes before shearing. In the shear tests with preloading,
shearing was undertaken immediately upon placement of sample into the shear box.
These series of loading conditions were undertaken essentially to verify the effect of
preloading on the shear behaviour of the infill
For both types loading conditions, direct shear test was conducted at a
shearing rate of 0.6 mm/sec as suggested by Brown (1981). Two levels of normal
stress were applied during shearing i.e. σn1 = 133 kPa and σn2 = 264 kPa to simulate
granite slope of 5 and 10 m height. Measurement of both vertical and horizontal
3.4.4 Direct Shear Test on Joint-Infill Boundary
Small-scale direct shear tests were also carried out to investigate the shearing
behaviour between the infill material and the joint block, particularly at the interface
between the joint and the infill (joint-infill boundary).
Reconstitutive infill sample and smaller joint blocks (cross-sectional area of
100 x 100 mm) of similar material and surface profiles as mentioned in Section 3.3.2
were used in this series of tests. Figure 3.9 (a) and (b) show the arrangement of
concrete block and infill material in the shear box. The joint-infill boundary was
arranged as close to the shear plane as possible.
Prior to shearing, the specimen was preloaded with normal stress of 133 kPa
for 30 minutes. This was to ensure a more uniform distribution of density within the
infill layer, and also a more uniform contact between the infill grain and the joint
block surface. Two normal stresses as in Section 3.4.3 were applied during shearing
(a)
(b)
Figure 3.9: Direct shear test for the investigation of shear strength of joint-infill
boundary for (a) Smooth joint, and (b) Rough joint
3.5 Field and Laboratory Test Equipment
In complementing the scope of this study, several important equipments were
used, for both field and laboratory assessments. Generally, they include Schmidt
Hammer, compression mould, linear variable displacement transducer (LVDT), load
cell and direct shear box. Details of several equipments (uniaxial compression Concrete Block
Infill
Shear force Normal Stress
Shear Plane
Lower shear box (Sliding) Upper shear box (Fixed position)
Infill
Shear force Normal Stress
Shear Plane
Lower shear box (Sliding) Upper shear box
(Fixed position)
machine, data logger and large shear box apparatus) were described together with
their purposes in the following sections.
3.5.1 Uniaxial Compression Machine
Uniaxial compression machine namely MaTest 500 (Figure 3.10) was used to
apply normal compressive load onto the modeled joint and filled joint during the
UCT (see Section 3.4.2). This machine is able to apply compressive load at various
rate up to a maximum load of 2000 kN.
CHAPTER 4
RESULT AND ANALYSIS
4.1 Introduction
The results of site investigation and laboratory tests were analysed and
presented in this chapter. Appropriate interpretations and inferences were made on
the joint behaviours, with possible affecting factors discussed.
4.2 Field Investigation
Figure 4.1 below exhibits the actual filled joint system. The thickness of the
infill layer of the joints at the selected site ranged from about 10 cm to 30 cm. The
joint surface is estimated to be rough and undulating. A clear and obvious difference
in weathering grade is found between the infill layer and the joint block. No
banding, i.e. gradual change in weathering grade is observed between the infill layer
and the joint block. Consequently, it is believed that the infill was resulted from
surface have been washed into the originally open joint aperture to form this filled
joint system. This infill material consists of loose granitic residual soil (RS).
Figure 4.1: Filled joint system with no banding of weathering grade across the infill
and joint blocks
Three major parts of the joint block were recognized. Fresh and intact rock
experienced very low degree of weathering. However, the exposed surfaces of the
joint block do exhibit slight weathering (SW). A relatively higher weathering effect
was observed on the joint surfaces interfacing with the infill (MW to HW).
However, the gradual change in weathering grade of the filled joint system is not that
4.2.1 Schmidt Hammer Test
Schmidt hammer or rebound hammer test was carried out in-situ. The results
obtained from this test are reliable as the surface hardness of the joint tested is
greater than 20 MPa (Brown, 1981).
By using Equation 3.1, and the density of granite as 26 kN/m3, the joint
compressive strengths (JCS) at different parts of the joint system were calculated and
shown in Table 4.1 below. Interpretation of the weathering grade was based on the
JCS obtained, with reference to Waltham (2002) (see Appendix D).
Table 4.1: JCS at different parts of joint system
Joint Component
R (average)
R
(corrected) JCS (MPa)
Grade of Weathering
Fresh Rock 55 52.9 166.4 II
Weathered Rock 40 37.3 73.0 III
Joint Surface 24 21.0 30.9 III
Table 4.1 clearly shows that the original intact granite rock is an “extremely
strong” rock, with its JCS greater than 150 MPa (Brown, 1981). Broch and Franklin
(1972) and McLean and Gribble (1979) categorized rock of this strength as “very
strong” rock (see Appendix E). According to Waltham (2002), very slight
weathering has affected rock of this range of JCS. However, when exposed to the
natural surrounding, the JCS is reduced significantly. For the filled joint studied,
weathering has resulted in a loss of about 81 % of JCS at the joint apertures. With
continuous weathering on the joint surface, the JCS is expected to decrease with
time. Consequently, differential weathering of the joint surface will lead to the
increase of infill thickness.
With the understanding on the JCS of the rock joint, suitable concrete
strength (UCS) was chosen for the joint block model. Cast concrete block of Grade
60 was used to simulate weathered rock joint of weathering grade III.
4.2.2 Joint Roughness Coefficient
As discussed in Section 3.2, the Joint Roughness Coefficient (JRC) of the
joint surface was calculated. The value of JRC measured on different portions of the
joint surface varies from 4.7 to 14.1. By comparing the joint surface profile with the
profile suggested by Barton (1976, 1978), the joint surface investigated could be
described as rough and undulating. Figure 4.2 below shows the profiles of the joint
surface displaying the maximum and minimum JRC measured from the field.
0.0 10.0
0.0 10.0 20.0 30.0 40.0 50.0 60.0 70.0 80.0 90.0 100.0
(a)
0.0 10.0
0.0 10.0 20.0 30.0 40.0 50.0 60.0 70.0 80.0 90.0 100.0
(b)
4.3 Preliminary Tests
Preliminary tests are supplementary works carried out to gather a better
understanding on the overall behaviour and properties of filled joint. The properties
investigated included the basic characteristics of the infill (PSD and specific gravity),
shear behaviours of the infill and the joint-infill boundary effect, and the
compressive / dilative behaviours of the infill, intact rock and jointed rock samples.
4.3.1 Particle Size Distribution and Specific Gravity
The mean PSD curve of the infill tested is shown in Figure 4.3 below. The
percentage of various particles size that makes up the infill is also listed in Table 4.2
0 20 40 60 80 100
0.001 0.01 0.1 1 10
Particle Size (mm)
P
ass
ing P
e
rc
entage
(
%
)
Figure 4.3: PSD curve of infill material
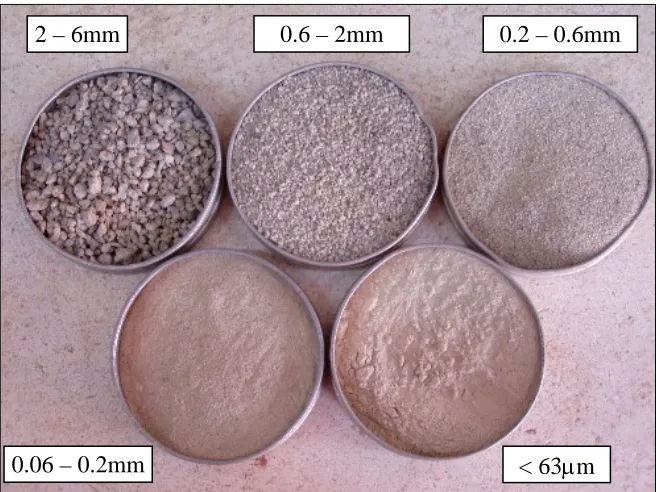
Table 4.2: Particle size and content of infill sample
Particle size %
Fine (<0.06 mm) 7
Fine Sand (0.06 – 0.2 mm) 11
Medium Sand (0.2 – 0.6 mm) 18
Coarse Sand (0.6 – 2.0 mm) 50
Fine Gravel (2.0 – 6.0 mm) 14
The infill was graded as Well-Graded Silty Sand. It is evident that a major
portion (more than 60%) of the infill consists of medium to fine gravel. Crushing of
these coarse and fine gravels is expected to influence the shear strength and shear
behaviour of the filled joint model. The various particle sizes may imply that the
infill would display variable shear strength, which is believed to be mainly
Specific gravity of the infill particles was also determined. The average
specific gravity for the infill particles of different sizes was found to be about 2.46.
Yusof (2003) has done research on the specific gravity of granitic residual soils at
1m – 7m depth, found in peninsular of Malaysia. He suggested that the specific
gravity of these materials lies in between 2.50 to 2.74. On the other hand, Abu
Bakar (2004) determined the average specific gravity of the granitic residual soils
was 2.74. The specific gravity of the infill material tested in this study has been
found to be lower than the ranges mentioned. This implies that on the ground
surface, the infill material was subjected to more extensive weathering, and that
weathering has altered the physical properties of the grains. Figure 4.4 below shows
the infill particles separated according to different ranges of particle sizes.
Figure 4.4: Infill sample divided according to the grain size
2 – 6mm 0.6 – 2mm 0.2 – 0.6mm
4.3.2 Static Compression Test
Compressibility of the infill material (%) was investigated through static
compression test. The influence magnitude of normal stress (N) to the
compressibility of the infill is shown in Figure 4.5 below.
0 5 10 15 20 25
0 50 100 150 200
Infill Thickness (mm)
C
o
m
p
re
ssi
b
il
ity (%
)
N=109kPa N=132kPa N=155kPa
Figure 4.5: Compressibility vs. infill thickness graph
To obtain certain thickness of infill, the weight of the infill was limited to 300,
400 and 500 g. The compressibility of infill material of different weight (W) under
0 5 10 15 20
0 20 40 60 80 100 120 140 160 180
Normal Stress (kPa)
C
o
m
p
re
s
s
ib
il
it
y
(
%
)
W=300g W=400g W=500g
Figure 4.6: Compressibility vs. normal stress graph
Through Figure 4.6, it is proven that the infill is more compressible when its
thickness is increased. More pores present in thicker infill contribute to a higher
compressibility. At higher stress (>100 kPa), compressibility of infill increases
almost linearly with the thickness. Similar trends are observed in the relationship
between infill compressibility and the magnitude of the normal stress. At various
infill thicknesses, higher normal stress results in greater compressibility.
The changes in density of infill material throughout the static compression
tests are listed in Table 4.3 below.
Table 4.3: Density of infill before and after static compression test
Average Final Density (kg/m3) Average
Initial Height (mm)
Average Initial Density
(kg/m3) σn = 109kPa σn = 132kPa σn = 155kPa
94.4 1497.1 1569.7 1519.4 1547.0
129.1 1460.4 1438.2 1552.6 1587.7
It is clearly shown that thicker infill tends to be more porous. This explains
the occurrence of greater compressibility in thicker infill samples. Similar trend is
observed in the post test infill density (with the exception of specimen with 94.4 mm
initial height and normal stress of 132 kPa). To reach a certain level of density,
thicker infill requires a greater normal load and longer period of compression as
compared to thinner infill, although they appear to be more compressible.
The PSD of infill sample after the compaction test is almost similar to that of
the original PSD (reconstitutive sample). This indicates that static compaction did
not cause any significant amount of crushing. Hence, the compressibility exhibited
by the infill is mainly due to the particles rearrangement within the available voids.
4.3.3 Uniaxial Compression Test
Unlike static compression test, uniaxial compression test was carried out with
increasing compressive load applied onto joint models. The Uniaxial Compressive
Strength (UCS) (the compressive stress at failure), Young’s Modulus (E) (tangent
modulus obtained at 50% UCS) and the compressional behaviour of the rock
specimen were studied. As mentioned, this series of tests was carried out mainly to
investigate the effect of various types of joint on the compressibility of rock
specimens.
The stress-strain curves of intact rock, matched-joint and mismatched-joint
are shown in Figure 4.7, 4.8 and 4.9 respectively below (IR = Intact rock sample; SJ