
Colloidal stability and aggregation of lignocellulosic materials in aqueous suspension: A review
73
0
0
Full text
(2) REVIEW ARTICLE. bioresources.com. dominant over gravity and inertia when at least one dimension of the dispersed phase is smaller than about 1 µm (Hunter 2001; Hiemenz and Rajagopalan 1997). Though cellulosic fibers themselves usually exceed this size range, the other objects mentioned in the preceding list do not. Already in the 1940s scientists in the Netherlands and in Russia had developed a quite serviceable theory to account for the rates at which colloidal particles in aqueous solution can be expected to undergo sticking collisions, forming agglomerates, and eventually precipitating out of suspension (Derjaguin and Landau 1941; Verwey and Overbeek 1948). This so-called DLVO theory is based on the net effect of two classes of forces. On the one hand, van der Waals forces, which can be considered as forces of attraction under the conditions to be considered in this article (in some cases they can be repulsive), result primarily from a correlation among permanent, induced, and transient electronic dipoles in facing surfaces, associated with the whirling movements of electrons in their orbitals. The van der Waals forces are treated as additive with electrostatic forces, which result from the interplay between net excess populations of ions that accumulate adjacent to charged surfaces, i.e. “ionic double layers.” Such electrostatic forces usually contribute to repulsion between like-charged objects in aqueous suspension. These concepts have served as a foundation underlying most attempts at understanding the colloidal behavior of cellulose, lignin, and related materials. The outermost molecules on the dispersed phase can be expected to play a dominant role in determining the nature and strength of colloidal forces, which also will depend on the distance between the surfaces. Because hydrogen bonds play such a prominent role relative to the structure and properties of cellulose, it is reasonable to expect hydrogen bonding to affect the relative proportions of different chemical moieties that are exposed at the surface. Ordinarily it might be expected that the presence of polar, hydrogen-bonding OH groups would impart a water-loving character to a surface. However, as elucidated by Mann and Marrinan (1958), a majority of cellulose’s OH groups participate in intra-molecular and inter-chain hydrogen bonding, leaving only a minority that may be available for interactions with an aqueous medium or surrounding materials (Kadla and Gilbert 2000). Thus, despite the presence of three OH groups per glucopyranose unit in the cellulose chain, cellulose can be expected to show properties that are intermediate between fully hydrophilic and hydrophobic (Biermann et al. 2001). In addition, the relatively hydrophilic polysaccharide components of wood and other cellulosic materials often are at least partly covered up by relatively lower surface energy substances, i.e. lignin and extractives. Conversely, dissociation of carboxylic acid groups associated with hemicellulose, certain extractives, and other components of cellulosic surfaces contributes to negative surface charges. Because of their strong interaction with water, ionic groups at a fiber surface are expected to contribute strongly to its hydrophilic character. Surface Morphology of Cellulose Materials Morphology can profoundly affect colloidal interactions between surfaces. Theories of colloidal interactions, in their most basic form, usually start by assuming that the facing surfaces have idealized, perfect shapes, i.e. two facing smooth slabs, a pair of perfect cylinders, a sphere approaching or being pulled from a planar surface, etc. (see,. Hubbe and Rojas (2008). “Colloidal stability of cellulosics,” BioResources 3(4), 1419-1491. 1420.
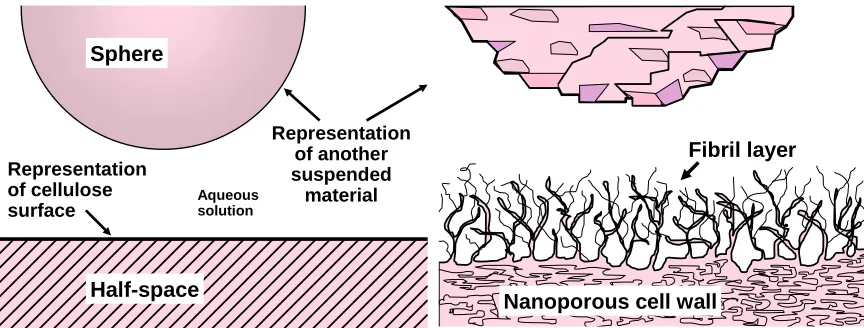
(3) bioresources.com. REVIEW ARTICLE. for instance, Hogg et al. 1966; Israelachvili 1992; Hiemenz and Rajagopalan 1997). For example, the left-hand frame of Fig. 1 depicts one of the idealized situations that is often used to calculate colloidal forces. Although recently it has been possible to prepare both regenerated and native cellulosic surfaces that are fairly smooth on a nanometer scale (Edgar and Gray 2003; Tammelin et al. 2005; Sczech and Riegler 2006; Ahola et al. 2008a; Kontturi et al. 2006), most naturally occurring lignocellulosic materials have surfaces that are rough, porous, and often fibrillated. For instance, the refining of cellulosic fibers, in preparation for their use in the manufacture of paper, can be expected to unravel and partially delaminate the outer layers of a fiber, resulting in fibrils that can extend outwards toward the solution phase (Clark 1985; Neuman et al. 1993; see righthand frame of Fig. 1). Due to the complex structure of most cellulosic surfaces, it even can be difficult to define where the solution phase ends and the solid phase begins. The sizes of fibrils at cellulosic surfaces can range from micrometer dimensions down to macromolecular chains and small bundles of such chains (Neuman et al. 1993; Pelton 1993). Pang and Gray (1998) used atomic force microscopy to show that the conformation of nano-sized fibrils at fiber surfaces from fiber surfaces is controlled by colloidal forces. Thus, the degree of extension of the nano-fibrils outwards from the cellulosic surface decreased with increasing salt concentration (Rutland et al. 1997).. Sphere. Representation of cellulose surface. Aqueous solution. Half-space. Representation of another suspended material. Fibril layer. Nanoporous cell wall. Fig. 1. Representations of (left) an idealized geometry that can be used to estimate short-range interaction forces involving surfaces in aqueous solution, and (right) a reminder that the actual situation is likely to involve porous and rough materials which, in the case of cellulosic surfaces, may involve fibrils and nanofibrils extending towards the solution phase.. Another factor that makes it difficult to actually calculate colloidal forces at wetted cellulose surfaces is porosity. Cellulosic pulp fibers, when they are wet, are highly porous. Typical pore sizes range from about 1nm to about 50 nm, depending on the type of pulp, its preparation, the method of analysis, and how the data are interpreted (Stone and Scallan 1968; Deodhar and Luner 1980; Berthold and Salmén 1997; Alince 2002; Andreasson et al. 2003; Zemljic et al. 2008). As will be discussed later, the presence of nano-sized pores helps to explain the tendency of cellulosic materials to swell in water, and also the dependency of such swelling on pH, electrolyte concentration, and other factors (Grignon and Scallan 1980; Scallan 1983; Scallan and Tigerström 1992;. Hubbe and Rojas (2008). “Colloidal stability of cellulosics,” BioResources 3(4), 1419-1491. 1421.
(4) REVIEW ARTICLE. bioresources.com. Lindström 1992; Salmén and Berthold 1997; Fält and Wågberg 2003; Freudenberg et al. 2007). Another complication is that the surface area per unit mass (specific surface area) of cellulosic fibers (including tracheids, fibers, and cell elements) is often smaller than the specific surface area of fine particles in the suspension. Due to their relatively high specific surface area (Marton and Marton 1976; Marton 1980a,b; Seth 2003), cellulosic fine materials can be expected to play an important role in colloidal interactions of cellulose-based suspensions. Chemical Nature of Cellulosic Surfaces Cellulose-related surfaces (comparing fibers, tracheids, cell elements, fines, etc.) often have different proportions of cellulose, hemicellulose, lignin, and extractives (Tiberg et al. 2001; Duchesne et al. 2003). The lignin content of natural woody fibers generally is higher towards their outer surface, reaching a maximum in the middle lamella region between the fibers (Fujita and Harada 2000). As demonstrated by Micic et al. (2003), there is reason to think that the organization of lignin and cellulose within natural products is partly a consequence of the molecular attributes and their phase behavior. Surface composition vs. pulping conditions The surface chemical composition of fibers can be expected to change dramatically in response to different pulping methods. At one extreme, lignin-rich fiber surfaces can be expected to result from certain thermomechanical (TMP) pulping conditions. Temperatures during the TMP process often exceed the glass transition point of lignin, which can be as low as 80 to 115 oC under the wet, pressurized conditions of refining (Back and Salmén 1982; Salmén et al. 1985). As a consequence, the fibers typically separate from each other within the lignin-rich phase, which results in a relatively noncompliant, hydrophobic crust on the fiber surfaces after cooling. The surfaces of highyield pulps tend to be enriched with respect to lignin and extractives (Kleen et al. 2003; Koljonen et al. 2004). Methods for comparing the relative coverage of pulp fibers by extractives and lignin, mainly relying on X-ray photoelectron spectroscopy, have been critically compared (Fardim et al. 2006). Various consequences of natural resins and their decomposition products in various wood pulps have been reviewed (Back and Allen 2000). At the other extreme, chemical pulping methods, such as the kraft process (Smook 1992), usually are designed to remove lignin from wood and to avoid solubilizing the polysaccharide component. As a consequence, one can expect a higher proportion of hydrophilic components at the resulting fiber surfaces (Suurnäkki et al. 1996), as well as more compliant surfaces in the wet state. However, the degree of selectivity of different pulping and bleaching agents varies over a wide range, and significant amounts of lignin and extractives still may be present on the fiber surfaces in some cases. Stenius and Laine (1994) used X-ray photoelectron spectroscopy (XPS) to demonstrate progressive reductions in surface lignin during kraft pulping. Sjöberg et al. (2004) observed that bleaching treatments had their greatest effects on the surface layers of fibers, preferentially removing lignin from fiber surfaces. Fardim and Duran (2005) carried out. Hubbe and Rojas (2008). “Colloidal stability of cellulosics,” BioResources 3(4), 1419-1491. 1422.
(5) REVIEW ARTICLE. bioresources.com. related work, using infra-red spectroscopy and analysis of wetting behavior, showing the consequences of surface composition on surface free energy. Shen and Parker (1999) compared different pulping sequences; the kraft process yielded higher surface levels of lignin and extractives, compared to equal delignification degrees achieved by soda pulping or by neutral sulfite semichemical (NSSC) pulping. Laine et al. (2004) showed that different bleaching strategies tend to impart differing levels of negative charge to fibers, and such differences can be highly correlated to the demand for cationic additives, including hydrophobic sizing agents used in the papermaking process. Surface composition vs. de-waxing and de-resination Preparation methods also can be expected to affect the surface composition of non-wood cellulosic materials. Cotton in its natural state consists mainly of cellulose. However, as shown by Ribitsch et al. (2001), cotton’s surface can be made much more hydrophilic by removal of waxy material. Possible methods to clean cotton’s surface include rinsing in boiling NaOH solution, enzyme treatment, solvent extraction, and oxidative bleaching (Stana-Kleinschek and Ribitsch 1998). OH groups at the wetted fiber surface The bound OH group can be regarded as being the most predominant functional group at the surfaces of pure cellulosic materials. As noted already, even in the presence of water, a majority of such groups already can be expected to be involved in hydrogen bonding to adjacent groups either within the same molecule or in adjacent chains. Molecular dynamics simulations (Bergenstrahle et al. 2008) predict that contact with a water phase will result in only a limited change in the proportions of inter-molecular, intra-molecular, and outwardly directed hydrogen bonding, which is further limited to just the outermost layer of cellulose molecules (Heiner et al. 1998; Heiner and Teleman 1997). Experimental evidence of such interactions is shown in NMR work by Newman and Davidson (2004). Recent work by Kocherbitov et al. (2008) shows that the adsorption of water onto cellulose is dominated by placement of water molecules between rather than onto cellulosic fibrillar surfaces. This finding reinforces the importance of the three-dimensional nature of cellulose and the tendency of water to affect the bulk properties of the material. Compared to water that is further away from the cellulose surface, the interaction between cellulose and the first molecular layer of water is stronger. Evidence suggests that the term “cellulose hydrate” may be appropriate (see Joubert et al. 1959; Gert 1996). For instance, Kocherbitov et al. (2008) showed that the interaction between the initial water and dry cellulose is strongly exothermic. Joubert et al. (1959) suggested the term “hydrate” because the first 12% of water imbibed by a cellulose film did not affect its contact angle with water. A further reason for thinking of cellulose as a hydrate is that it is seldom truly dry; under moderate conditions of humidity, cellulosic fibers can be expected to contain about 6 to 8% moisture, by mass. This is roughly equivalent to one water molecule per glucopyranose unit. Watanabe et al. (2006) applied principal component analysis to near-infra-red spectroscopy data; they showed that the first 3-7% of “adsorbed” water, based on the mass of solid, immediately becomes involved with development of the hydrogen bonded structure of cellulose. Furthermore, when cellulose. Hubbe and Rojas (2008). “Colloidal stability of cellulosics,” BioResources 3(4), 1419-1491. 1423.
(6) REVIEW ARTICLE. bioresources.com. fibers are suspended in water, some of the water closest to the surface does not have a freezing point (Deodhar and Luner 1980; Weise et al. 1996). The effect is sufficiently pronounced that it can be used to estimate the predominant pore size of nanoporous materials (Park et al. 2006; Hubbe et al. 2007a). Indeed, nuclear magnetic resonance results (Li et al. 1992) suggest that the water molecules closest to cellulose have a reorientation rate that is about 25 times slower than that of bulk water. According to Bellissent-Funel (2002), interfacial water adjacent to a hydrophilic surface can resemble super-cooled bulk water, which is characterized by unusually long-range correlations between the locations of neighboring molecules. Ionic Groups: Surface vs. Total Charge Unmodified cellulose surfaces usually can be described as weakly acidic in the Lowry-Brønsted sense (Pearson 1969). This means that if the pH of an aqueous solution is high enough, the cellulosic material can release protons and acquire a net negative charge. Carboxylic acid groups having various dissociation constants can be due to the presence of hemicelluloses, extractives, lignin and its byproducts, and various products of oxidation, especially in the case of bleached cellulosic products. Purified cellulose has a much lower acid content compared to other typical cellulosic material (Herrington and Petzold 1992; Lloyd and Horne 1993). Polysaccharide-bound hydroxyl groups, though they do not significantly release protons in the pH range up to about 12, still may allow the surface of relatively pure cellulose to be classified as acidic (Simoncic et al. 2008). Charged groups at the “surfaces” of cellulosic materials in aqueous solution appear to be located in three-dimensional regions, rather than in planar surface layers (Chen et al. 2004). Evidence in support of this assertion comes, for instance, from discontinuities in potentiometric titration curves (Fernandez Diniz 1995). This author showed that fibers still contained a substantial amount of titratable charge even after their surfaces had been derivatized to convert the carboxylic acid groups to a neutral species. Further supporting evidence comes from the fact that the measured streaming potential of cellulosic fibers, to which a suitable amount of high-mass, high-charge cationic polymer has been added, can be changed from positive to negative by addition of salt (Hubbe et al. 2007a). The effect has been attributed to the fact that, in the absence of salt, double layers do not have sufficient space in which to form within the cell walls of fibers, whereas the double layer thickness can be greatly decreased by salt addition. At increased ionic strength, the surfaces within the nanopore structure of cellulosic fibers can be expected to make a significant contribution to the measured streaming potential. Such a contribution to the signal can have striking results in cases where the molecular size of charged additives is too large to allow significant penetration into the cell wall during the time allowed for testing. Depending on the conditions of processing, it is possible to prepare cellulosic fibers having a higher proportion of charged groups on their outer surfaces. For instance, Barzyk et al. (1997) carboxymethylated cellulose fibers under non-swelling conditions. In the case of fibers that had been dried from a water suspension, subsequent tests showed that the resulting charged groups tended to be located towards the outer surfaces. These results imply that closure of pores in the cellulose during ordinary drying inhibited access by the reagent. By contrast, treatment of fibers that had been dried from a solvent. Hubbe and Rojas (2008). “Colloidal stability of cellulosics,” BioResources 3(4), 1419-1491. 1424.
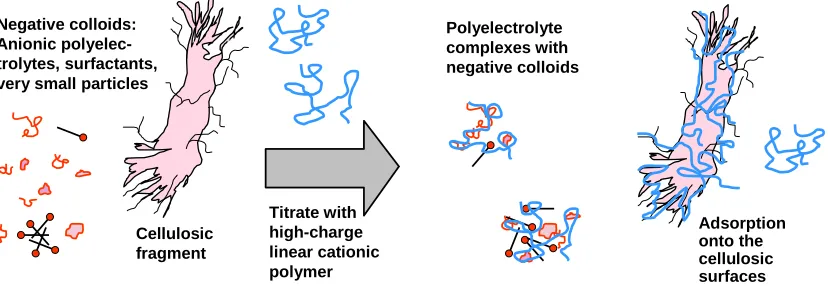
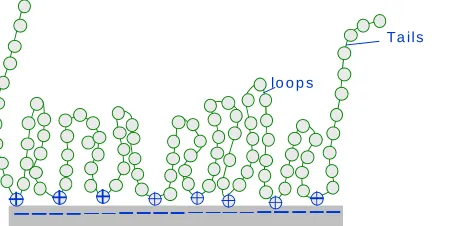
(7) bioresources.com. REVIEW ARTICLE. suspension, preventing closure of the pores in the cell wall, resulted in a more uniform distribution of charge throughout the cell walls of the fibers. Charge of the outer surface The extent of ionization at wetted cellulosic surfaces can be evaluated in various ways, and understandably, the results often depend on the method that has been selected (Hubbe 2000a; Fardim and Holmbom 2005). For instance, polyelectrolytes can be used to titrate colloidal charge, especially under circumstances that justify an assumption of one-to-one stoichiometry of polyelectrolyte charged groups with surface-bound ionized groups. Briefly stated, such one-to-one stoichiometry can be approached in systems where the ionic strength is low, where the surface charge density is sufficiently high to allow a strong affinity with an oppositely charged polyelectrolyte, and where the definition of “surface” is defined by the penetration ability of the polyelectrolyte being used in the analysis. As suggested by Fig. 2, polyelectrolytes of high charge density usually are used in this type of analysis in order to favor strong, essentially irreversible complexation with outer surface groups. In typical industrial samples of cellulosic materials in aqueous suspension the titrant is assumed not only to interact with surfacebound ionic groups, but also with colloidal materials, dissolved polyelectrolytes, charged surfactants, and colloidal-sized particles. Mocchiutti and Zanuttini (2005) have provided an elegant formula by which to avoid over-estimating fiber surface charge. Overestimation is expected to become increasingly likely as titration progresses, due to a tendency for polyelectrolytes to adsorb with more loops and tails extending out from the surface as one approaches the limit of the maximum adsorbed amount.. Negative colloids: Anionic polyelectrolytes, surfactants, very small particles. Cellulosic fragment. Polyelectrolyte complexes with negative colloids. Titrate with high-charge linear cationic polymer. Adsorption onto the cellulosic surfaces. Fig. 2. Schematic representation polyelectrolyte titration of aqueous sample that contains not only cellulosic surfaces, but also negatively charged colloidal matter, such as anionic surfactant molecules, polyelectrolytes, and very small particles. Higher amounts of adsorbed polyelectrolyte often coincide with decreasing molecular mass in the case of porous substrates (Hostetler and Swanson 1974; Wågberg et al. 1989; Wågberg and Ödberg 1989; Gruber et al. 1996; Alince and van de Ven 1997; Horvath et al. 2006). Such results have been interpreted by saying that the smaller molecules are better able to penetrate materials having a range of pore size. Wågberg et. Hubbe and Rojas (2008). “Colloidal stability of cellulosics,” BioResources 3(4), 1419-1491. 1425.
(8) REVIEW ARTICLE. bioresources.com. al. (1989) used such differences to determine an effective “surface charge,” based on titrations with poly-diallyldimethylammonium chloride (poly-DADMAC) having a mass of about a million Daltons. By contrast an effective “total charge” has been defined by the results of titration with a much lower-mass cationic polyelectrolyte. The results of titrations with a suitably low-molecular-mass cationic polyelectrolyte agreed with results of charge determinations based on acid-base titrations (Wågberg and Ödberg 1989). Such results suggest that sufficiently low-mass cationic polyelectrolytes can diffuse into essentially all of the pore spaces within cellulosic fibers. Polyelectrolyte titration with streaming current endpoint For practical applications, one of the most popular methods for determining the endpoint of a polyelectrolyte titration involves a loosely-fitted plastic piston reciprocating within a plastic cylinder (Gerdes 1966), i.e. the streaming current titration method. To carry out such an analysis, one has to make the implicit assumption that the plastic surfaces adsorb colloidal material from the solution to which they are exposed and that the net charge of the plastic surfaces in the annular region indicates the sign of colloidal charge of the system as a whole. This method has been widely used for evaluation of the charge demand of paper machine systems (Kenaga et al. 1967; Lafaye and Jacquelin 1968; Davison and Cates 1975; Beck et al. 1987; Lindström 1991; Bley 1992; Bley and Kästner 1992; Ojala 1993; Patton and Lee 1993; Baumgartner and Bley 1994; Carrasco et al. 1996; Petzold et al. 1997; Bischoff 1997; Thiele and Kopp 1997; Phipps 1999; Mutje et al. 2001; Chen et al. 2001; Pruszynski and Jakubowksi 2002; Rice and Roeraade 2003; Koljonen et al 2004; Hubbe and Chen 2004; Yoon 2007). Jaycock (1995) criticized the streaming current method due to (a) reasonable doubts that the plastic surface charge necessarily matches that of the colloidal system to which it is exposed, (b) the likelihood that results are affected by remnants of adsorbed polyelectrolytes from a previous test, and (c) the non-ideality of the flow conditions within the annulus. However, as a practical tool, the streaming current titration method has gained wide acceptance. Color endpoint An alternative way to detect the endpoint of a polyelectrolyte titration involves a charge-induced shift in the hue of a suitable dye, such as toluidine blue (Terayama 1952; Halabisky 1977; Hubbe 1979; Springer and Taggart 1986; Schempp 1988; St. John and Gallagher 1992; Stenius and Laine 1994). The color shift does not proceed to a significant extent until an excess of the polyelectrolyte that is opposite in charge to the dye is present in the solution. The procedure rests on an assumption that the interaction between the dye and one of the polyelectrolytes is significantly weaker than the interaction between two oppositely charge polyelectrolytes used in the analysis. Difficulties with the procedure can be expected in the presence of colored materials, increasing salt concentrations, and aluminum compounds (Hubbe 1979; St. John and Gallagher 1992). However, results of such titrations have been used successfully for many years for optimization of paper machine system charge.. Hubbe and Rojas (2008). “Colloidal stability of cellulosics,” BioResources 3(4), 1419-1491. 1426.
(9) REVIEW ARTICLE. bioresources.com. Other ways to quantify charge of cellulosic surfaces Alternatively, the surface charge can be estimated by the adsorption of charged dye molecules, based on an assumed one-to-one charge interaction (Oertel et al. 1991; Fardim and Holmbom 2003, 2005). van de Ven et al. (2007) showed that the charge character of fiber suspensions can be evaluated by direct adsorption of toluidine blue dye. High-yield pulp surfaces appear to adsorb dye both due to their hydrophobic character (related to lignin and extractives content) and due to their negative charge. Kraft pulps appear to adsorb the dye through a simple ion-exchange mechanism, consistent with the idea of using the dye for titrations of surface charge. Mathews et al. (2004) carried this approach a step further, using the stained appearance of single fibers, after exposure to a dye solution, as an indication of their surface charge density. Tanaka et al. (2000) showed that it even is possible to use a colored derivative of poly-DADMAC as a means of quickly determining how much of the polymer can be taken up by cellulosic material in suspension. Colorimetric analysis of the filtrate, relative to a blank determination, was used to estimate adsorbed charge Jacob and Berg (1993) demonstrated a highly unique strategy for endpoint detection during polyelectrolyte titrations, showing that wettability can be used as an indication of the degree of neutralization. The logic behind this approach is that surfaces having a net ionic charge can be expected to have a stronger interaction with water, compared to a charged surface to which an equal and opposite amount of polyelectrolyte charge has been added. Potentiometric titrations Titrations with strong acid or strong base can be used for analysis of charge in cases where essentially all of the surface-bound ionizable groups consist of weak acids or weak bases. In principle, one can evaluate the amount of strong acid or base that becomes consumed in converting, say, a weak acid to its conjugate base, or vice-versa. Because the OH- and H3O+ ions are very small and highly mobile in an aqueous solution, it is reasonable to expect significant contributions from ionizable groups deep within very small pores. Titrations can be carried out either by observing the pH or by observing conductivity changes, usually during the addition of NaOH (Katz et al. 1984). Potentiometric titrations of cellulosic fibers in suspension have demonstrated the presence of weak acidic groups (Herrington and Midmore 1984a-c; Beck et al. 1987; Budd and Herrington 1989; Herrington and Petzold 1992; Laine et al. 1994; Stenius and Laine 1994; Fernandez Diniz 1995; Laine 1997; Räsänen and Stenius 1997; Bygrave and Englezos 1998; Räsänen et al. 2001; Lindgren et al. 2000, 2002). Laine and coworkers showed that titration data for kraft pulp could be best fitted by assuming the existence of two types of carboxyl groups (Laine et al. 1994; Stenius and Laine 1994). The stronger of these two acid functions, having a fitted pKa value of 3.4, was attributed to the uronic acid groups of xylan hemicellulose. Somewhat weaker acids, having a fitted pKa value of about 5.5, were attributed to lignin-bound carboxylic acid species. More recent studies have achieved similar results (Lindgren et al. 2001, 2002).. Hubbe and Rojas (2008). “Colloidal stability of cellulosics,” BioResources 3(4), 1419-1491. 1427.
(10) REVIEW ARTICLE. bioresources.com. DISPERSION FORCES Regardless of ionic charge, there exist substantial short-range interactive forces between all forms of matter, arising from the seemingly random motions of electrons (Visser 1972, 1995; Bowen and Jenner 1995). van der Waals (1910) found early evidence for such forces, consisting of deviations from the ideal gas law. Thus, even the noble gases, which lack chemical reactivity, are attracted to each other, making it possible to condense them into liquids at sufficiently low temperature. The dispersion component of the van der Waals forces is of particular importance to interactions between colloidal particles in suspension. As a first approximation, the van der Waals interactions between two macroscopic particles or bodies can be calculated by adding (using integration) the interactions between all molecular pairs between the two bodies (Hamaker 1937). The result of such integration shows that the distance dependence of the van der Waals force between macroscopic surfaces is much weaker than that between molecules, i.e., the interaction is more long-ranged. Furthermore, the numerical integration used to compute the strength of interaction between solids, due to the dispersion contributions, requires the detailed geometry of the facing surfaces to be known. This geometry usually is assumed as an equivalent “sphere-plane” or “two planes” model of interaction. Other factors determining the strength of dispersion forces are the distances of separation, the nature of the suspending medium, if any, and a constant A, which is known as the Hamaker constant, which depends on the electrical polarizabilities of the materials in question. To give an example, Eq. (1) estimates the dispersion component of force for the “sphere-plane” model of interaction (Visser 1972), Fdisp = (A/6) R { (1/x2) + 1/(x + 2R)2 – 1/[x (x + 2R)]}. (1). where R is to be regarded usually as an effective radius, representing the interaction between non-ideal surfaces, and x is the minimum distance between the sphere and the plane. The Hamaker method explained above is conceptually easy but unfortunately not very accurate. There are several reasons for the inaccuracy: The method neglects manybody interactions, entropic contributions, and other factors. It is also not very easy to accurately account for the presence of the medium separating the two interacting particles. All these effects are considered in an alternative treatment due to Lifshitz et al. (see Dzyaloshinskii et al. 1961). Here the interacting particles and the intervening medium are treated as continuous phases, and the interaction is viewed as originating from interference between fluctuating electromagnetic fields extending beyond the surfaces of the particles. The expressions for the interaction energy between bodies of a specific shape have the same functional form as in the Hamaker treatment, but the equivalent to the Hamaker constant A is a function of the frequency-dependent bulk dielectric properties of the continuous phases. Rather accurate approximate equations to the Lifshitz expression are often used for calculating the Hamaker constant (see Israelachvili 1992; Fröberg et al. 1999).. Hubbe and Rojas (2008). “Colloidal stability of cellulosics,” BioResources 3(4), 1419-1491. 1428.
(11) REVIEW ARTICLE. bioresources.com. An implicit assumption so far is that the Hamaker constant is not affected by the separation between the particles, i.e., the distance over which the electric fields have to travel between the interacting surfaces. However, this is not correct at large antiparticle separations. In this case the time needed for the electric field emanating from one body to travel to the other body and to be reflected back again becomes comparable to the period of the fluctuations that generate the field. Thus the phase correlation between the fields emanating from the two bodies will be diminished, and the interaction will be weakened. This phenomenon, called retardation, becomes important at separations larger than about 5 nm, and can be taken care of within the framework of the Lifshitz theory, e.g., as described by Mahanty and Ninham (1976). Relative to their importance, surprisingly little research has been devoted to the evaluation of dispersion forces involving cellulosic materials. Most notably, Bergström et al. (1999) evaluated the Hamaker constant for cellulose. They based their estimates on macroscopic observations of the dispersion of light, using ellipsometry. The Hamaker constant for regenerated cellulose phases interacting with each other in air was determined to be 58 x 10-21 J. When immersed in an aqueous phase, the corresponding Hamaker constant was reduced to 8.0 x 10⁻²¹ J. Related work for ethylcellulose films was carried out by Oh and Luner (1999). Another approach for determining the strength of dispersion force contributions to interactions at surfaces involves evaluation of contact angles of test liquids. For instance Tze et al. (2006) used such an approach to find out how the dispersion component of interactive forces was affected by various chemical derivatizations of the cellulose surface. Notably, various silane-related treatments decreased the dispersion component of surface free energy from a γd value of 24.3 mJ/m2 (mNm-1) to a range between 15.6 and 17.8 mJ/m2. A cellulose surface that had been grafted with styrene-maleic anhydride (SMA), also had a γd value of 15.6 mJ/m2. As noted by Pelton (1993), the fibrillated surfaces of many cellulosic surfaces can be expected to pose profound challenges when one attempts to calculate the contributions of dispersion forces. The predicted attractive forces that one obtains, when using a conventional sphere-plane or two-planes model of the contact region between a pair of cellulosic surfaces, etc., are far too high, relative to practical observations. Coagulation of cellulosic suspensions by means of charge reduction or by adding relatively high concentrations of monomeric ions is known to yield relatively weak structures that are easily redispersed by hydrodynamic shear. Pelton attributed this discrepancy between the calculations and the observations by proposing that hydrated fibrillar elements, including structures down to the macromolecular level, extend outwards from typical cellulosic materials, so that it does not make any sense to carry out calculations based on a model of planar surfaces. In fact, the first reported measurements of interactions between cellulose surfaces were interpreted with reference to “dangling tails” of cellulose fibrils extending out from the surface (Neuman et al. 1993). Another issue that deserves more attention in the future is the effect of the waterswollen and nanoporous nature of wetted cellulosic materials on dispersion force interactions. For example, the measurements by Neuman noted above was only partly successful because of the large swelling of their cellulose surfaces, thus giving rise to long-range steric forces. As a first approximation it makes sense to employ a linear. Hubbe and Rojas (2008). “Colloidal stability of cellulosics,” BioResources 3(4), 1419-1491. 1429.
(12) REVIEW ARTICLE. bioresources.com. combination of the Hamaker constants for cellulose and for water, depending on the relative amounts of each of these substances at the outermost surfaces of the interacting phases.. IONIC DOUBLE LAYERS As was noted earlier, the unmodified surfaces of cellulosic materials can be expected to develop a net negative charge when exposed to aqueous solution in the absence of strongly adsorbing cationic species. It is well known that such charged surfaces will attract an equal amount of oppositely charged “counter-ions,” which will be present in the solution adjacent to the surface. These counter-ions are in excess of what would be expected in the bulk aqueous solution. The relative distances of the excess ions, on average, from a charged surface have been the subject of extensive investigation and modeling. To a first approximation it is useful to divide the distribution into two parts, a condensed part and a diffuse part (Verwey and Overbeek 1948; Hiemenz and Rajagopalan 1997). Ions present in the condensed part of the double layer are regarded is being in physical contact with the surface, consistent with their ionic radius. The time-averaged location of counter-ions in the diffuse part of the double layer is governed by interplay between electrostatic attraction and the tendency of such ions to diffuse in all directions due to their thermal energy. The results of this interplay can be described as an “atmosphere” of excess charge, in which the concentration of excess charge falls off exponentially with distance from the surface. In the diffuse layer the ions are only affected by electrostatic forces, and in this region it is straightforward, using a mean field approach such as the Poisson Boltzmann (PB) model, to calculate the concentration of counter-ions as a function of distance from the surface. The degree of extension of the diffuse layer out from the surface will depend on the surface charge density, the bulk ion concentrations, and valencies of the ions present. A central quantity in this respect is the Debye length κ -1, which describes the rate with which the mean potential decays away from the surface. The Debye-length decreases with increasing ionic strength, but it is independent of the surface charge density and surface potential. The Debye length κ -1 can be calculated from the following equation, ⎛ εε k T ⎞ 0 B ⎟ =⎜ ⎜ κ ⎝ ∑i ( zi e )2 ni ⎟⎠ 1. (2). where zi is the valence of the ion “i”, ni is its concentration (bulk number density) in consistent units, e is the elementary electron charge, ε0 is the permittivity of vacuum, ε is the dielectric constant of the medium, kT is Botzmann’s constant, and T is the absolute temperature. Electrostatic double-layer forces between two surfaces immersed in aqueous solution arise when the two surfaces come close enough for their diffuse layers to start to. Hubbe and Rojas (2008). “Colloidal stability of cellulosics,” BioResources 3(4), 1419-1491. 1430.
(13) REVIEW ARTICLE. bioresources.com. overlap, giving rise to an osmotic pressure. The resulting force can be calculated only in the case of relatively simple, known geometries. For instance Eq. (3) gives the approximate electrostatic force between a sphere of radius R and a plane surface at a distance x having respectively low electrical potentials ψ, under the assumption that the potentials do not change during the interaction (Hogg et al. 1966). Felec = - πRεκ cosech {(κx) [2 ψ1 ψ2 – (ψ12 + ψ22) exp(-κx)]}. (3). In this expression ε is the dielectric constant, and κ is the Debye-Hückel reciprocal length parameter. The reader is referred to the review by Fröberg et al. (1999) for more detailed and extensive explanations. Zeta Potential As mentioned before, the electrostatic forces between surfaces suspended in aqueous solution arise due to the overlap of ionic double layers at adjacent surfaces. As a first step in estimating the magnitudes and dependencies of these forces it is common practice to evaluate the zeta potential ζ. The zeta potential can be described as the electrical potential at a hypothetical “slip plane” adjacent to a charged surface. The slip plane represents the demarcation between ions that act as if they are part of the solid surface, versus those which act as if they are part of the bulk aqueous phase. Methods for evaluating zeta potential and related parameters have been summarized elsewhere (Biefer and Mason 1954; Sennett and Olivier 1965; Britt and Unbehend 1974; Lindström 1996; Hunter 1981; Poppel 1992). Electrophoretic mobility From a theoretical and practical standpoint (Jaycock 1985; Schempp 1988; Strazdins 1995) microelectrophoresis is the best-established method of determining the zeta potential of cellulosic materials that are smaller than about 100 μm. In its classical form, a microelectrophoresis test is carried out in a capillary cell. A direct-current voltage is applied by means of electrodes in two chambers connected to the capillary. For non-conducting particles the speed of migration in the applied field is proportional to the average electrical potential at the hydrodynamic slip plane, i.e. the zeta potential. The purpose of using a capillary cell is to suppress eddies of flow. However, in order to properly evaluate zeta potential, it is necessary to focus a microscope and visualize particles in at a specific location within the capillary that is known as the stationary layer. The reason for this procedure is that application of a voltage across a length of a glass or quartz capillary generally results in an electro-osmotic effect; counter-ions in the diffuse part of the double layers adjacent to the glass or quartz surfaces are attracted by the applied electric field, and the motion of such ions causes a net motion of the surrounding liquid adjacent to the capillary wall. In a properly sealed microelectrophoresis apparatus the resulting counter-flow of fluid can be accurately predicted, and it is relatively easy to calculate the locations where the net effect of electro-osmotic flow will be zero. Problems of eddy flow also can be overcome by use of automated laser-optical measurement systems; in such systems the period of application of the electric field is kept sufficiently brief that eddy flows do not have time to develop.. Hubbe and Rojas (2008). “Colloidal stability of cellulosics,” BioResources 3(4), 1419-1491. 1431.
(14) REVIEW ARTICLE. bioresources.com. As noted by Strazdins (1995), application of the micro-electrophoresis method for analysis and control of fiber suspensions used in papermaking rests upon an assumption that fine particles obtained by screening of fiber suspension (i.e. “white water) is representative of the charge behavior of all of the surfaces in the suspension. Though it is reasonable to expect some deviations from this assumption, depending on the circumstances, the results of micro-electrophoresis tests often correlate well with dewatering rates, fine-particle retention, and other parameters of interest to papermakers (Davison and Cates 1975; Strazdins 1977, 1989, 1994, 1995). By means of laser-Doppler technology it has been feasible to obtain detailed distributions of zeta potential in populations of particles. Results of studies using this approach have had important implications for the manufacture of paper (Sanders and Schaefer 1989, 1992, 1994, 1995; Sanders 1994). For instance, such results have revealed bi-modal and poly-modal distributions of zeta potential among populations of suspended particles. Prolonged hydrodynamic shearing, along with the passage of time, tend to gradually make the suspended particles more uniform with respect to zeta potential (Sanders 1994). This effect has been attributed to gradual redistribution of colloidal materials onto the surfaces of the suspended particles, which can include both cellulosic fine particles and calcium carbonate, along with various ionic and polymeric additives to the papermaking process. Streaming potential Streaming potential tests have had a long history of applications for study of cellulosic materials (Briggs 1928; Neale 1946; Goring and Mason 1950a,b; Biefer and Mason 1954; Ghosh and Pal 1961; Chang and Robertson 1967a,b; Hoffmann et al. 1975; Sack 1976; Penniman 1992; Hand et al. 1993; Rohloff and Höschle 1993; Sack et al. 1993; Sanders and Schaefer 1994; Jacobasch et al. 1995; Jaycock 1995; Stana-Kleinschek et al. 1995; Miyanishi 1995a,b; Miyanishi and Montegi 1996; Miyanishi and Shigeru 1997; Thiele and Kopp 1997; Ribitsch et al. 2001; Wang and Hubbe 2001; Hubbe and Wang 2004; Hubbe et al. 2007a). Various authors have reported progress with automated applications of streaming potential measurements for purposes of process monitoring and control (Sack 1976; Sack et al. 1993; Hand et al. 1993; Rohloff and Höschle 1993; Sanders and Schaefer 1994; Miyanishi and Shigeru 1997; Hubbe 1999; Hubbe 2001b) The use of streaming potential tests has not yet become widespread in industrial applications. A likely explanation has been proposed (Hubbe et al. 2007a), based on the nanoporous nature of cellulosic fibers. It was found that when streaming potential tests were carried out at levels of salt typical of papermaking operations, the results were greatly affected by the charged condition of the interior spaces within the fibers. This is undesirable from a process control perspective, since the surfaces inside the nanoporous structure of fibers are not expected to have much effect on retention and drainage operations, and it is unlikely that most polymeric additives used in papermaking will be able to diffuse to a significant extent into such pores within the available time. The most striking results were obtained when testing fiber slurry samples to which cationic polyelectrolyte had been added. In certain cases even the sign of streaming potential could be reversed repeatedly just by varying the salt concentration of the suspending medium.. Hubbe and Rojas (2008). “Colloidal stability of cellulosics,” BioResources 3(4), 1419-1491. 1432.
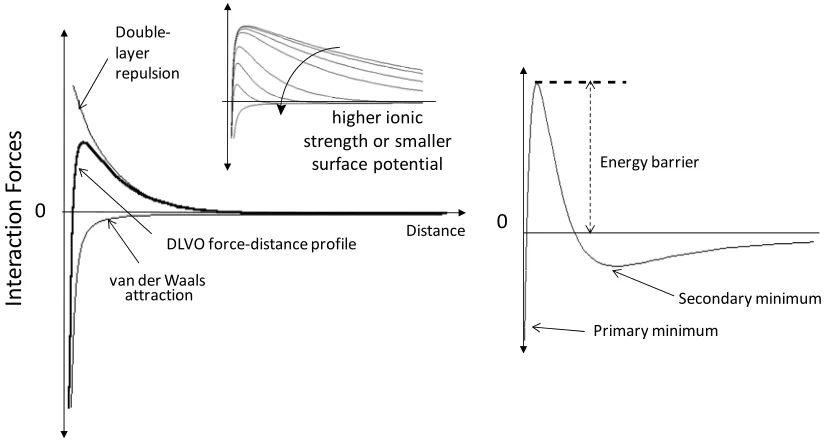
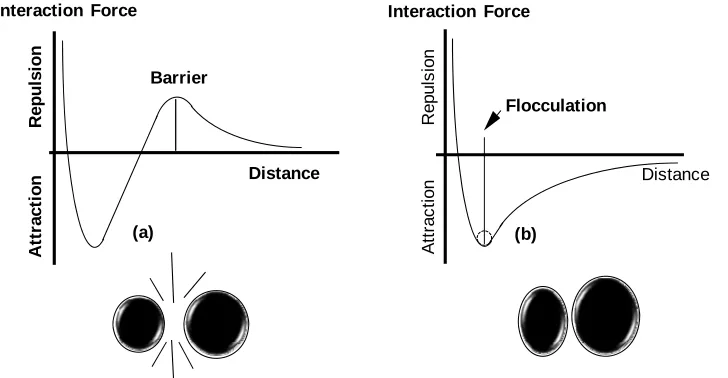
(15) REVIEW ARTICLE. bioresources.com. An explanation for the observed effect is that, in the presence of a suitable concentration of electrolyte, the thickness of ionic double layers is sufficiently small so that double-layer effects can be observed within the nanopores. Thus, if one wants to obtain an accurate indication of just the charged condition of the outer surface of cellulosic fibers, the suspending solution should be replaced with deionized water. This procedure effectively “turns off” the contribution to the electrokinetic signal that originates within the very fine pores. Indeed, when practical tests of dewatering rates and fine-particle retention were carried out in this way (Hubbe et al. 2007a), there was good agreement between the measured streaming potential and the expected trends in retention and drainage. The most rapid dewatering was observed when the streaming potential tests in the absence of salt indicated that a sufficient amount of high-charge cationic polymer had been added to neutralize the system. Also, there was an equal retention of positive and negative probe particles when the streaming potential tests carried out in the absence of salt indicated a neutral charge on the fiber surfaces. No such agreement was obtained when the streaming potential tests were carried out in the presence of sufficient sodium sulfate to raise the electrical conductivity to 1000 µS/cm. Another factor that affects the results of zeta potential and streaming potential tests is the conductivity of fiber surfaces (see Scallan 1989; van de Ven 1999). Although pure cellulose can be considered to be an insulating material, the ionic double-layers associated with cellulosic surfaces can be expected to conduct electricity in the presence of an electrical field. Effects of surface conductance on the results of zeta potential tests can be expected to become increasingly significant as the ionic strength becomes low, and as the counter-ions adjacent to surfaces comprise an ever-greater proportion of the movable ions in the system. Colloidal Forces A discussion of colloidal forces must consider the DLVO theory of Derjaguin and Landau (1941) and Verwey and Overbeek (1948), which was briefly mentioned before. DLVO interaction forces are determined as the total, additive contributions from the van der Waals and the double layer interactions. As stated above, usually the van der Waals interactions are attractive, whereas the double-layer interactions often are repulsive. Also, the van der Waals contribution is dominant at small surface separation, while the double-layer contribution gives rise to a net force barrier at larger separations, as illustrated in Fig. 3 (left). The insert in this figure illustrates that increasing the ionic strength or lowering the surface potential results in a lower energy maximum. The righthand frame of Fig. 3 represents a system with a strong van der Waals attraction and moderate double-layer repulsion, resulting in the existence of a secondary minimum at relatively large interparticle distances. Just considering the DLVO-forces, one may obtain different force-distance profiles, including those representing kinetically stable, weakly flocculated or coagulated systems. Further, by increasing the ionic strength one may go from a kinetically stable colloidal dispersion to one that is coagulated. An explanation of these aggregation states is included below.. Hubbe and Rojas (2008). “Colloidal stability of cellulosics,” BioResources 3(4), 1419-1491. 1433.
(16) bioresources.com. REVIEW ARTICLE. Interaction Forces. Double‐ layer repulsion. higher ionic strength or smaller surface potential. 0 DLVO force‐distance profile van der Waals attraction. Distance. Energy barrier. 0. Secondary minimum Primary minimum. Fig. 3. Forms of typical functions of interactive free energy vs. separation distance, as determined by contributions from attractive van der Waals energy and electrostatic double layer energy contributions. Inset (left): Effect of increased electrolyte concentration on net energy of interaction. Right: Illustration of common calculated result, predicting a secondary minimum in net interactive free energy.. The reader is referred to the review of Fröberg et al. (1999), in which some calculated DLVO profiles are presented for various aqueous electrolyte concentrations and surface potentials (using non-retarded Hamaker constants). Remarkably, in simple systems DLVO calculations fit experimental data that have been made available only very recently. Most of the reported experimental systems have been developed using very smooth surfaces that allow measuring the net interactive force as a function of very small separation distances (Israelachvili and McGuiggan 1990; Holmberg et al. 1997a,b; Fröberg et al. 1999; Österberg 2000; Claesson and Rutland 2001). The ultra-smooth surfaces of freshly cleaved mica have been particularly favored by investigators for such fundamental work (see, for instance Rojas et al. 1998). To extend similar methods to studies of cellulose’s colloidal interactions, a key challenge has been to prepare very smooth cellulosic films, and several approaches for the preparation of such films have been developed (Holmberg et al. 1997a,b; Rojas et al. 2000; Kontturi et al. 2006; Turon et al. 2008). Using a surface force apparatus to measure interaction forces between regenerated cellulose surfaces, Neuman et al. (1993) observed non-DLVO forces; specifically electrosteric forces brought about by small dangling cellulose fibrils on the surfaces gave rise to steric contributions. These macromolecular chains contributed to the repulsion forces at separation distances as large as 100 nm. More recently, Holmberg et al. (1997a) surprisingly observed no evidence of double-layer repulsion between smooth, pure cellulose surfaces at pH = 6; they concluded that the surfaces were essentially uncharged under the conditions of testing. In contrast, Poptoshev et al. (2000) observed weak electrostatic repulsion in a related experiment, and they showed that the negative charge. Hubbe and Rojas (2008). “Colloidal stability of cellulosics,” BioResources 3(4), 1419-1491. 1434.
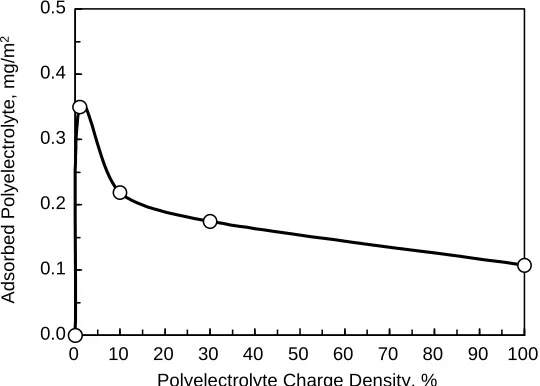
(17) REVIEW ARTICLE. bioresources.com. of the cellulose could be neutralized with a low level of cationic polyelectrolyte addition. Österberg (2000) showed the effects of exposing very smooth cellulosic surfaces to different amounts of cationic polyelectrolytes. Net adhesive forces were observed at low levels of coverage and short exposure times, consistent with charged patch and bridging mechanisms. At higher levels of coverage and longer adsorption times the net forces tended to become repulsive, consistent with like-charge repulsion and steric stabilization. Less quantitative, but still very revealing analyses have been achieved by atomic force microscopy (AFM) and related tests (Rojas et al. 1998; Zauscher and Klingenberg 2000a; Amelina et al. 2000; Paananen et al. 2004; Leporatti et al. 2005; Radtchenko et al. 2005; Notley et al. 2006; Notley and Norgren 2006; Stiernstedt et al. 2006a,b; Salmi et al. 2007a; Bastidas et al. 2008; Notley 2008). The term “colloidal probe microscopy” has been applied to methods in which the standard AFM stylus is replaced by a spherical probe surface. Pang and Gray (1998) observed significant repulsive forces at separation distances up to 1700 nm between fibrillated cellulose and an AFM probe, depending on the level of refining. These distances are much higher than would be expected based on the double-layer forces at planar surfaces. Rather, the results were consistent with interaction between cellulosic macromolecular strands extending outwards from the facing surfaces. Addition of salt decreased the separation distance at which the repulsion could be detected; this observation is consistent with suppression of double-layer repulsion by the dissolved salt, allowing the fibrils to lie down to a greater extent onto the fiber surface. Carambassis and Rutland (1999) and Rutland et al. (1997) found evidence of repulsive forces when seemingly smooth cellulosic spheres were within 20 nm from each other, and they attributed such forces to cellulosic chains extending outwards from the respective surfaces. Surface force measurements via AFM or surface force apparatus (SFA) are particularly useful to understand the effect of adsorbed polymers on cellulose and other model surfaces. For example, Claesson et al. (2003) and Rojas et al. (2005) studied adsorbed layers of polyelectrolytes and focused on determining the effect of the polyelectrolyte charge density on surface topography, as well as the effect of the polyelectrolyte coating on adhesion between the polymer-coated surfaces. Their data provide evidence for formation of electrostatic bridges, particularly when highly charged polyelectrolytes were used. Further, material transport between the surfaces was observed when the polyelectrolyte was either highly charged or had a very low charge density. For intermediate charge densities they did not observe any indication of material transfer. The charge density of the adsorbing polyelectrolyte is particularly important in determining the adsorbed mass on cellulose, as observed in Fig. 4. The adhesion between one polyelectrolyte-coated surface and one bare surface was initially higher than that between two polyelectrolyte-coated surfaces. However, due to material transfer between the two surfaces the adhesion decreased significantly with the number of times that the surfaces were driven into contact. For the polyelectrolytes of the lowest charge density the results suggested that entanglement effects contributed to the adhesive interaction. Such results can guide efforts to modify surface adhesion by polyelectrolytes, for example to enhance the performance of dry-strength additives aimed at improving fiber bonding and paper strength.. Hubbe and Rojas (2008). “Colloidal stability of cellulosics,” BioResources 3(4), 1419-1491. 1435.
(18) bioresources.com. REVIEW ARTICLE. Adsorbed Polyelectrolyte, mg/m2. 0.5. 0.4. 0.3. 0.2. 0.1. 0.0 0. 10. 20 30 40 50 60 70 80 Polyelectrolyte Charge Density, %. 90. 100. Fig. 4. Effect of polyelectrolyte charge density on the extension of adsorption on cellulose surfaces as measured by an XPS method developed by Rojas et al. (2005). Steric forces: A non-DLVO interaction relevant in cellulose systems High-molecular-weight polymers, which are often used in fiber processing, can affect interactive forces, thus affecting the stability of colloidal systems. Synthetic and natural polymers and their derivatives, including modified cellulose and starch, are widely used. Factors that determine the sign, range, and magnitude of polymer-induced forces include solvent-polymer interactions, surface coverage, polymer concentration, and whether the polymers adsorb reversibly or irreversibly. Forces between surfaces carrying adsorbed polymers, as commonly occur during the wet processing of cellulose fibers, can be considered by theoretical models developed by de Gennes (1987) and Fleer et al. (1993). Both systems of analysis predict that under full equilibrium conditions, i.e., when polymers are free to desorb as the surfaces approach each other, purely attractive forces are generated by homopolymers. The reason for this is that, as some polymers desorb from the surfaces, a greater fraction of the remaining polymers will attach to both surfaces and a bridging attraction will pull them towards each other. Hence, under full equilibrium conditions one does not expect steric stabilization to result from adsorption of homopolymers. The reason that homopolymers can be used as steric stabilisers is that, due to a very slow desorption, they are retained on the surface during a collision event, and the interactions are thus better described by theories for interactions between surfaces carrying irreversibly adsorbed polymers. In this case contributions are to be considered from osmotic pressure and elasticity. The osmotic contribution includes changes in ideal entropy of mixing and changes in solvation of the polymer segments. The elastic contribution can be due to a reduction of the number of possible conformations of the polymer chains at smaller surface separations. Under restricted equilibrium conditions, the second contribution always becomes increasingly repulsive as the surface separation is decreased, and it becomes dominant at sufficiently small separations. This is a more formal definition of the steric repulsive force, which is very important in the stabilization of many colloidal systems, including mineral particles in coating.. Hubbe and Rojas (2008). “Colloidal stability of cellulosics,” BioResources 3(4), 1419-1491. 1436.
(19) REVIEW ARTICLE. bioresources.com. Swelling vs. charge The degree to which aqueous solutions diffuse into the cell walls of fibers can be evaluated by solute exclusion, centrifugation, and other methods. Solute exclusion tests (Stone and Scallan 1968; Scallan and Carles 1972; Maloney et al. 1999) require the assumption that there is no significant net attraction or repulsion between certain highmass dextran molecules and the fibers. Also it is assumed that the selected dextran molecules are too big to diffuse into the pore structure, other than the fiber lumens. It follows that some water from solution will be present within pore spaces that are not accessible to the solute molecules. Thus, the concentration of the dextran in the bulk solution can be expected to be greater than what would be calculated simply from the total mass of water, solids, and dissolved dextran; this difference is used to calculate the volume of inaccessible pores in the system. A related quantity, the water retention value (WRV), is defined by the results of centrifugation tests (Thode and Ingmanson 1959; Jayme and Büttel 1968; Anon. 1981; Maloney et al. 1999; Ahrens et al. 1999). To perform such tests, researchers prepare damp plugs of their sample and run the centrifuge for a specified time and acceleration. After weighing the centrifuged damp cellulosic samples, the material is dried and weighed again. The WRV equals the ratio of water to dry mass in the centrifuged sample. According to the original interpretation, the centrifugal force is assumed mainly to remove water from between fibers, as well as from the fiber lumens. However, systematic deviations can be expected between results of solute exclusion and WRV results (Scallan and Carles 1972). In particular, work by Ström and Kunnas (1991) implies that WRV test results can be markedly affected by water that is associated with surface fibrillation, and also by chemical additives that affect surface-bound water, in addition to water in the cell wall structures. Significant decreases in swelling have been observed when water-swollen cellulosic samples were treated with high-charge cationic polyelectrolytes (Swerin et al. 1990; Ström and Kunnas 1991; Notley 2008). Such results suggest that the chemical treatment causes the fibrils to lie down on the fiber surfaces and possibly to line up to a greater degree so that less water is held between and among the fibrils. In addition, the effective sizes of nanopores in the cell wall structure appear to change as a function of how the fiber plugs are prepared, the acceleration intensity, the duration of centrifugation, etc. In general, higher negative zeta potential, which often is indicative of a higher density of anionic carboxylate groups at a cellulosic surface, has been correlated to higher degrees of swelling (Ribitsch et al. 2001). Less swelling has been observed in cellulosic samples containing hydrophobic substituent groups (Bletzinger 1943). In simple terms it is reasonable to expect that interactions with water ought to be weakened as the proportion of OH groups becomes smaller. However, such effects should not necessarily be assumed to be monotonic with increasing degree of substitution. Work by Ehrnrooth et al. (1977) showed that the first five percent of acetylation of cellulose hydroxyl groups actually can enhance the swelling of cellulose in water, and this effect was attributed to an interruption in the regularity of macromolecular structure. Such disruption, in small amounts, might decrease the proportion of surface-bound OH groups that are involved in the inter- and intra-molecular hydrogen bonding of cellulose.. Hubbe and Rojas (2008). “Colloidal stability of cellulosics,” BioResources 3(4), 1419-1491. 1437.
(20) bioresources.com. REVIEW ARTICLE. Swelling, salt, and the Donnan equilibrium To account for swelling, Scallan (1983) proposed that fibers be considered as a cross-linked polyelectrolyte gel (Northrop and Kunitz 1926; Grignon and Scallan 1980; Scallan 1983; Alince and van de Ven 1997). The term “polyelectrolyte” is justified by the fact that cellulosic material can contain a significant level of ionizable groups. The term “gel” is appropriate because although cellulose can swell, its complete dissolution is resisted by the presence of crystalline regions. Using the analogy of a sponge, the cellulosic material is assumed to stretch in an elastic manner as water is drawn into the pores by osmotic pressure. A correlation has been observed between the negative charge density and the amount of water taken up by fibers (Scallan 1983; Lindström and Carlsson 1982; Lindström 1992; Scallan and Tigerström 1992; Laine and Stenius 1997; Salmén and Berthold 1997; Ribitsch et al. 2001; Baltazar-Y-Jimenez and Bismarck 2007). The addition of salt ions generally has been shown to decrease the swelling of cellulosic materials in aqueous systems (Fält and Wågberg 2003; Tammelin et al. 2005). Scallan and Tigerström (1992) showed, by use of Donnan equilibrium theory, that the degree of swelling can be used to estimate the magnitude of elastic forces within cellulosic fibers. As is true for polyelectrolyte gels in general, the charged groups within a fiber cell wall are fixed in location (Scallan and Tigerström 1992; Freudenberg et al. 2007). Water will tend to penetrate into a charged gel material, especially if the ionic content of the water phase is low. Such an in-flow of water builds up a net pressure, which is resisted by the elastic forces within the swellable material. Stiff fibers, such as those containing substantial amounts of lignin, are expected to have greater forces resisting expansion. However, if the higher-yield fibers also have a higher density of acidic groups, their greater stiffness will need to compete against the effect of higher osmotic pressure. In the absence of salt the osmotic pressure, tending to cause swelling of a charged gel, can be predicted from. π = RT (1 + z) α cp / Mp. (4). where R is the gas constant, T is absolute temperature, z is the number of chargeable groups per polymer, α is the fraction of those groups in their ionized state, cp is the mass concentration of the polymer, and Mp is the molecular mass of the polymer (see Hiemenz and Rajagopalan 1997). The dependencies of swelling of cellulosic materials on such factors as salt concentration and pH have been found to be in good agreement with theory (Grignon and Scallan 1980). The relative increase in swelling, compared to an equivalent, uncharged gel structure, could be fit to the equation (V – Vo)/( Vc + Vo) = RT (n / V) / K. ,. (5). where V is the swollen specific volume, Vo is the specific volume in the absence of charged groups (for instance, at very low pH in the case of carboxyl groups), Vc is the specific volume of cellulose (or other solid), n is the concentration of the ionic species responsible for the swelling, and K is the effective elastic modulus of the material. Hubbe and Rojas (2008). “Colloidal stability of cellulosics,” BioResources 3(4), 1419-1491. 1438.
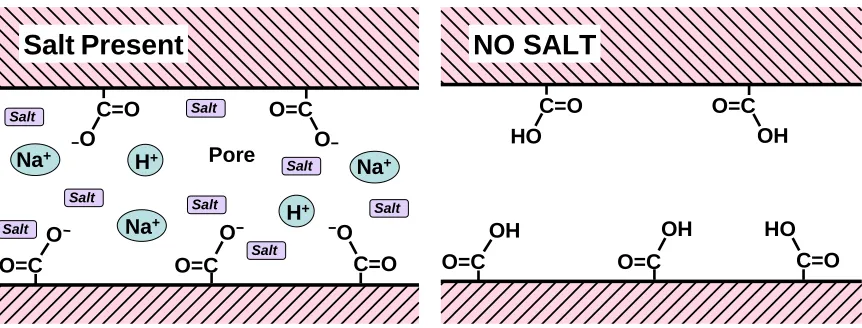
(21) bioresources.com. REVIEW ARTICLE. (Scallan and Tigerström 1992). Laine et al. (2003a) employed Eq. (5) to distinguish the effects of surface swelling vs. bulk swelling of cell walls. To obtain good fits to Eqs. (4) and (5) it was necessary, especially when no salt was added, to assume values of the fractional dissociation α that were much lower, at a given pH, compared to what would be expected for carboxyl groups in bulk solution. This effect was explained in terms of Donnan equilibrium theory, which predicts a shift in the local pH within very small pores, relative to the pH at in the bulk phase adjacent to the fibers. The effect also can be regarded as a shift in the pKa values of the carboxyl groups within fiber cell walls (Freudenberg et al. 2007). Decreased thickness of double layers also can be used as a way to explain decreased swelling of fibers, especially when salt ion levels are increased from the 0.1% range to higher concentrations. It makes sense that the electrostatic repulsion forces tending to expand the sizes of pores within cellulose ought to become less effective when the double layer thickness becomes small relative to the pore size. What is less often reported is that the swelling of cellulosic fibers can decrease when the salt concentrations are reduced to very low levels (Li and Dai 2004). In other words the swelling of fibers can go through a maximum with increasing salt concentration. The decreased swelling in the absence of salt ions is consistent with the estimated 2-50 nm size of typical pores within the cell walls of wet pulp fibers (Stone and Scallan 1968; Deodhar and Luner 1980; Berthold and Salmén 1997; Alince 2002; Andreasson et al. 2003). As described elsewhere (Hubbe et al. 2007a), the calculated thickness of double layers in the absence of salt ions is too large for the double layer to fit within such nanopore spaces. Figure 5 illustrates the contrasting situation of a system in which charged groups and counter-ions exist within the tiny pores within cell walls (5, left), vs. suppression of dissociation and double layers when no salt is present (5, right). As the concentration of monomeric ions is increased from nil to about 1 mM, corresponding to an electrical conductivity range from near zero up to hundreds of μS/cm, double layers will have sufficient space to be able to form and contribute efficiently to electrostatic repulsion forces.. Salt Present. O. O=C. Salt. Na+. H+. O. Salt. O=C. O. Salt. OH. Na+. Salt. Salt. O. Salt. Pore. HO. H+. C=O. O=C. HO. O Na+. O=C. C=O HO. O=C. Salt. O=C. OH. C=O. Salt. NO SALT. C=O. Fig. 5. Representations of (left) a nanopore within cellulosic material in the presence of salt ions in aqueous solution; note presence of dissociated weak acid groups and counter-ions, and (right) suppression of weak acid dissociation and ionic double layer effects in absence of salt ions. Hubbe and Rojas (2008). “Colloidal stability of cellulosics,” BioResources 3(4), 1419-1491. 1439.
(22) REVIEW ARTICLE. bioresources.com. Swelling effects, as just discussed, do not necessarily affect all parts of a cellulosic fiber equally. The structure of a kraft fiber tends to be looser in the surface region of a cell wall (Laine et al. 2003a). Thus, the surface layers, including cellulosic fibrils at the fiber surface, can be expected to imbibe more water in comparison to an equal mass of material from elsewhere in the fiber. Such effects can be further enhanced by surface-selective treatment to increase the negative charge of fiber surfaces, e.g. by carboxymethylation. Conversely, neutralization of charges at the fiber surface, for instance by treatment with a high-charge cationic polyelectrolyte, can be expected to decrease the swelling (Ahola et al. 2008a,b).. COAGULATION AND STABILITY The word “coagulation” is commonly used to describe events involving small particles, droplets, or bubbles of one type of material dispersed in a liquid phase. Coagulation is said to have occurred if, during the time of observation, the dispersed phase undergoes sticking collisions, resulting in agglomerated solids or droplets, the matting down of fibrils at a surface, etc. The terms coagulation and flocculation are often used interchangeably. Sometimes the term coagulation is used to imply the formation of compact aggregates by charge-related effects, leading to a macroscopic separation of phases. The term flocculation is used to describe the formation of a loose or open network that may or may not separate macroscopically. A “stable” colloidal dispersion means that even if the particles collide with each other to a significant extent during the time of observation, most of them remain individually suspended or otherwise in an expanded form in the medium. Coagulation can be triggered by increasing the electrolyte concentration to a value greater than or equal to the critical coagulation concentration (CCC). The value of the CCC depends on the experimental conditions, e.g. the surface charge characteristics, particle sizes, method of mixing, time of mixing, etc. Although the emphasis here will be on the characteristic colloidal behaviors of cellulosic materials, such behaviors in many respects mirror those of other substances for which the theories have been more fully developed (Hiemenz and Rajagopalan 1997). The DLVO theory has been used to predict trends in the rates of coagulation between charged particles in aqueous suspension. In DLVO force profiles, as explained before, the distance-dependencies of the attractive and repulsive components of force tend to be quite different from each other. In typical situations, the attractive component of force becomes dominant if and when the particle surfaces actually come into contact. Kinetics of Coagulation Even in the absence of flow, it is well known that very small particles undergo ceaseless, erratic motion. The motion is associated with the thermal energy of each particle, equal to ½ kT of average kinetic energy in each of the three Cartesian coordinates. Because of such motions, even if there is a net repulsion between particles at intermediate distances, there is always a finite chance that diffusion will succeed in overcoming the barrier of interactive energy that stands in the way of coagulation (see the. Hubbe and Rojas (2008). “Colloidal stability of cellulosics,” BioResources 3(4), 1419-1491. 1440.
(23) bioresources.com. REVIEW ARTICLE. “energy barrier illustrated in Fig. 3, right and also in Fig. 6). In the case of smooth spheres of arbitrary size, the surfaces of which have variously relatively low values of electrical potential, equations given by Hogg et al. (1966) have been found adequate to estimate rates of coagulation in terms of the DLVO theory.. Repulsion. Interaction Force. Barrier. Distance (a). Attraction. Attraction. Repulsion. Interaction Force. Flocculation. Distance (b). Fig. 6. Schematic diagrams of net interactive force between surfaces as a function of separation distance. Left: A typical shape of such a curve in presence of electrostatic repulsion in aqueous solution. Right: Shape of curve expected if the electrostatic repulsion becomes insignificant.. Relatively few investigators have attempted to directly test the implications of the DLVO theory in the case of cellulosic particles in aqueous suspension (Kratohvil et al. 1969; Walkush and Williams 1974; Donnan et al. 1981). Kratohvil et al. (1969) found, consistent with theory, that the stability of microcrystalline cellulose (MCC) suspensions increased with increasing pH, which resulted in increasingly negative surfaces. However, not all of the observations agreed with the DLVO predictions. The stability of MCC suspensions was found to be much more sensitive to the concentrations of cations, compared to what would be expected from the theory. Much better agreement has been found, for instance, for silver halide and hydrous oxide particles (Matijević et al. 1953; Bleier and Matijević 1976). It would seem reasonable that at least part of the lack of fit with DLVO theory is due to the complex surface morphology of typical cellulosic materials, as noted earlier. Still, Walkush and Williams (1974) found good agreement of cellulose suspension coagulation with the well-known Shulze-Hardy rule, which predicts the dependency on counter-ion valence of the minimum electrolyte concentration capable of bringing about coagulation, i.e. the critical coagulation concentration. Thus, as in the case of other colloidal suspensions, a high valence of the oppositely charged ions in an added electrolyte gives a low critical coagulation concentration. Rapid coagulation and stability ratio The rate of aggregation is in general determined by the frequency of collisions and the probability of cohesion during collision. It is customary to refer to “perikinetic aggregation” when the collisions are caused by Brownian motion. On the other hand. Hubbe and Rojas (2008). “Colloidal stability of cellulosics,” BioResources 3(4), 1419-1491. 1441.
Figure
+6
Related documents