3
By 4
Joseph E. Hummer, Ph.D., P.E. 5
Professor, North Carolina State University 6
423 Mann Hall 7
Raleigh, NC 27695-7908 8
Tel.: 919-515-7733 9
Fax: 919-515-7908 10
Email: hummer@ncsu.edu 11
12
William Rasdorf, Ph.D., P.E., F.ASCE 13
Professor, North Carolina State University 14
200 Mann Hall 15
Raleigh, NC 27695-7908 16
Tel.: 919-515-7637 17
Fax: 919-515-7908 18
Email: rasdorf@ncsu.edu 19
20
Daniel J. Findley* 21
Research Associate, Institute of Transportation Research and Education (ITRE) 22
North Carolina State University 23
Centennial Campus, Box 8601 24
Raleigh, NC 27695-8601 25
Tel.: (919) 515-8564 26
Fax: (919) 515-8898 27
Email: Daniel_Findley@ncsu.edu 28
29
Charles V. Zegeer, P.E. 30
Associate Director, Engineering and Planning 31
UNC Highway Safety Research Center 32
730 Martin Luther King, Jr. Blvd. 33
Chapel Hill, NC 27599-3430 34
Tel.: 919-962-7801 35
Fax: 919-962-8710 36
Email: Charlie_Zegeer@unc.edu 37
38
Carl A. Sundstrom 39
Research Associate, UNC Highway Safety Research Center 40
730 Martin Luther King, Jr. Blvd. 41
Chapel Hill, NC 27599-3430 42
Tel.: 919-843-4963 43
Fax: 919-962-8710 44
Email: sundstrom@hsrc.unc.edu 45
46 47
July 31, 2009 48
49
Submitted for consideration for publication and presentation at the 89th Annual Meeting of the 50
Transportation Research Board, January 10-14, 2010 51
52
Word Count: 3,978 text words plus 3,000 for figures/tables (12 * 250) = 6,978 total 53
54
ABSTRACT
1
Horizontal curves are relatively dangerous portions of the roadway network. Agencies optimizing the use 2
of their safety funds on curves should have an idea of the characteristics of the collisions that occur on 3
those segments. However, few previous published papers had attempted to characterize the crashes on 4
horizontal curves. This paper describes an effort that characterized crashes reported to be on curves in 5
North Carolina using the Highway Safety Information System. Over 51,000 crashes on two-lane road 6
curves were compared to crashes on all two-lane roads and to crashes on all roads. Since NC has wide 7
varieties of terrain, climate, and development, the findings should be generally representative of the US. 8
9
The analysis revealed that over-represented two-lane curve crash types included: 10
• Crashes on grades; 11
• Rural; 12
• Severe injury or fatal; 13
• Fixed object (particularly tree, ditch, and embankment); 14
• Overturn; 15
• Off peak hours (particularly during darkness on unlighted roads); 16
• Weekend; 17
• Holiday periods; and 18
• Wet, icy or snowy pavement. 19
20
In addition, the analysis showed that there were few short roadway segments (of 0.1- to 1-mile length) 21
with more than 10 reported curve crashes in 3 years. 22
This paper provides a summary of recommendations from the national literature to treat the over-23
represented crash types on horizontal curves. Based on the findings, agencies should target 24
countermeasures for the most common and over-represented crash types. Agencies should also consider 25
horizontal curves when locating hazardous locations. 26
INTRODUCTION
27
Horizontal curves provide a transition from one tangent section of roadway to the next. These curves 28
exert forces on a vehicle that vary significantly from a tangent section. Drivers must react appropriately 29
to horizontal curves to safely traverse them. A clear understanding of the scope and characteristics of 30
horizontal curve collisions is critical for the informed design of roadways and implementation of traffic 31
control devices to provide warning to drivers. 32
Prioritizing collision countermeasures on two-lane roadways can benefit from an advanced 33
knowledge of curve collisions primarily through a better understanding of prior collision experience. The 34
type of collisions, particularly with fixed roadside objects, play a significant role in collision severity. 35
The same elements can assist the deployment of traffic control devices along with an understanding of the 36
impact of the time of day, lighting, and roadway surface conditions. These elements can also help design 37
effective enforcement, education, and other countermeasures. Which countermeasures have the most 38
promise? What types of crashes should agencies target? Numerous other research efforts have examined 39
specific curve crash countermeasures. However, to this point, no one has published a characterization of 40
curve collisions on a statewide scale. 41
The objective of this research is to characterize when, where, and how horizontal curve collisions 42
occur on two-lane roads. Many states do not have a systematic, statewide method to identify horizontal 43
curves which have high crash experience and/or a high potential for crashes. Understanding curve 44
collision characteristics is important for developing a methodology to find and treat hazardous curve 45
locations. This paper also focused on identifying countermeasures which can potentially reduce curve 46
crashes associated with various crash factors. This requires a good understanding of the human, roadway, 47
and environmental factors which contribute to the cause and the resulting severity of the crash. It also 48
which are available to address specific crash causes, as determined by available guidelines, research, and 1
agency experiences. In conjunction with this analysis of curve crashes, this paper matched specific 2
countermeasures to various crash characteristics. 3
The crash data analysis in this study was focused on NC roads. NC experiences a broad range of 4
topographic conditions, climates, and rural/urban settings. This diversity in conditions makes NC an 5
appealing location for determining representative horizontal curve collision characteristics. The reporting 6
threshold in NC is a collision that resulted in a fatality, non-fatal personal injury, property damage of 7
$1,000 or more, or property damage of any amount to a vehicle seized (1). The NCDOT controls almost 8
80,000 miles of roadways, which creates consistency across the state with roadway design, construction, 9
and maintenance. These factors make findings based on NC collision data useful to many other 10
jurisdictions. 11
LITERATURE REVIEW
12
There are many studies identifying crash characteristics and geometric design features that have an effect 13
on crashes. The following studies all identify horizontal curves as causal factors in highway crashes with 14
a significantly higher crash rate than tangent sections or study specifically horizontal curve crashes. 15
Garber and Kassebaum (2) studied nearly 10,000 crashes on urban and rural two-lane highways 16
in Virginia finding the predominate type of crash to be run-off-the-road crashes. The significant causal 17
factors of these run-off-the-road crashes included roadway curvature and traffic volume as determined 18
through a fault tree analysis. The countermeasures identified to mitigate run-off-the-road crashes include 19
widening the roadway, adding advisory signs or chevrons to sharp curves, and adding or improving 20
shoulders. 21
Another study that investigated the relationship between roadway design attributes and crash 22
activity was performed by Strathman et al (3). This study investigated the statistical relationship between 23
crash activity and roadway design attributes on Oregon highways. Using crash data from a two-year 24
period (1997-1998), the highways were divided into variable length homogenous highway segments, 25
yielding a set of over 11,000 segments. For non-freeway segments, maximum curve length and right 26
shoulder width were found to be among the design attributes related to curves that were statistically 27
related to crash activity. Maximum curve angle was not found to be related to crash activity. 28
Souleyrette et al.(4) evaluated roadway and crash characteristics for all highways in Iowa through 29
integrating databases with digital imagery, roadway characteristics, and crash data. This project studied 30
five crash types including crashes on horizontal curves and made use of the GIS data to collect roadway 31
characteristics that were not identified by crash records. The analysis of high crash locations on horizontal 32
curves found that the degree of curvature had a direct impact on the crash rate. The model also indicated 33
that the degree of curvature had a direct impact on horizontal curves and that the crash rate on shorter 34
curve lengths was significantly higher than on longer curves. In addition, this study produced a curve 35
database for Iowa with radii and length attributes and a procedure for identifying horizontal curves with 36
high crash occurrences statewide. 37
Zegeer et al. (5) analyzed over 13,000 horizontal curves, primarily in Washington, to evaluate the 38
relationship between curve features and crashes. To meet the study objective, the horizontal curve 39
features which affected traffic safety and operation were first identified. A collision prediction model 40
consisting of six variables relating to collisions and curve features was developed through a variety of 41
statistical methods. These six variables were: curve length, vehicles volume, degree of curve, presence of 42
spiral transitions, and roadway width. From these identified features, existing countermeasures for 43
enhancing safety and operations at particular curve sections were determined and the model developed an 44
effectiveness of crash reduction for each of these treatments. This study also provided general safety 45
guidelines for curve design including signing, marking, and delineation as recommended cost-effective 46
countermeasures. 47
McGee and Hanscom (6) provide a publication on low-cost treatments that can be applied to 48
MUTCD, rumble strips, minor roadway improvements, and innovative and experimental treatments. For 1
every treatment, the authors concisely identified a description of the treatment, and application guideline, 2
design elements, the effectiveness, cost, maintenance, and additional sources. 3
In Volume 7 of NCHRP Report 500, Torbic et al. (7) provided strategies to improve the safety of 4
horizontal curves. This study had two primary purposes. The first was to reduce the likelihood of a 5
vehicle leaving its lane and either crossing the roadway centerline or leaving the roadway at a horizontal 6
curve. The other purpose was to minimize the adverse consequences of leaving the roadway at a 7
horizontal curve. To accomplish these research objectives, twenty detailed strategies were described as 8
countermeasures for reducing curve-related crashes. Each strategy included a general description, an 9
estimate of the effectiveness of treatments, and special issues pertaining to horizontal curves. These 10
treatments addressed traffic control devices, markings, sight distances, and horizontal alignments. 11
Many other research efforts have examined specific curve crash countermeasures. However, to 12
this point, as mentioned previously, no past study has characterized curve collisions on a large scale and 13
matched the results with countermeasures directed at specific crash causes. Also, this paper provides 14
recommendations on how an agency can conduct a comprehensive analysis of horizontal curve safety 15
problems and deal with these problems in a systematic manner. 16
METHODOLOGY
17
The Highway Safety Information System (HSIS) collects and reports statewide collision data for 18
participating states, which includes seven states with recent collision data (8). North Carolina was 19
preselected as a data source by the Federal Highway Administration (FHWA) for inclusion in the HSIS 20
program for its high quality crash, roadway inventory, and traffic volume databases. The NC database that 21
the FHWA receives is derived from an Oracle database on the North Carolina Division of Motor Vehicles 22
System. NC provides collision characteristics, data on vehicles and occupants in the collisions, and a 23
roadway inventory (9). To achieve the objective of characterizing curve collisions, the research team 24
requested horizontal curve collision data from the HSIS. While NC does not have an individual curve 25
database, a high number of curve crashes and corresponding roadway data are still available, making the 26
database suitable for the curve crash analysis. The analysis was conducted on the dataset of curve crashes 27
received from the HSIS and included curve and non-curve collisions on two-lane roads and on all road 28
types. The two-lane road and all roads datasets were obtained from an internet application which contains 29
crash data from 2001 to 2006 from the North Carolina Department of Transportation crash database (10). 30
For our study NC collision data from 2003 to 2005 were analyzed in each database. The 31
statewide data for all roads were useful for comparisons to rural and urban settings in which we had the 32
greatest interest. The collision data on all two-lane roads were an effective comparison because two-lane 33
curve collisions are a subset of the all two-lane roads database with which the curves share some roadway 34
feature similarities. 35
COLLISION DATA ANALYSIS
36
The three-year analysis period of collision data (2003 to 2005) resulted in 51,238 reported collisions on 37
curves on two-lane roads in NC and 95,552 reported collisions on curves on all roads in North Carolina. 38
These crashes were identified based on their coding as “curve-related” by the reporting police officer on 39
the crash report form. 40
In the following tables, some column totals might not sum to 100% because of rounding. The 41
data are presented as percentages, not frequencies, for easier comparison. In the tables, “2-lane curve 42
collisions” represent the collisions reported on two-lane curves, “all 2-lane collisions” represent the 43
collisions reported on all two-lane roadways throughout North Carolina, and “all roads collisions” 44
represent the collisions reported on all roads throughout North Carolina. 45
Road Characteristics
46
Aspects of the roadway itself significantly affect collisions. TABLE 1 shows that 21% of all two-lane 47
collisions occur more often on roadways sections with a grade (37% for all two-lane roads, 38% for all 1
roads) rather than on tangent sections on a grade (18% for all two-lane roads, 17% for all roads). The 2
reported curve collisions primarily occur in rural locations (70%), compared to 62% of all two-lane 3
collisions and 45% of all statewide collisions (TABLE 2). It appears that rural, horizontal curves are 4
particularly susceptible to collisions. 5
TABLE 1 Horizontal Curve Collision Roadway Characteristics 6
Road
Characteristic Grade
Level 77% 78%
Hillcrest 4% 4%
Grade 18% 17%
Bottom 1% 1%
Level 56% 53%
Hillcrest 4% 6%
Grade 37% 38%
Bottom 3% 3%
Other N/A 0% 1%
Uncoded N/A 100% 99%
All 2-Lane Collisions All Roads Collisions
68%
6% 80%
21% 14%
10% Tangent
Curve
7
TABLE 2 Horizontal Curve Collision Setting Characteristics 8
Setting Grade
Level 54%
Hillcrest 6%
Grade 37%
Bottom 3%
Level 57%
Hillcrest 3%
Grade 37%
Bottom 2%
2-Lane Curve Collisions
All 2-Lane Collisions
All Roads Collisions
55%
Rural 70% 62% 45%
Urban 30% 38%
9 10
Collision Characteristics
11
This section discusses how severity, frequency, type, alcohol involvement, time of day, day of week, 12
month of year, lighting, and surface conditions affect collisions. 13
14
Severity 15
Collision severity is an important component of collision analysis and countermeasure initiatives. 16
Severity is measured on a five-point scale in North Carolina: fatality (K), disabling injury (type A), 17
evident injury (type B), possible injury (type C), and property damage only (PDO) (NCDMV, 2006). 18
Two-lane curves typically have narrower lanes and shoulders, more sight distance concerns, and less 19
frequent maintenance than other segments and roadway types. Table 3 shows that these factors indicate 20
that two-lane curve collisions have twice the percentage of fatal and type A injury collisions when 21
compared to collisions on all two-lane roads and all roads statewide. Fatal collisions compose 1.9% of 22
total reported two-lane curve collisions, compared to 0.9% of all two-lane road collisions and 0.6% of all 23
collisions compared to 1.9% of all two-lane road collisions and 1.4% of all statewide collisions. Two-1
lane curve collisions are much more severe in urban areas than all road collisions. 2
3
TABLE 3 Horizontal Curve Collision Severity Characteristics 4
K 1.5% 2.1% 1.9% 0.9% 0.3% 1.0% 0.6%
A 3.0% 3.7% 3.5% 1.9% 0.8% 2.1% 1.4%
B 16.1% 18.3% 17.6% 11.9% 7.4% 11.7% 9.4%
C 24.4% 24.6% 24.5% 25.5% 26.2% 23.7% 25.1%
PDO 49.1% 44.1% 45.6% 54.7% 62.1% 58.0% 60.2%
Unknown 5.9% 7.2% 6.8% 5.1% 3.3% 3.5% 3.4%
Rural Urban Rural
Severity
2-Lane Curve Collisions All 2-Lane
Collisions All Roads Collisions
Setting
Total Total Setting Total
Urban
5
Frequency 6
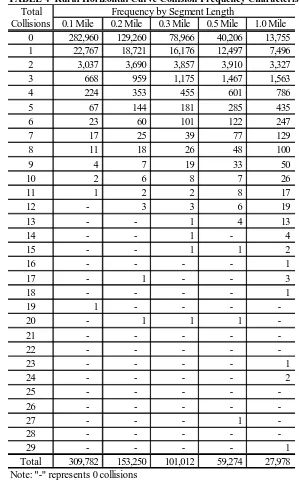
The frequency of collisions on curves on rural two-lane curved roads were examined with a sliding scale 7
analysis using 0.1-, 0.2-, 0.3-, 0.5- and 1-mile segment lengths. A sliding scale analysis is useful for 8
identifying concentrations of collisions without arbitrarily defining segments to analyze. The sliding 9
scale of predetermined length moves along a roadway to determine the number of collisions within the 10
segment. The results, presented in Table 4 show that only four segments experienced 10 or more 11
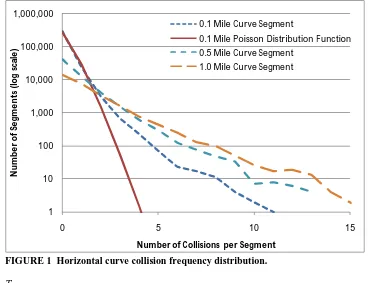
collisions in 0.1-mile segment lengths during the three-year period of analysis. Figure 1 shows a graph of 12
the 0.1-mile segment length collision frequency versus a theoretical Poisson distribution. Using a chi-13
square goodness of fit test, which is a stringent test to meet, the data do not fit a Poisson distribution 14
function at the 95% confidence level, but a visual inspection showed a decent match. 15
The key question related to this analysis is what is the most appropriate roadway segment length 16
for use in identifying high-crash curves in a spot safety improvement analysis. The answer to this 17
question must consider the accuracy of crash location reporting by the reporting police agency, the 18
characteristics of horizontal curves (e.g., spacing between curves, length of curves, etc.), and the nature of 19
the crash file (e.g. relative number and distribution of curve crashes along routes). For purposes of their 20
spot safety improvement program, many states use a floating fixed segment length, such as a 0.1 or 0.3-21
mile segment, and may also include a longer section (e.g., 1-mile section) for “flagging” roadway sections 22
for further analysis. 23
One way to approach determining an optimal segment length, for the purpose of a curve safety 24
analysis, is to test different segment lengths for a sample of roadways and determine the segment length 25
that yields the most useful results. For example, if roadway sections are in rolling areas and have long 26
gradual curves, a floating segment length of 0.3 to 0.5 miles may be appropriate. In mountainous areas 27
with many sharp, short curves, a floating segment length of shorter (e.g., 0.1 mile) might be more 28
meaningful to identify individual high-crash curves. Longer floating segment lengths (e.g., 1-mile) can 29
be used to identify roadway sections which have more than their share of curve-related crashes, so the 30
TABLE 4 Rural Horizontal Curve Collision Frequency Characteristics 1
0.1 Mile 0.2 Mile 0.3 Mile 0.5 Mile 1.0 Mile
0 282,960 129,260 78,966 40,206 13,755
1 22,767 18,721 16,176 12,497 7,496
2 3,037 3,690 3,857 3,910 3,327
3 668 959 1,175 1,467 1,563
4 224 353 455 601 786
5 67 144 181 285 435
6 23 60 101 122 247
7 17 25 39 77 129
8 11 18 26 48 100
9 4 7 19 33 50
10 2 6 8 7 26
11 1 2 2 8 17
12 - 3 3 6 19
13 - - 1 4 13
14 - - 1 - 4
15 - - 1 1 2
16 - - - - 1
17 - 1 - - 3
18 - - - - 1
19 1 - - -
-20 - 1 1 1
-21 - - - - -22 - - - - -23 - - - - 1
24 - - - - 2
25 - - - - -26 - - - - -27 - - - 1
-28 - - - - -29 - - - - 1
Total 309,782 153,250 101,012 59,274 27,978
Total Collisions
Frequency by Segment Length
1 10 100 1,000 10,000 100,000 1,000,000
0 5 10 15
N
um
be
r o
f S
eg
m
en
ts
(lo
g
sc
al
e)
Number of Collisions per Segment 0.1 Mile Curve Segment
0.1 Mile Poisson Distribution Function 0.5 Mile Curve Segment
1.0 Mile Curve Segment
1
FIGURE 1 Horizontal curve collision frequency distribution. 2
Type 3
Table 5 shows that collisions with fixed objects make up the majority of total reported two-lane curve 4
collisions (52%), compared to 23% of all two-lane road collisions and 15% of all statewide collisions. 5
The differences are more pronounced on urban two-lane curves, where collisions with fixed objects make 6
up 43% of reported collisions, compared to 4% of all urban statewide collisions. Two-lane curve 7
collisions experience a lower percentage of reported rear-end-stopped, angle, and animal collisions than 8
all two-lane road and all road collisions. 9
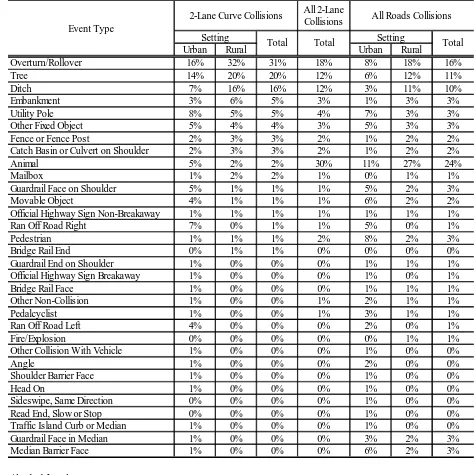
Table 6 shows the most harmful events and objects in single vehicle collisions. This table 10
provides insight into which objects were struck by the vehicle. Overturn/rollover collisions (31%), 11
collisions with trees (20%), and ditches (16%) constitute the majority of most harmful events in single 12
vehicle collisions on two-lane curves. For all two-lane roads and all roads, the most harmful events are 13
TABLE 5 Horizontal Curve Collision Type Characteristics 1
Fixed Object 43% 56% 52% 23% 4% 28% 15%
Overturn/Roll 6% 10% 9% 3% 0% 4% 2%
Run Off Road - Right 8% 7% 7% 5% 4% 3% 4%
Rear End - Stopped 11% 4% 6% 20% 33% 17% 26%
Side Swipe - Opposite Direction 5% 5% 5% 3% 1% 2% 2%
Angle 5% 2% 3% 12% 21% 7% 15%
Left Turn - Different Road 4% 2% 3% 5% 4% 5% 5%
Run Off Road - Left 3% 3% 3% 2% 2% 2% 2%
Head On 2% 2% 2% 2% 1% 1% 1%
Left Turn - Same Road 3% 2% 2% 5% 6% 5% 5%
Animal 2% 2% 2% 4% 1% 13% 7%
Moveable Object 1% 1% 1% 1% 1% 1% 1%
Side Swipe - Same Direction 1% 1% 1% 3% 8% 3% 6%
Parked Motor Vehicle 1% 1% 1% 2% 2% 1% 1%
Other Non-Collision 1% 1% 1% 1% 1% 1% 1%
Rear End - Turning 1% 1% 1% 2% 1% 1% 1%
Other Collision 1% 0% 0% 1% 1% 1% 1%
Backing Up 1% 0% 0% 3% 3% 1% 2%
Right Turn - Different Road 1% 0% 0% 1% 1% 1% 1%
Right Turn - Same Road 0% 0% 0% 1% 1% 1% 1%
Pedestrian 0% 0% 0% 1% 1% 0% 1%
Total Urban Rural
All Roads Collisions
Rural All 2-Lane
Collisions 2-Lane Curve Collisions
Urban Collision Type Setting
Total Setting
TABLE 6 Horizontal Curve Collision Most Harmful Event Characteristics 1
Overturn/Rollover 16% 32% 31% 18% 8% 18% 16%
Tree 14% 20% 20% 12% 6% 12% 11%
Ditch 7% 16% 16% 12% 3% 11% 10%
Embankment 3% 6% 5% 3% 1% 3% 3%
Utility Pole 8% 5% 5% 4% 7% 3% 3%
Other Fixed Object 5% 4% 4% 3% 5% 3% 3%
Fence or Fence Post 2% 3% 3% 2% 1% 2% 2%
Catch Basin or Culvert on Shoulder 2% 3% 3% 2% 1% 2% 2%
Animal 5% 2% 2% 30% 11% 27% 24%
Mailbox 1% 2% 2% 1% 0% 1% 1%
Guardrail Face on Shoulder 5% 1% 1% 1% 5% 2% 3%
Movable Object 4% 1% 1% 1% 6% 2% 2%
Official Highway Sign Non-Breakaway 1% 1% 1% 1% 1% 1% 1%
Ran Off Road Right 7% 0% 1% 1% 5% 0% 1%
Pedestrian 1% 1% 1% 2% 8% 2% 3%
Bridge Rail End 0% 1% 1% 0% 0% 0% 0%
Guardrail End on Shoulder 1% 0% 0% 0% 1% 1% 1%
Official Highway Sign Breakaway 1% 0% 0% 0% 1% 0% 1%
Bridge Rail Face 1% 0% 0% 0% 1% 1% 1%
Other Non-Collision 1% 0% 0% 1% 2% 1% 1%
Pedalcyclist 1% 0% 0% 1% 3% 1% 1%
Ran Off Road Left 4% 0% 0% 0% 2% 0% 1%
Fire/Explosion 0% 0% 0% 0% 0% 1% 1%
Other Collision With Vehicle 1% 0% 0% 0% 1% 0% 0%
Angle 1% 0% 0% 0% 2% 0% 0%
Shoulder Barrier Face 1% 0% 0% 0% 1% 0% 0%
Head On 1% 0% 0% 0% 1% 0% 0%
Sideswipe, Same Direction 0% 0% 0% 0% 1% 0% 0%
Read End, Slow or Stop 0% 0% 0% 0% 1% 0% 0%
Traffic Island Curb or Median 1% 0% 0% 0% 1% 0% 0%
Guardrail Face in Median 1% 0% 0% 0% 3% 2% 3%
Median Barrier Face 1% 0% 0% 0% 6% 2% 3%
Event Type
Total Total Setting Total
Urban Rural Urban Rural
2-Lane Curve Collisions All 2-Lane
Collisions All Roads Collisions
Setting
2
Alcohol Involvement 3
Alcohol is involved in 11% of reported two-lane curve collisions, compared to 7% of all two-lane road 4
collisions and 5% of all statewide collisions. Impaired drivers likely have a more difficult time keeping 5
their vehicles on the road in curves than they do on tangents. 6
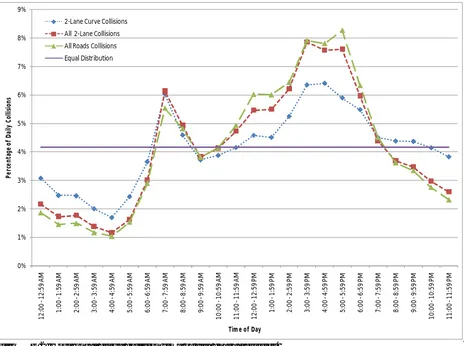
Time of Day 7
Two-lane road curve collisions tend to be more evenly dispersed throughout the day than do statewide 8
road total collisions and two-lane roads total collisions (Figure 2). During almost all hours, the point 9
representing two-lane curve collisions is closer to the average percentage of 4.2 per hour than the other 10
points. Two-lane road curve collisions are more likely to be single vehicle collisions, primarily with fixed 11
objects. Other roads experience more multi-vehicle collisions which are more likely a function of traffic 12
volume fluctuations occurring during morning and afternoon peak periods. Also, visibility at night is a 13
0% 1% 2% 3% 4% 5% 6% 7% 8% 9% 12 :00 -12 :59 AM 1: 00 -1 :5 9 AM 2: 00 -2 :5 9 AM 3: 00 -3 :5 9 AM 4: 00 -4 :5 9 AM 5: 00 -5 :5 9 AM 6: 00 -6 :5 9 AM 7: 00 -7 :5 9 AM 8: 00 -8 :5 9 AM 9: 00 -9 :5 9 AM 10 :00 -10 :59 AM 11 :00 -11 :59 AM 12 :00 -1 2: 59 PM 1: 00 -1 :59 PM 2: 00 -2 :59 PM 3: 00 -3 :59 PM 4: 00 -4 :59 PM 5: 00 -5 :59 PM 6: 00 -6 :59 PM 7: 00 -7 :59 PM 8: 00 -8 :59 PM 9: 00 -9 :59 PM 10 :00 -1 0: 59 PM 11 :00 -1 1: 59 PM Pe rc en ta ge o f D ai ly C ol lis io ns
Time of Day 2-Lane Curve Collisions
All 2-Lane Collisions All Roads Collisions Equal Distribution
1
FIGURE 2 Horizontal curve collision time of day characteristics. 2
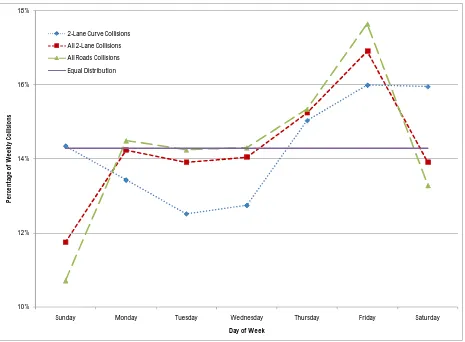
Day of Week 3
Two-lane road curve collisions tend to be more evenly dispersed throughout the week –and thus are more 4
prominent during weekends– than statewide road total collisions and two-lane roads total collisions 5
(Figure 3). This dispersion could again be because curve collisions are a function of a permanent 6
roadway feature while the two-lane and all statewide road categories are subject to more pronounced 7
traffic volume peaks. Two-lane statewide total collisions and statewide total collisions experience two 8
peaks during the week: at the beginning of the work week (Monday) and at the end of the work week 9
(Friday). Two-lane curve collisions experience a more gradual peak centered on the weekend. Two-lane 10
road curve collisions are also more likely to involve a single vehicle, while other roads experience more 11
multi-vehicle collisions which are more possible during heavy traffic conditions. Alcohol could also play 12
a role in increasing the weekend peak of two-lane curve collisions. Hourly volumes would be a useful 13
addition to the crash data to present the crashes in relation to crashes per million vehicle miles travelled. 14
However, hourly volume data was not readily available for integration with the crash database. 15
10% 12% 14% 16% 18%
Sunday Monday Tuesday Wednesday Thursday Friday Saturday
Pe
rc
ent
ag
e
of
W
ee
kl
y
Co
lli
sions
Day of Week 2-Lane Curve Collisions
All 2-Lane Collisions All Roads Collisions Equal Distribution
1
FIGURE 3 Horizontal curve collision day of week characteristics. 2
Month of Year 3
Two-lane road curve collisions tend to be less evenly dispersed by month throughout the year than 4
statewide road total collisions and two-lane roads collisions (Figure 4). This dispersion could be because 5
curve collisions are impacted more heavily by more pronounced seasonal variations in volume. Each of 6
the roadway types experience peaks in percentage of collisions during the winter holiday months and at 7
the beginning and ending of the summer months. The peak in the winter is likely due to weather 8
conditions and a lower maintenance standard (e.g., ice and snow removal priorities) for two-lane curves 9
than other roads. Higher volumes in recreation areas on rural roads during the summer months could 10
7% 8% 9% 10%
JAN FEB MAR APR MAY JUN JUL AUG SEP OCT NOV DEC
Pe
rc
en
ta
ge
o
f Y
ea
rly
C
oll
isi
ons
Month 2-Lane Curve Collisions
All 2-Lane Collisions All Roads Collisions Equal Distribution
1
FIGURE 4 Horizontal curve collision month of year characteristics. 2
3
Lighting 4
Collisions during the daylight make up the majority of the total reported two-lane curve collisions (59%), 5
compared to 67% of all two-lane road collisions and 68% of all statewide collisions. Collisions during 6
the dark in unlighted conditions make up 31% of urban reported two-lane curve collisions, compared to 7
5% of all urban statewide collisions. Two-lane curve collisions experience a lower percentage of reported 8
collisions during the dark in lighted conditions than all two-lane collisions or all road collisions. The 9
collisions during the dark in lighted and unlighted conditions are likely influenced by the percentage of 10
statewide roads that have roadway lighting compared to 2-lane curve segments (particularly in urban 11
1
Surface 2
Collisions on a dry roadway surface make up 70% of total reported two-lane curve collisions, compared 3
to 77% of all two-lane road collisions and 77% of all statewide collisions (Table 7). Collisions on non-4
ideal roadway surface conditions (the combination of all conditions except dry) constitute a greater 5
portion of total reported two-lane curve collisions (30%) than on all two-lane road collisions (23%) and 6
all statewide collisions (23%). These findings tend to indicate that surface condition doesn’t significantly 7
influence collisions on curves. 8
TABLE 7 Horizontal Curve Collision Roadway Surface Characteristics 9
Dry 71% 70% 70% 77% 79% 76% 77%
Wet 21% 21% 21% 17% 18% 18% 18%
Water 1% 1% 1% 1% 1% 1% 1%
Ice 4% 4% 4% 3% 2% 3% 2%
Snow 2% 2% 2% 2% 1% 2% 1%
Slush 1% 1% 1% 0% 0% 0% 0%
Rural Urban Rural
Roadway Surface Condition
2-Lane Curve Collisions All 2-Lane
Collisions All Roads Collisions
Setting
Total Total Setting Total
Urban
10
RESULTS
11
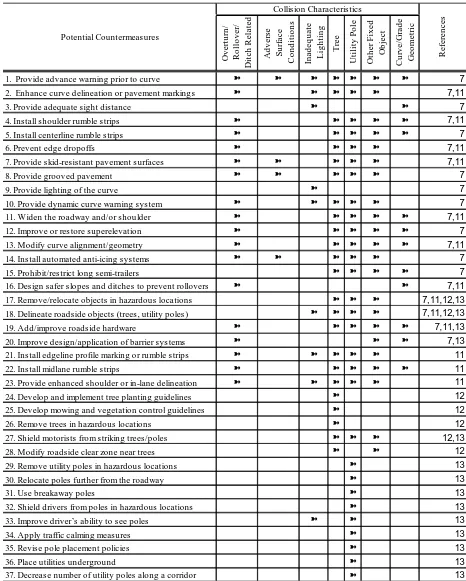
The collision analysis and characterization led to the creation of a table which presents potential 12
countermeasures to reduce the frequency and/or severity of horizontal curve crashes. Table 8 shows a 13
total of 37 different countermeasures which may be useful for reducing curve crashes, particularly on 2-14
lane roads. For each of the countermeasures in the table, the check marks in the matrix indicate the type 15
of collision factor the countermeasure is most likely to address. These collision factors were identified 16
from the data analysis described earlier. For example, crashes involving inadequate lighting are most 17
likely to be reduced by such measures as countermeasure number 1 (provide advanced warning prior to 18
curve), 2 (enhanced curve delineation), 3 (provide adequate sight distance, 9 (provide lighting on curve), 19
10 (provide dynamic curve warning signs), etc., as indicated by the check marks in the corresponding 20
matrix cells. 21
CONCLUSIONS
22
The purpose of this study was to conduct a detailed multi-year analysis of horizontal curve collisions on a 23
statewide basis to identify key contributing factors associated with curve crashes. These results were used 24
to match major crash causes to potential countermeasures. The primary factors found to be associated 25
with curve crashes on rural, 2-lane roads include fixed objects (particularly trees and poles), 26
overturn/ditch related factors, alcohol-related, adverse light conditions (i.e., nighttime), adverse roadway 27
surface conditions, curve/grade geometric issues, and time-related factors (weekends), among others. 28
However, two-lane curve collisions most often involve only a collision with roadway or roadside features, 29
which means countermeasures can have a disproportionately positive impact on collisions. 30
In all of North Carolina over a three-year period, only 4 segments out of almost 310,000 31
statewide (one tenth of a mile in length) experienced 10 or more curve collisions (see Table 4 and Figure 32
1). Thus, the frequency of curve collisions per site are low compared to intersections, which could lead 33
transportation agencies to overlook curves during hazard site identification processes. The selection of 34
roadway segment length for identifying hazardous curve locations is critical. Length of segment to use in 35
1
TABLE 8 Summary of Potential Countermeasures to Reduce the Frequency and/or Severity of Horizontal 2 Curve Crashes 3 O v e rt u rn / R o ll o v e r/ D it c h R e la te d A dve rs e S u rf a c e C ond it ions In a d e q u a te L igh ti ng T ree U ti li ty P o le O th e r F ix e d O b ject C u rv e /G rad e G e o m e tr ic
1. Provide advance warning prior to curve ü ü ü ü ü ü ü 7
2. Enhance curve delineation or pavement markings ü ü ü ü ü 7,11
3. Provide adequate sight distance ü ü 7
4. Install shoulder rumble s trips ü ü ü ü ü 7,11
5. Install centerline rumble strips ü ü ü ü ü 7
6. Prevent edge dropoffs ü ü ü ü 7,11
7. Provide skid-resistant pavement surfaces ü ü ü ü ü 7,11
8. Provide grooved pavement ü ü ü ü ü 7
9. Provide lighting of the curve ü 7
10. Provide dynamic curve warning system ü ü ü ü ü 7
11. Widen the roadway and/or shoulder ü ü ü ü ü 7,11
12. Improve or res tore superelevation ü ü ü ü ü 7
13. Modify curve alignment/geometry ü ü ü ü ü 7,11
14. Install automated anti-icing systems ü ü ü ü ü 7
15. Prohibit/res trict long semi-trailers ü ü ü ü 7
16. Des ign safer slopes and ditches to prevent rollovers ü ü 7,11
17. Remove/relocate objects in hazardous locations ü ü ü 7,11,12,13
18. Delineate roadside objects (trees, utility poles ) ü ü ü ü 7,11,12,13
19. Add/improve roadside hardware ü ü ü ü ü 7,11,13
20. Improve design/application of barrier sys tems ü ü ü 7,13
21. Install edgeline profile marking or rumble strips ü ü ü ü ü 11
22. Install midlane rumble s trips ü ü ü ü ü 11
23. Provide enhanced shoulder or in-lane delineation ü ü ü ü ü 11
24. Develop and implement tree planting guidelines ü 12
25. Develop mowing and vegetation control guidelines ü 12
26. Remove trees in hazardous locations ü 12
27. Shield motorists from striking trees/poles ü ü ü 12,13
28. Modify roadside clear zone near trees ü ü 12
29. Remove utility poles in hazardous locations ü 13
30. Relocate poles further from the roadway ü 13
31. Use breakaway poles ü 13
32. Shield drivers from poles in hazardous locations ü 13
33. Improve driver’s ability to see poles ü ü 13
34. Apply traffic calming measures ü 13
35. Revis e pole placement policies ü 13
36. Place utilities underground ü 13
37. Decrease number of utility poles along a corridor ü 13
Potential Countermeasures
Collis ion Characteris tics
1 2
RECOMMENDATIONS
3
The research team recommends several actions to help transportation agencies to better understand and 4
identify problems involving horizontal curve collisions and identifying horizontal curves collisions. A 5
similar statewide curve analysis can help identify any unique circumstances that create an 6
overrepresentation of certain types or characteristics of collisions. The severity of two-lane curves, 7
particularly in rural areas, should be considered as part of a hazardous site identification program. The 8
curve collision analysis can identify specific hazardous locations as well as systematic deficiencies among 9
regions, routes, geometric design factors, traffic control device consistency, shoulder width or type, 10
maintenance practices, etc. A comprehensive horizontal curve process would help guide agencies 11
through horizontal curve identification, investigation, analysis, evaluation, countermeasure selection and 12
evaluation, assessment of funding sources, and recommendation of countermeasures. The team also 13
recommends the use of Table 8 as an initial guide to select potential countermeasures for horizontal curve 14
collisions. 15
ACKNOWLEDGMENTS
16
This paper was based on a study funded by the North Carolina Department of Transportation entitled 17
"Procedure for Curve Warning Signing, Delineation, and Advisory Speeds for Horizontal Curves". Brian 18
Mayhew is the N.C. DOT Chair of the Steering and Implementation Committee. We also appreciate the 19
assistance of the Highway Safety Information System (HSIS) project, funded by FHWA through the UNC 20
Highway Safety Research Center, for providing original summary tables of crash information for use in 21
this paper. 22
REFERENCES
23
1. NCDMV. North Carolina Crash Report Instruction Manual. Raleigh, NC: North Carolina 24
Department of Transportation. Division of Motor Vehicles. 2006. 25
26
2. Garber, N. J. and E. A. Kassebaum. Evaluation of Crash Rates and Causal Factors for High-Risk 27
Locations on Rural and Urban Two-Lane Highways in Virginia. Publication VTRC 09-R1. Virginia 28
Transportation Research Council, 2008. 29
30
3. Strathman, J. G. et al. Analysis of Design Attributes and Crashes on the Oregon Highway System. 31
Publication FHWA-OR-RD-02-01. FHWA, U.S. Department of Transportation, 2001. 32
33
4. Souleyrette, R. et al. Systematic Identification of High Crash Locations. Publication TR-442. Iowa 34
Department of Transportation, 2001. 35
36
5. Zegeer, C., et al. Cost-Effective Geometric Improvements for Safety Upgrading of Horizontal Curves. 37
Publication FHWA-RD-90-074. FHWA, U.S. Department of Transportation, 1991. 38
39
6. McGee, H. W. and F. R. Hanscom. Low-Cost Treatments for Horizontal Curve Safety. Publication 40
FHWA-SA-07-002. FHWA, U.S. Department of Transportation, 2006. 41
42
7. Torbic, D. J. et al. Volume 7: Guidance for Reducing Collisions on Horizontal Curves, NCHRP Report 43
500. Transportation Research Board of the National Academies, Washington, D.C., 2004. 44
45
8. HSIS. Highway Safety Information System. Retrieved July 1, 2009, from Turner-Fairbank Highway 46
Research Center: http://www.hsisinfo.org/ 47
9. Council, F. M., Patel, R., & Mohamedshah, Y. (2006). Highway Safety Information System Guidebook 1
for the North Carolina State Data Files. Washington, DC: Federal Highway Adminstration. 2
3
10. HSRC. North Carolina Crash Data. Retrieved July 1, 2009, from Highway Safety Research Center at 4
the University of North Carolina at Chapel Hill: http://www.hsrc.unc.edu/crash/ 5
6
11. Neuman, Timothy R. et al. Volume 6: A Guide for Addressing Run-Off-Road Collisions, NCHRP 7
Report 500. Transportation Research Board of the National Academies, Washington, D.C., 2003. 8
9
12. Neuman, Timothy R. et al. Volume 3: A Guide for Addressing Collisions with Trees in Hazardous 10
Locations, NCHRP Report 500. Transportation Research Board of the National Academies, 11
Washington, D.C., 2003. 12
13
13. Lacy, Kevin et al. Volume 8: A Guide for Reducing Collisions Involving Utility Poles, NCHRP Report 14


![Crystal structure of 3 [(E) 2 (4 phenyl 1,3 thiazol 2 yl)hydrazin 1 ylidene]indolin 2 one](data:image/gif;base64,R0lGODlhAQABAIAAAP///wAAACH5BAEAAAAALAAAAAABAAEAAAICRAEAOw==)