ABSTRACT
HECHT, ELIZABETH SARA. Characterization and Processing of Aflatoxin-Reduced, Whole Protein Soluble Extracts from Aflatoxin-Enriched Peanut Meal Using Response Surface Methods. (Under the direction of Dr. Jack P. Davis).
Mycotoxins are a global problem contaminating ~25% of the world’s crops; these losses are not sustainable with world-wide food shortages (FAO and others 2012). Peanuts are a critical source of protein in the developing world yet are particularly susceptible to contamination by aflatoxins, a subset of the mycotoxin family. In developed countries, aflatoxin contaminated peanuts are diverted to oilstock, where any aflatoxin present does not fractionate with the oil, but is concentrated within the low oil, high protein (50% wt.)
byproduct named peanut meal (PM). Previous work in our lab extracted aflatoxin-reduced, enzymatically-hydrolyzed protein from PM. However, whole-protein extracts could have functionality and processing benefits compared to hydrolysates. This thesis investigates three key research problems: the quantification of aflatoxin; the potential for producing an
aflatoxin-reduced, whole-protein-rich soluble fraction derived from contaminated PM; and the interactions between aflatoxin and co-solutes under alkaline conditions.
Extraction and purification methods were improved to increase the recovery of aflatoxin quantified by HPLC from highly contaminated PM (373 ng/g). Solutions of 60% aqueous acetonitrile and 80% aqueous methanol were compared for extraction efficiency. The extract:PM ratio was considered for methanol extract systems and a 4:1 ratio extracted significantly more aflatoxin than from a 2:1 ratio. Acetonitrile solutions extracted
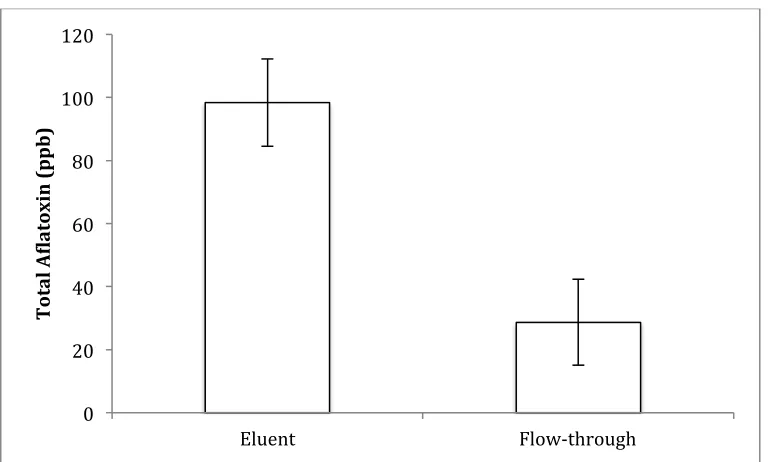
immnoaffinity columns, aflatoxin recoveries from both extracts were independent of load volume at dilutions equal or greater to 2.5x. When samples were purified on FlorisilTM silica-gel columns, ~20% of aflatoxin loaded was detected in the flow-through. Furthermore, aflatoxin standards could be recovered by only ~80% after an eluent evaporation step from unsilicanized glass vials; these losses made this purification method unsuitable to a highly contaminated PM system. The degradation of aflatoxins in HPLC solvent was documented as a function of time. At 24 hours, 80% losses in AFG1 and AFG2 were detected; degradation
was prevented by addition of 1% acetic acid.
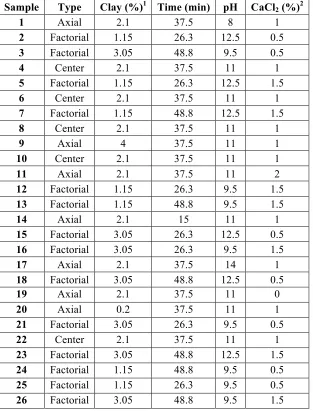
A central composite design study was used to optimize the extraction of protein and aflatoxin from PM aqueous dispersions based on four variables: NovaSilTM (a clay sorbent) (0.2 – 4%), calcium chloride (CaCl2) (0 – 2%), pH (8 – 14), and time (15 – 60 min). The
dispersion was centrifuged to isolate the soluble phase, and, after AflaTest® column
purification, aflatoxin was quantified on an HPLC equipped with a photochemical rector for enhancement detection system (excitation: 365 nm, emission: 440 nm). In soluble extracts, aflatoxin and protein ranged from 35 ng/g to 634 ng/g and 114 mg/g to 759 mg/g,
respectively, on a dry weight basis. The quadratic models for log10(AFB1+1) and protein had
excellent fits with R2 equal to .97 and .94, respectively. Soluble nitrogen had the strongest correlation with pH and significant quantities of peptides were produced at a pH > 12. CaCl2
showed a salting in effect for these alkaline hydrolysates and caused precipitation at lower pH values. AFB1 had strong positive correlations with pH and CaCl2. Furthermore, reversible
and irreversible degradation of AFB1 in soluble extracts was documented as a function of pH,
protein and minimize AFB1 concentration yielded conditions of 0% NovaSilTM, 2% CaCl2,
pH 10.88, 60 min and 1.11% NovaSilTM, 2% CaCl2, pH 6.0, 15 min, respectively. Isoelectric
precipitation from an optimized extract resulted in a ten-fold reduction of soluble protein. Manganese peroxidase (MnP) was used as a secondary processing step to degrade aflatoxin in the soluble fractions. Degradation of AFB1 in solutions could not be directly attributed to
Characterization and Processing of Aflatoxin-Reduced, Whole Protein Soluble Extracts from Aflatoxin-Enriched Peanut Meal Using Response Surface Methods
by
Elizabeth Sara Hecht
A thesis submitted to the Graduate Faculty of North Carolina State University
in partial fulfillment of the requirements for the Degree of
Master of Science
Food Science
Raleigh, North Carolina 2013
APPROVED BY:
__________________________________ Jack P. Davis
Chair of Advisory Committee
__________________________________ Lisa Dean
__________________________________ E. Allen Foegeding
ii
BIOGRAPHY
Elizabeth Sara Hecht received her undergraduate degree in chemistry and an additional concentration in biochemistry from Carleton College in 2011. During her
iii
ACKNOWLEDGEMENTS
I would like to thank Dr. Jack P. Davis for being an incredible mentor throughout my master’s program. His unwavering support of new research proposals and the overall
independence he granted me throughout this project was truly unique. I could not have grown as a researcher in the lab and as person without his guidance and expertise. I would also like to thank Dr. Brittany White for being an incredible resource on really all instrumental and analytical questions. This project could not have succeeded without your advice and
iv
TABLE OF CONTENTS
LIST OF TABLES ... vi
LIST OF FIGURES ... vii
CHAPTER 1: LITERATURE REVIEW: PEANUT MEAL PROTEIN AND AFLATOXIN CONTAMINATION ... 1
1.1.0 Introduction ... 1
1.2.0 Aflatoxin ... 2
1.2.1 Environmental factors influencing field levels of aflatoxin ... 2
1.2.2 Chemical properties of aflatoxin ... 3
1.2.3 Toxicology of aflatoxins ... 4
1.3.0 Aflatoxin quantification techniques ... 6
1.3.1 Purification of aflatoxin ... 6
1.3.2 Fluorescence-based assays ... 7
1.3.3 HPLC ... 8
1.4.0 Control of aflatoxin in peanuts ... 9
1.4.1 Pre-harvest control of aflatoxin in peanuts ... 9
1.4.2 Development of aflatoxin-resistant peanut lines ... 10
1.4.3 Post-harvesting control ... 11
1.4.4 Chemical control of aflatoxin ... 12
1.4.5 Processing control of aflatoxin ... 13
1.4.6 Biological control of aflatoxin ... 14
1.5.0 Enteroabsorbant control of aflatoxin ... 16
1.5.1 Chemical structure and binding characteristics of clays ... 16
1.5.2 Clay additives in animal feeds ... 18
1.5.3 Use of aluminosilicates in humans ... 20
1.6.0 Enzymatic control of aflatoxin ... 21
1.7.0 Peanut Meal ... 22
1.7.1 Peanut/peanut meal proteins ... 23
1.7.2 Peanut meal protein and aflatoxin ... 23
1.7.3 Value-added processing of peanut meal ... 23
1.8.0 Conclusion ... 24
1.9.0 Research Objectives ... 25
CHAPTER 2: QUANTIFICATION OF AFLATOXIN: METHOD DEVELOPMENT ... 27
2.1.0 Introduction ... 27
2.2.0 Results & Discussion ... 29
2.2.1 Extraction ratio of solvent to peanut meal ... 29
2.2.2 Optimization of a silica-gel clean-up procedure for HPLC analysis ... 30
2.2.3 Optimization of an immuno-affinity clean-up procedure for HPLC analysis ... 32
2.2.4 Degradation of aflatoxin samples in the HPLC ... 35
v
CHAPTER 3: EXTRACTION AND CHARACTERIZATION OF PROTEIN AND
AFLATOXIN FROM PEANUT MEAL USING RESPONSE SURFACE METHODS ... 37
3.1.0 Introduction ... 37
3.2.0 Methods ... 45
3.2.1 Materials ... 45
3.2.2 Experimental design ... 45
3.2.3 Dispersion preparation ... 47
3.2.4 Moisture analysis ... 48
3.2.5 Density analysis ... 48
3.2.6 Protein quantification ... 48
3.2.7 Protein characterization ... 49
3.2.8 Aflatoxin extraction and quantification ... 50
3.2.9 Enzyme solution preparation ... 50
3.3.0 Results ... 51
3.3.1 Quantification of aflatoxin ... 51
3.3.2 Dry fractionation of peanut meal ... 53
3.3.3 Protein and aflatoxin trends ... 54
3.3.4 Response surface modeling of aflatoxin ... 58
3.3.5 Response surface modeling of protein ... 61
3.3.6 Desirability functions for protein and aflatoxin ... 64
3.3.7 Predictive functions for protein and aflatoxin ... 66
3.3.8 Characterization of extracted peanut protein by SDS-PAGE ... 67
3.3.9 Enzymatic degradation of aflatoxin in protein-rich peanut meal extract solutions . 69 3.4.0 Discussion ... 72
3.5.0 Conclusion ... 78
vi
LIST OF TABLES
CHAPTER 2: QUANTIFICATION OF AFLATOXIN: METHOD DEVELOPMENT Table 2.1 Effect of 80:20 methanol: water solvent: peanut meal ratio on aflatoxin
quantification (n=4) ... 30 CHAPTER 3: EXTRACTION AND CHARACTERIZATION OF PROTEIN AND
AFLATOXIN FROM PEANUT MEAL USING RESPONSE SURFACE METHODS
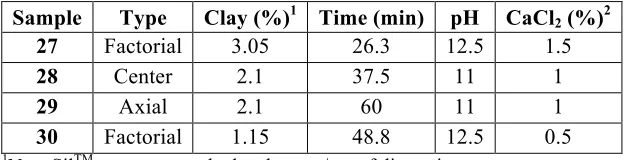
Table 3.1 Rotatable central composite design runs ... 46 Table 3.2 Proximate analysis of peanut meal fractions ... 54 Table 3.3 Mass balance, protein, and aflatoxin analysis of central composite design runs .... 56 Table 3.4 ANOVA and summary statistics for the linear, 4-way interaction, and fully crossed with quadratic effects model for Log10( AFB1+1) ... 58
Table 3.5 Coefficients for the Log10(AFB1+1) predictive quadratic equation and their
associated p-values (α = .05) based on the student’s t-test ... 59
Table 3.6 ANOVA and summary statistics for the linear, 4-‐way interaction, and fully crossed with quadratic effects model for protein. ... 61 Table 3.7 Final coefficients for the protein predictive quadratic equation with their associated
p-values (α = .05) based on the student’s t-test ... 62
vii
LIST OF FIGURES
CHAPTER 1: LITERATURE REVIEW: PEANUT MEAL PROTEIN AND AFLATOXIN
CONTAMINATION
Figure 1.1 Structures of aflatoxin in its four primary forms ... 3 Figure 1.2. Possible pathways for aflatoxin degradation by biological metabolism (Wu Q and others 2009) ... 5 Figure 1.3 Model of a smectite clay binding aflatoxin in the (a) dehydrated and (b) hydrated form (Deng Y and Szczerba M 2011). Na+ ions are in blue, oxygen molecules are in red, and water molecules are in grey ... 18 Figure 1.4 Diagram of pilot-scale process to extract protein hydrolysates from peanut meal (White BL and others 2013) ... 25 CHAPTER 2: QUANTIFICATION OF AFLATOXIN: METHOD DEVELOPMENT
Figure 2.1 Comparison of flow-through and eluent fractions generated from clean-up of peanut meal extract using FlorisilTM columns for aflatoxin analysis (n=6). 1 ml of crude extract was loaded onto columns and pulled through using a solid phase extraction vacuum manifold. Columns were washed with .5 ml of methanol: water (80:20, v/v), 0.5 mL of methanol, and then 0.5 mL of chloroform: methanol (90:10, v/v). These components
comprised the “flow through,” that were then evaporated with a nitrogen stream at 45 °C and
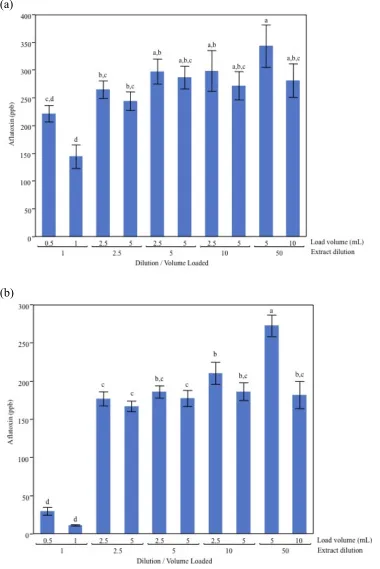
resuspended in 2 ml of methanol. The aflatoxin was eluted from the column with 3 ml of acetone/water/formic acid (96:3.7:0.3, v/v), evaporated with nitrogen, and resuspended in 2 ml of methanol. Samples were quantified on the HPLC ... 31 Figure 2.2 Losses of standard aflatoxin-mix post-evaporation and suspension in 63:37 water: methanol quantified on the HPLC ... 32 Figure 2.3 Effect of load volume and dilution of (a) 60:40 acetonitrile: water and (b) 80:20 methanol: water extracts purified on an AflaTest® column and quantified by HPLC ... 34 Figure 2.4 Degradation of standard mix in 63:37 water: methanol with time ... 35 CHAPTER 3: EXTRACTION AND CHARACTERIZATION OF PROTEIN AND
AFLATOXIN FROM PEANUT MEAL USING RESPONSE SURFACE METHODS
viii
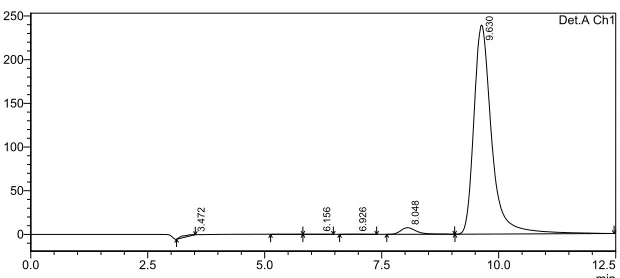
Figure 3.2 Figure 4.2. Ribbon diagram of MnP (Wong DWS 2009) ... 44 Figure 3.3 pH prediction profile based on amount of NaOH (g) added to aqueous peanut meal dispersions ... 47 Figure 3.4 HPLC spectrum of starting peanut meal, peaks from left to right include: baseline subtracted solvent (methanol/acetic acid), AFG2 (6.156 min), AFG1 (6.926 min), AFB2 (8.048 min), and AFB1 (9.630 min) ... 51 Figure 3.5 Quantification of AFB1 in the soluble fraction of a 35 g peanut meal/157.5 ml water dispersion (a) adjusted from a pH of 6.1 to 10.5 and normalized to the starting aflatoxin concentration (n=3) and (b) adjusted from a pH of 6.1, to 11.5, and back down to 6.1 (n=3). ... 53 Figure 3.6 Protein vs. aflatoxin of central composite design runs. Samples with ≤ 1.40%
NovaSilTM or ≥ 2.06% NovaSilTM are labeled “low clay” or “high clay”, ≤ 2% CaCl2 or ≥
2.05% CaCl2 are labeled “low CaCl” or “high CaCl,” and pH ≤ 11.9 or ≥ 12.0 NovaSilTM are
labeled “low pH” or “high pH,” respectively ... 57 Figure 3.7 Plots of total soluble protein vs. (a) total solids and (b) density. Sample number 14 was removed as an outlier for both plots ... 57 Figure 3.8 (a) AFB1 distribution for central composite design data points, and diagnostic plots for AFB1 logarithmically transformed data: (b) residuals plot, (c) studentized residuals plot, and (d) actual versus predicted response variables by the quadratic equation including all interaction terms, dotted lines show the 95% confidence interval for predicted values .... 60 Figure 3.9 Quadratic equation diagnostic plots for protein: (a) residuals plot, (b) studentized residuals plot, and (c) actual versus predicted response variables, dotted lines show the 95% confidence interval for predicted values ... 63 Figure 3.10 Desirability functions for (a) Log10(AFB1+1) minimized and (b) protein
maximized. Each plot uses a red crosshair to indicate the point (specified value under each plot) at which a parameter is maximized for desirability. 95% confidence intervals are plotted by the blue dashed lines. The desirability plot shows the desirability value predicted by its function at a given Log10(AFB1+1) or protein concentration ... 65
Figure 3.11 SDS-PAGE gels of central composite design runs loaded with 20 µg of protein
ix
Figure 3.13 SDS PAGE gels of samples 1 and 2 with no treatment, enzymatic treatment, and cofactor treatment. It is important to note gel distortion is attributable to use of an expired gel by 29 days ... 71 Figure 3.14 Interaction plots for (a) aflatoxin and (b) protein over the factor ranges:
NovaSilTM (0.2-3.9%), CaCl2 (0-2%), pH (8.1-13.1), and Time (15-60 min). The blue line on
each plot is the maximized value for a given parameter, 3.9%, 2%, 13.1, and 60 min for NovaSilTM, CaCl2, pH, and time, respectively. The red line on each plot is the minimized
value for a given parameter, .2%, 0%, 8.1, and 15 min for NovaSilTM, CaCl2, pH, and time,
CHAPTER 1: LITERATURE REVIEW: PEANUT MEAL PROTEIN AND AFLATOXIN CONTAMINATION
1.1.0 Introduction
In 2012, 12.5% of the global population was estimated to be undernourished; simultaneously, pressure has been placed on agriculture to increase the nutritive quality, sustainability, and quantity of foods generated to meet a rising world population and address food security concerns (FAO and others 2012). The Food and Agricultural Organization (FAO) also estimates that each year, approximately 25% of crops are diseased by fungi and damaged by mycotoxins. Though mycotoxins are an unavoidable problem and occur
naturally, better agricultural management practices and post-harvest amelioration strategies, particularly in developing countries, can help salvage existing food supplies and limit malnutrition.
Mycotoxins are the toxic secondary metabolites secreted by various soil and airborne fungi (Horn BW 2005). Many different types of mycotoxins are produced, including
2
defenses, and opportunity (Bhat R and others 2010). The two most susceptible areas in plants for invasion are those already damaged from the natural environment or in the seeds (Abbas HK and others 2009).
Of all mycotoxins, aflatoxins are considered one of the most toxic metabolites and are regulated in over 100 developed countries (van Egmond HP and others 2007). In 1993, aflatoxin B1 (AFB1) was officially listed as a group I human carcinogen (IARC 1993). In the
US, total aflatoxin levels in the food supply are required to be less than 20 ng/g, while in Europe, it is set at less than 4 ng/g (Gnonlonfin GJB and others 2013). In developing countries, aflatoxin contamination is a major problem, resulting from poorly enforced legal limits and limited infrastructure to reduce and detect fungal contamination (Groopman JD and others 2008). Consequently, in at least five different African countries, human subjects tested positive for aflatoxin markers at a rate of at least 98% (Gnonlonfin GJB and others 2013).
1.2.0 Aflatoxin
1.2.1 Environmental factors influencing field levels of aflatoxin
Aflatoxins are produced primarily by two species of Aspergillus: A. parasiticus and
A. flavus. These metabolites are synthesized using cofactors and enzymes that are part of a
3
of 3.5 – 8.0 (Wareing P and Fernandes R 2007). Aflatoxin may be synthesized by A. flavus at a water activity as low as 0.82(Sweeney MJ and Dobson ADW 1998). Drought and heat exacerbate aflatoxin production, as these conditions weaken and damage plants, reducing their natural defenses (Sanders TH and others 1985; Holbrook CC and others 1994; Holbrook CC and others 2000; Girdthai T and others 2010). Furthermore, drought conditions are also associated with higher temperatures in the soil and leaves, which is correlated with increased aflatoxin production (Holbrook CC and others 1994; Guo BZ and others 2008).
1.2.2 Chemical properties of aflatoxin
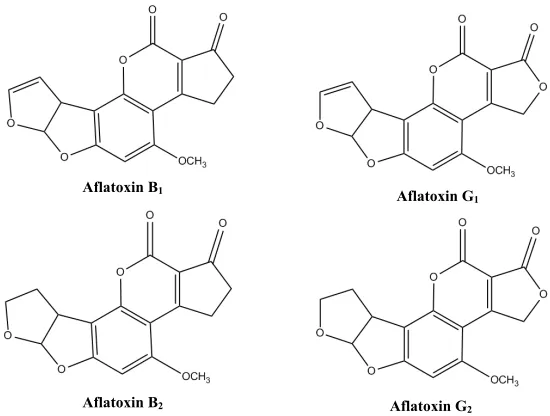
The four most prevalent types of aflatoxin are named B1 (AFB1), B2 (AFB2), G1
(AFG1), and G2 (AFG1), (Figure 1.1). All are formed from a basic difuranocoumarin
structure (Sweeney MJ and Dobson ADW 1998). The nomenclature was developed to stand for the color, blue or green, of photonic emission of the molecules after UV excitation.
Figure 1.1. Structures of aflatoxin in its four primary forms.
Aflatoxin B1
Aflatoxin G2
Aflatoxin B2
4
1.2.3 Toxicology of aflatoxins
Aflatoxin was first identified for its toxigenic character during an outbreak of “Turkey X” disease in England in 1961 that was ultimately attributed to the presence of this compound in the peanut meal component of turkey feed (Richard JL 2008). Shortly
thereafter, the first in vitro and in vivo characterization of the toxicity of these molecules was completed by Chang, Kader, Wick, and Wogen in 1963, where ducklings were fed doses of aflatoxin over eight days. Duck toxicity was evidenced by overall depressed growth and poor liver health, reflected by its reduced weight and the appearance of histopathologic lesions (Chang SB and others 1963). AFB1 has since been declared a group I carcinogen in 1993 by the World Health Organization (IARC 1993).
Of all aflatoxins, AFB1 and AFG1 are the most toxic (Khlangwiset P and others 2011). The toxigenic properties are derived primarily from the lactone ring. When aflatoxin was reacted with ammonia to achieve an open-ring structure, the derived metabolite, tested in chick embryos, was approximately 450 times less mutagenic and 18 times less toxic (Lee LS and others 1981). This may be chemically explained by aflatoxins’ susceptibility to form the highly reactive 8,9 epoxide (Wu Q and others 2009). Biologically, AFB1 may react in four different pathways (Figure 1.2): epoxidation (often initiated by the liver enzyme p450) and hydroxylation are likely to lead to highly toxic, mutagenic, and carcinogenic products, and O-dealkylation and ketoreduction are likely to result in non-toxic or mostly harmless byproducts (Wu Q and others 2009).
Aflatoxin M1 (AFM1) is produced by the hydroxylation reaction (Wu F and others
5
dairy milk to levels less than 0.5 ng/g (FDA 2005). The metabolites can react further and conjugate to DNA, forming adducts at the N7-guanine, or to proteins, particularly at
methionine, lysine, and histidine sites, which results in toxicity (Roebuck BD 2004; Hanioka N and others 2012; Yang XJ and others 2012). Non-toxic byproducts generally only result if metabolites become conjugated to nucleophilic molecules, such as glutathione, though these events are not as kinetically favored (Wu Q and others 2009).
Figure 1.2. Possible pathways for aflatoxin degradation by biological metabolism (Wu Q and others 2009).
Biological degradation of aflatoxins 5
multienzyme
AFB1 AFB1-epoxide
AFB1-dihydrodiol O O O O O HO HO O O O OCH3 O O O O O O O HO HO
opening the difuran ring
O O
O
OCH3
OCH3 OCH3
O O
O
Figure 3. Proposed pathway of degradation of AFB1 by Armillariella tabescens.
O O O OH O O O O
Covalent bonds with nucleic acids or Schiff base formation with cellular and microsomal proteins (guanine, methionine, histidine)
toxity
Conjugation with soluble nucleophilic molecules (glutathione, glucuronides, sulphonides etc.)
detoxification
aflatoxin Q2
O O O O O O OH HO O O O OCH3 OCH3 OCH3
OCH3 OCH
3 OCH3 OCH3 OCH3 OCH3 OCH3 HO HO OH O O O O O O OH HO O O O OH O O O OH O O O HO O O O OCH3 OH O O O OH OH O O O O O O O O O O O O O O O O O O O O O O O O O O O hydroxylation dialdehyde
phenolate AFB1dialcohol
AFB1-8,9-dihydrodiol
AFB1-8,9-epoxide
aflatoxin M2
aflatoxin P2
AFB2 AFB1
aflatoxin Q1
aflatoxin M1
aflatoxin B2a
aflatoxin P1
O-dem ethylation
aflatoxicol (AFL)
aflatoxin H1 (AFH1)
AFL dehydrogenase AFB1 reductase
6 1.3.0 Aflatoxin Quantification Techniques
1.3.1 Purification of aflatoxin B1
Most protocols for quantification of aflatoxin rely on a series of steps to remove interfering compounds. One of the most popular cleanup procedures relies on antibodies to isolate aflatoxin from its matrix. Immuno-affinity columns use a gel scaffold to bind
antibodies, which will subsequently bind aflatoxin as the crude material flows through. After washing, the aflatoxin can be eluted by a solvent for which it has a high affinity, such as methanol. The Journal of AOAC International has approved this method, originally proposed in 1990, for official use, and columns are commercially available, such as those under the name AflaTest® (Patey AL and others 1990; Trucksess MW and others 1991; VICAM 1999).
Other protocols validated for aflatoxin cleanup generally involve silica-gel columns. These were first approved for use by the AOAC in 1977 (Shotwell OL and Goulden ML 1977). Since then, these procedures have been streamlined to minimize the number of protocol steps and improve their efficiency. In one of the most recently published papers, FlorisilTM columns were used to bind aflatoxins via magnesium cations embedded in a silica
matrix. Background molecules in the crude extract are washed off with a series of three solvents, with decreasing polarity, ending with chloroform, before elution with an
7
1.3.2 Fluorescence-based assays
Just as various cleanup columns take advantage of aflatoxins immuno-affinity properties, a variety of assays have been developed using this property to directly quantify aflatoxin. Enzyme-linked immunosorbent assay (ELISA) are commonly used in research and industry to quantify aflatoxin. These assays have a detection limit of about 1 ng/g total aflatoxin (Trombley A and others 2011). Generally, aflatoxin purified from a sample
competes with an aflatoxin-horseradish peroxidase enzyme conjugate to bind to a well-bound aflatoxin-antibody. The wells are subsequently coated with anti-rabbit IgG binding antibody, and the amount of blue color produced (determined by an absorbance assay) is proportional to the amount of aflatoxin. In one of the most recent AOAC International ELISA protocols, peanut paste quantified using this protocol showed recoveries of 73-100%. Furthermore, the data correlated well (R2 = 0.99) with high pressure liquid chromatography (HPLC) data. While the ELISA does offer speed and a low detection limit, it provides only a total aflatoxin value (Trombley A and others 2011). As this value depends on the sum of the fluorescence of all aflatoxin present, it is important that the standard contain a similar
AFB1:AFB2:AFG1:AFG2 ratio to the sample, as this is a source of potential extra random error (Trombley A and others 2011).
In a similar type of analysis, a fluorometer can measure purified aflatoxin and report a total aflatoxin value (VICAM 2010). The VICAMTM fluorometer is one of the most
8
do not provide the exact method/equation for calculating aflatoxin.
1.3.3 HPLC
Over the last two decades, numerous HPLC procedures to quantify aflatoxin have been published. HPLC is often preferred over other quantification techniques because it can measure each type of aflatoxin individually, versus a total aflatoxin count, and has improved sensitivity. Methods vary in the type of pre-column cleanup method, solvents used, type of HPLC column, and detection techniques. Recently, data from six inter-laboratory
certification studies, of which three were conducted in the early 1990s and three in the late 2000s, for peanut butter, peanut meal, and animal feed studies were re-evaluated and compared by Garhard Buttinger, part of the Institute for Reference Materials and
Measurements (IRMM), Joint Research Centre, European Commission (Buttinger G 2010). All methods showed virtually identical recovery rates, between approximately 70-110%, for both spiked and naturally contaminated substrate. Nearly all labs used reverse phase HPLC, with variation occurring in extraction solvent (methanol, acetonitrile, or chloroform based), cleanup column (immuno-affinity or silica-gel), and type of derivitization for detection (halogenation or tri-fluoroacetic acid). In peanut meal, the limit of detection improved ten times and the root mean squared deviation was approximately 30% better over the course of twenty years (Buttinger G 2010). The author concludes by stating that technology
advancements across the field have improved reproducibility, sensitivity, cost, and efficiency (Buttinger G 2010).
post-9
derivitization technique uses UV light to alter the aflatoxin structure to one that can excite at 365 nm and emit at 435 nm (Joshua H 1993). Unlike tri-fluoroacetic acid or halogenation derivitization, which disrupts the double bond of the dihydrofuran moiety by adding a hydroxyl group, this procedure is easier to carry out (though not necessarily more efficient) and minimizes the background matrix by exciting the aflatoxin at a relatively uncommon wavelength using a mercury lamp (Joshua H 1993). When compared to other derivitization techniques, such as bromination or iodination, there was no significant difference in reported aflatoxin values, and it was thus incorporated into AOAC methods in 2006 (Waltking AE and others 2006).
1.4.0 Control of aflatoxin in peanuts
Mycotoxin contamination of peanuts, like many legumes, is an unavoidable problem that may be managed through good agricultural practices and post-harvest methods. The success of these practices has made aflatoxicosis in humans an obsolete illness in most developed countries. However, the success of these practices is estimated to cost $0.5 – $1.5 billion each year in the US (Lamb MC and Sternitzke DA 2001) and represents yet another loss of food-grade protein.
1.4.1 Pre-harvest control of aflatoxin in peanuts
10
in fact increase contamination instead of limit occurrence (Holbrook CC and others 1994). Harvesting early, before peak pod maturation, particularly in drought conditions, can be helpful if harvesting occurs before the aflatoxin is produced in the first place. In Australia, an aflatoxin risk-prediction website helps farmers choose the ideal harvest date based on
environmental data (Queensland Government 2012). Furthermore, crop rotation of resistant crops (such as wheat) with peanut can help minimize Aspergillus from spreading year-to-year (Kabak B and others 2006).
1.4.2 Development of aflatoxin-resistant peanut lines
Plant breeding of peanut aims to create an A. parasiticus and A. flavus resistant plant. To date, no viable A. flavus resistant lines have been developed that are also able to meet growers’ demand for high yield crops. Strategies have primarily centered on crossing certain lines that demonstrate good natural defenses against drought and other environmental
11
1.4.3 Post-harvesting control
Despite the best agricultural practices, some aflatoxin contamination is inevitable at harvest, especially in years with high heat and/or drought. Accordingly, post-harvest control practices are the next major stop point to preventing aflatoxin contamination in the food supply. While it is important to control pre-harvest contamination, it is as important to segregate those that have become contaminated. At peanut buying points, locations that farmers bring their crops for sales, all lots are sampled under USDA supervision and
inspected visually for fungal contamination. Because of the difficulty associated with evenly sampling a lot, and the propensity for small, random pockets of high aflatoxin, about 200 lb. is sampled per load (Whitaker TB 2003). This sample is also used to determine the grade of peanuts. Any lot with even one peanut visually contaminated with fungus is entirely directed for oil stock. As damaged, small, and dislodged peanuts have increased risk for aflatoxin, screening by size and density is completed after lot-segregation by the sheller (Dorner JW 2008). Finally, the best technique to identify peanuts concentrated with aflatoxin is to blanch the nuts, and then sort kernels electronically post-shelling. This method can result in about a 90% reduction in aflatoxin (Cole R and others 1995). The composite of peanuts identified as aflatoxin contaminated, damaged, or of too small grade is diverted to oil stock. Aflatoxin does not fractionate in the food-grade oil produced, and is concentrated in the insoluble byproduct remaining. This material, referred to as peanut meal, is the low-oil, high protein (typically ~50% wt.) byproduct of this process.
12
maintained at safe levels. It has been determined that A. flavus will not invade peanuts in storage with a moisture of 7% or less (in equilibrium with a relative humidity of 70% or less) (Bulaong SSP 2002).
1.4.4 Chemical control of aflatoxin
13
1.4.5 Processing control of aflatoxin
Although there are a number of options, due to high capital costs, very few processing techniques, besides ammoniation, are employed in industry for the directed purpose of
degrading aflatoxin. Gaseous ozonation, for example, can achieve reductions in aflatoxin levels in peanut meal extremely quickly. After 10 minutes at 75 °C, peanut kernels (spiked at
20 ng/g) and peanut flour showed a 77% and 50% aflatoxin reduction, respectively (Proctor AD and others 2004). However, its disadvantages include cost and a dearth of toxicity studies related to its byproducts (Proctor AD and others 2004). Thermal applications are practical but the least efficient in independently achieving significant aflatoxin reductions. To achieve a 78% AFB1 reduction from a 237 ng/ml spiked sample, researchers had to hold peanuts at 150
°C for 120 min (Arzandeh S and Jinap S 2011).
14
Irradiation has also been considered for mycotoxin decontamination. Though there continues to be consumer backlash against irradiated foods, it nevertheless remains a safe tool up to an energy level of 5 MeV and 10 MeV for electrons or x-rays, respectively, generated from machines, to sterilize foods (FAO 2003). While many mycotoxin-irradiation studies have been published on other crops, few have directly involved the peanut. In one recent 2008 study, a 106 spore culture of A. flavus was inoculated on peanuts for a period of
10 days at 27°C and subsequently subjected to gamma radiation from a 60Co radiation source
(1.440 kGy/hr dose rate). At the maximum dose of 10 kGy, peanuts with an initial aflatoxin level of 16 ppm, saw a 58% reduction in aflatoxin levels (Ghanem I and others 2008). However, like that of ozone technology, radiation techniques tend to have high associated costs. Furthermore, radiation degradation of mycotoxin is highly dependent on the crop or food-source (Ghanem I and others 2008). Irradiation can also result in undesirable reactions in the peanut such as lipid oxidation (Mexis SF and Kontominas MG 2009).
1.4.6 Biological control of aflatoxin
In model systems, antifungals produced in vitro by a variety of lactic acid bacteria (LAB) and Bacillus sp. have been shown to be successful at decreasing the Aspergillus
population grown on media. These antifungals include various peptides, polyphenols, and various acids (Kugler M and others 1990; Roy U and others 1996; Munimbazi Cl and Bullerman L 1997; Munimbazi and Bullerman 1998). Generally, these antifungals are
considered to be highly stable, and those from Bacillus pumilus were shown to maintain their structure/function up to 121°C for 15 min and between a pH of 2 - 10 (Munimbazi and
15
parasiticus (106-107 spores per culture) inhibited aflatoxin production by 93% on culture
plates (Munimbazi and Bullerman 1998).
Another strategy has focused on identifying bacteria and yeasts that can directly bind and sequester any aflatoxin secreted. Two strains of Lactobacillus rhamnosus were the first reported to behave through such a mechanism, and have thus been most thoroughly studied both in vitro and in vivo (El-Nezami H and others 1998). Aflatoxin binds directly to the cell wall polysaccharide and peptidoglycan, which, depending on the strain, can be a reversible or irreversible reaction depending on the solvent matrix (Haskard CA and others 2001; Lahtinen SJ and others 2004). Yeast has long been known to control against various mycotoxins through its role in beer fermentations (Scott PM and others 1995). Different species such as
S. cerevisiae and Candida krusei were found to bind greater than 60% (w/w) of toxins in
vitro (Shetty PH and Jespersen L 2006).Like LAB species, mycotoxins are predicted to bind
to the yeast cell walls. However, yeast species are less strain-specific and bind primarily through their mannan components (Shetty PH and Jespersen L 2006).
Another biologically based strategy that has been investigated is competitive
exclusion, an extremely promising recent advancement. The principle of this method, which has been successful with other crops such as cotton, is that other fungi, bacteria, and yeast that do not secrete toxins can outcompete A. flavus for resources (Dorner JW 2008). In peanuts, a number of select Aspergillus sp. lines have demonstrated effective control of A.
flavus and A. parasiticus in the laboratory. However, only fieldwork can truly assess the
16
over two years. In the treated versus untreated plot, 27% compared to 80% of isolates, respectively, were toxigenic at pod maturation. At harvest, however, this difference was eliminated, and both groups were equally contaminated. Only under drought and high heat field conditions did this treatment confer a significant protective effect, with strain-treated groups averaging 71% less aflatoxin (Alaniz Zanon MS and others 2013). This study
demonstrated the aggressive nature of A.flavus strains under normal conditions, and showed that it can only be out-competed under harsh conditions. Though this line of research has been conducted in the hopes of identifying an effective biological control and eventually introducing “helpful” strains in the fields through the use of sprays and pesticides, this strategy has not seen widespread use to date.
1.5.0 Enteroabsorbant control of aflatoxin
Evidence of the efficacy of clay sorbents to remove AFB1 from substrates was demonstrated as early as 1979 (Masimango N and others 1979). These sorbents are most commonly used as feed additives, where they actively sequester aflatoxin in the
gastrointestinal tracts of animals and are excreted in a bound form. The aflatoxin-clay complexes are biologically unavailable, preventing toxic effects (Kabak B and others 2006). Since that time, hundreds of papers have sought to study the safety of clays for animal and human use, synthesize more efficient sorbents, develop industrial scale processes, and use clays for animal feed improvement (Mishra HN and Das C 2003).
1.5.1 Chemical structure and binding characteristics of clays
17
and smectites. While all of these clays are primarily composed of montmorillonite (a type of phyllosilicate clay) and have high surface area, they differ in the type of ions they contain, the spacing of their molecular sheets, and the number of layers (West AR 1999).
Commercially, these clays are sold under names such as NovasilTM plus or Astra Ben 20A and generic names such as Na2+-bentonite or zeolite, for example. The basic structure of aluminosilicates is built from SiO4 tetrahedra, and the Si:O ratio may be used to translate the
precise conformation. Within the clay, certain Si4+ ions are substituted for by Al3+ ions and an additional ion such as Na+, K+, or Ca2+ that fills an open octahedral site to balance the charge (West AR 1999). Metal ions within the aluminosilicate clay chelate to the dicarbonyl groups of AFB1 (Arvide MGT and others 2008; Deng Y and Szczerba M 2011). While tangential binding to the clay surface does occur in a single layer, a majority of the AFB1 molecules are absorbed between the layers of smectite and thus are highly heat resistant and stable over a wide pH range (Arvide MGT and others 2008; Deng Y and others 2010). In hydrated smectite clay, as the aflatoxin binds in the interlayer space, about 50% of the ions migrate to the outer edge of the clay or into the solution, and the resulting clay that contains AFB1-H2O bridged bonds is approximately 14% wider (Figure 1.3) (Deng Y and Szczerba M
2011). Finally, the type of cation used to dope the clay highly affected the aflatoxin binding ability of the clay based primarily on charge/radius ratio, with Mn2+, Mg2+, Ca2+, Na+, then K+ showing the strongest interactions.
18
and desorption are heavily influenced by the cation with the clay and pH of the system (Harter RD and Stotzky G 1971; Ralla K and others 2010). Interestingly, whole proteins, versus peptides, were shown to bind with a higher affinity to these clays. Researchers
proposed that large oligomers or aggregates could in essence prop open the clay and increase the amount of protein binding in the inter-layer space, versus surface region (Harter RD and Stotzky G 1971). However, they also saw that proteins of too large molecular weight could be limited in binding from steric hindrance (Harter RD and Stotzky G 1971). Furthermore, this effect was concentration dependent, with a 1:5 milk protein: clay ratio required to see binding (Harter RD and Stotzky G 1973).
Figure 1.3 Model of a smectite clay binding aflatoxin in the (a) dehydrated and (b) hydrated form (Deng Y and Szczerba M 2011). Na+ ions are in blue, oxygen molecules are in red, and
water molecules are in grey.
1.5.2 Clay additives in animal feeds
Aluminosilicates and similar types of clays were originally introduced into animal feeds as a flow agent and are still used today for this purpose; however, it was quickly noticed that these additions resulted in animals that were less sickly and had better growth methyl group (CH3). The calculated surface electrostatic potential was
consistent with the AfB1 crystal structure determined by X-ray
diffraction (van Soest and Peerdeman, 1970a, b): two AfB1molecules
were linked together by H-bonds between the carbonyl oxygen of one molecule and the other's methyl group. The surface electrostatic distribution indicated that the two carbonyl oxygen should be the most important reaction sites when AfB1 coordinated with the
positively charged exchange cations in smectite. The two dihydrofuran oxygen (position c inFig. 1) were the next possible reacting sites for the exchange cations.
3.3. Molecular dynamics simulation
Molecular dynamics simulation of dehydrated AfB1–Na–Sm complex
revealed that exchange Na+cations migrated to the basal surfaces of
smectite whereas AfB1 molecules remained in the centers of the
interlayer spaces (Fig. 3, a1). The major plane of AfB1 lay parallel to
smectite basal surfaces. The dehydrated AfB1–Na–Sm complex had a
1.33 nm basal spacing, which was close to the experimentally measured value of 1.28 nm from the synthetical AfB1–Na–Sm complex at 0%
humidity. The minor difference was likely due to incomplete saturation
of AfB1in the synthesized complex. In the moist AfB1–Na–Sm complex,
the major plane of AfB1slightly tilted toward smectite basal surfaces
(Fig. 3, b1). H2Ofilled the space between Na+ions, AfB1, and smectite
surfaces. The simulated moist AfB1–Na–Sm complex was expanded to
1.52 nm in basal spacing. Experimental measurements of the synthe-sized AfB1–Na–Sm complex had a basal spacing of 1.3 nm at 51%
humidity and of a more varied basal spacing of 1.4–1.6 nm at nearly 100% humidity. The assumed 10% (mass) moist content in the computation was probably equivalent to a humidity close to 100%.
The molecular dynamics simulation illustrated that the carbonyl oxygen closely approached the exchange Na+ions (the A
1and A2types
inFig. 3, a2). Most AfB1molecules interacted with the exchange cations
by docking one exchange cation into two carbonyl oxygen (the A1type),
a few of them through individual interaction between one of the two carbonyl oxygen with one cation (the A2type). The molecular dynamics
simulation also suggested that some dihydrofuran oxygen were in close proximity to the exchange cations (the C type). Interactions between Na+and other AfB
1oxygen atoms (e.g., the B type) were of much less
importance. In the moist AfB1–Na–Sm complex (Fig. 3, b2), all the above
bonding types were observed. Moreover, interactions between the AfB1
oxygen and water molecules (H-bonding) were common. Many of the carbonyl oxygen and dihydrofuran oxygen were in direct contact with both water molecules and Na+ions. Each Na+ion was surrounded by
different numbers of water molecules.
The radial distribution functions offered a more quantitative estimation of the bonding probability. In the dehydrated AfB1–Na–Sm
complex, the Na+ions were coordinated mainly to the carbonyl oxygen
with a bond length of 2.3 Å (Fig. 4a, solid line). Direct interactions between Na+ions and the dihydrofuran oxygen with an average bond
length of 2.4 Å were also important (Fig. 4a, dashed line). In the moist
AfB1–Na–Sm complex, the Na+ ions were mainly bonded to water
molecules (Fig. 4b, dashed grey line), which suggested that cation hydration expelled AfB1molecules from Na+ions. The carbonyl oxygen,
however, also had nearly the same probability as H2O to coordinate to Table 1
Energy analysis of Na–and Mn–AfB1complexes coordinated at positionsa,b, andcas shown inFig. 1.
Cation Position PCM* energy (kcal/mol) Portion (%)
at equilibrium
Absolute Relative
Na a −796,163.7 0.0 96.3
b −796,159.7 4.0 3.3
c −796,157.0 6.6 0.4
Mn a −1,416,390.9 0.0 99.8
b −1,416,383.2 7.7 0.2
c −1,416,369.3 21.6 0.0
*PCM: polarizable continuum model
a1) Dehydrated (side view)
a2) Interlayer Na and AfB1 (top view) b2) Interlayer Na, AfB1 and water (top view)
b1) Moist (side view)
Smectite layer Smectite layer Smectite layer Na AfB1 H2O
}
}
1.33 nm 1.52 nm
C C A2
C B C B
C C C C C C
C B H
H H
H
C HH H H H H H H H CH C H H H H C C H C H H H H A2 A2
A1
A1 A2
A2
A1
A1
A2 A2
A1
A2
A2
A2 A1
A2 A2
A2
A2
A1
A1
Fig. 3.Optimized structures from molecular dynamics simulation of dehydrated (a1 and a2) and moist (b1 and b2) AfB1–Na–smectite complexes. Top images are side views of the complexes and bottom images are top views of the interlayer Na, AfB1and water molecules.
19
performance (Jaynes WF and Zartman RE 2011). Even today, though clays are not federally approved for use in feeds as a growth agent, they are consistently added under the title of a flow agent to achieve these benefits (Jaynes WF and Zartman RE 2011). Of all animals, poultry and turkeys are most sensitive to aflatoxicosis. In 1987, a study by Timothy Phillips and others looked at the ability of clays to bind aflatoxin in vitro and within Leghorn chicks. It was showed that although various clays had different efficacy levels, of the 38 aluminas, zeolites, silicas, phyllosilicates, and modified-phyllosilicates tested in vitro, all significantly reduced the amount of 3H-AFB1 available from an aqueous solution (Phillips TD and others 1988). From this group, hydrated sodium calcium aluminosilicate (HSCAS), had reduction efficiencies of over 80%, and was selected for the in vivo chick studies. This was one of the first tests to show that not only did the clay improve body weight growth factors
significantly, but it had anti-hepatocarcinogen effects; chicks treated with aflatoxin-feed supplemented with HSCAS had healthy livers versus those without, who had “friable and pale” livers (Phillips TD and others 1988). It also hinted at the remarkable ability of these clays to, as is now known, bind aflatoxin within the gut strongly enough to eliminate its bioavailability.
20
others 1998). Aflatoxin was introduced to one treatment group at 2 ppm by gavage between days 6 to 13. Maternal body weights and feed intake of HSCAS-treated rats were comparable to the control, whereas 64% of those fed diets with only aflatoxin died. Of those who
survived, 50% had 100% embryonic resorptions, and of the group, only three fetuses, with significantly lower body weights, survived. None of these effects were seen in the group given feed containing AFB1 and HSCAS. Furthermore, all histological signs in the liver and kidney of aflatoxicosis were eliminated with inclusion of HSCAS. This paper lent further support to gastrointestinalbinding of aflatoxin in the gut of the animals by HSCAS, as levels of AFM1 (a metabolite derived from AFB1 after processing in the liver) detected in the urine was significantly decreased (Mayura K and others 1998). A follow-up study in 2005 looked at the health effects of adding NovaSilTM independently to the diet of male and female
Sprague-Dawley rats over a period of six months, the longest-term study in animals to date (Afriyie-Gyawu E and others 2005). The differences in organ weights and organ
abnormalities at necroscopy, various hematological parameters, and serum biochemistries were examined. While there were very slight significant differences found in certain serum biochemistries, none suggested that NovaSilTM could be considered to be toxic or harmful
when ingested (Afriyie-Gyawu E and others 2005).
1.5.3 Use of aluminosilicates in humans
21
a peanut producing country, and it has large reserves of clay deposits (Phillips TD and others 2008). After two weeks, the clay was tolerated by all participants, with some gastrointestinal side effects in 25% of the group. Most importantly, hematological analysis of the blood and serum levels of vitamins A and E were not significantly different in patients pre and post study (Wang JS and others 2005).
As a follow-up, researchers conducted a 3-month double-blind placebo trial in 2007 in Ghana to further assess the biochemical effects of ingested clay on biomarkers of
aflatoxicosis (Wang JS and others 2005). Participants were considered healthy, but all initially had serum AFB1-albumin adduct levels > 0.5 pmol AFB1 mg-1 albumin. After three months, a significant decrease in the biomarkers of aflatoxin exposure were documented for groups treated with a high dose (1.5 g/day) and low dose (.75 g/day) of NovaSilTM compared
to a placebo group. Though some significant differences in blood chemistries were documented, such as overall levels of strontium and vitamin E in males, overall, the treatment was considered a safe and cost-effective way to treat aflatoxicosis arising from contaminated aflatoxin agricultural products in developing countries (Afriyie-Gyawu E, Ankrah NA, and others 2008; Wang P and others 2008).
1.6.0 Enzymatic control of aflatoxin
22
capacity for genetic modifications in lab environments (Lomascolo A and others 2011). In 2010, Wang and others investigated the detoxification of aflatoxin by MnP. In pure solutions, about a 70% reduction in the concentration of AFB1 was achieved after ~13 hours of
incubation at 5 standard units of catalytic activity of purified MnP (Wang J and others 2011). Likewise, the mutagenic activity, assessed using the umu operon test, was reduced
approximately 50% in a 5 nkat or 70% in a 20 nkat MnP system (Wang J and others 2011). Earlier studies using horseradish peroxidase, a cheap and highly available enzyme, achieved 30-50% reductions in aflatoxin spiked peanut meal (Das C and Mishra HN 2000). While spiked studies are flawed in that they do not account for interaction effects between the matrix (primarily native proteins) and aflatoxin, they do provide a foundation for future work.
1.7.0 Peanut meal
23
moisture (~10%), and high protein (~50%) material. Our lab and others have developed a number of techniques, reviewed in section 1.7.3, to add value to peanut meal via processing to isolate protein while minimizing aflatoxin.
1.7.1 Peanut/Peanut meal proteins
Peanuts contain a distribution of proteins grouped generally by size and solubility into two fractions, albumins and globulins. Within the globulin family, proteins are grouped into the arachin or conarachin family (Arthur JC 1953). Peanut proteins are considered to have a good amino acid profile, though lacking in methionine and lysine, and will precipitate at a pH of approximately 4.5 (Pattee HE and Young CT 1982).
1.7.2 Peanut meal protein and aflatoxin
Sequestration of aflatoxin from peanut proteins is hindered by the natural affinity of peanut proteins for aflatoxin (Mishra HN and Das C 2003). As already mentioned in the discussion regarding the toxigenic and carcinogenic properties of aflatoxin, it has a high affinity for histidine, methionine, and lysine sites (Roebuck BD 2004). Specifically in peanuts, direct interaction of aflatoxin with the arachin, conarachin I and conarachin II fractions has been detected in vitro at temperatures as low as 26°C with binding constants
between 3.5-23 M-1 (Monteiro PV and others 1996)
1.7.3 Value-added processing of peanut meal
Extensive work has been completed in our lab to isolate enzymatically hydrolyzed peanut protein from peanut meal while simultaneously sequestering aflatoxin with
24
were prepared with commercial brand AB20 clay (for aflatoxin binding) and proteases (to maximize the amount of soluble protein/peptide). From this dispersion, two phases were prepared: an insoluble phase containing aflatoxin bound AB20 complexes and other
insoluble constituents, and a soluble phase of protein/peptide, dissolved nutrients, and some remaining free aflatoxin. With this method, Seifert and others (2010) reduced the level of available aflatoxins from an initial 110 ng/g to levels less than 20 ng/g in the final soluble protein hydrolysate rich extract on a dry weight basis (Seifert LE and others 2010). As the aflatoxin reduced hydrolysate fraction is most valuable, Oakes and others (2012) built on this work and developed a spray-dry process to isolate the hydrolysates in a powder form.
Maltodextrin was required for processing reasons and powders with up to 26.4% protein were achieved (Oakes AJ and others 2012). Further work by White and others (2012)
investigated the adaption of this method at the pilot scale for contaminated peanut meal (191 ng/g) (Figure 1.4) (White BL and others 2013). Aflatoxin levels were reduced to less than 20 ng/g for all soluble fractions, with NovaSilTM significantly more effective in sequestering the toxin compared to AB20. Turkey feed studies are currently under investigation to understand the feed potential of the dried insoluble fraction (aflatoxin levels equal to ~20.8 ng/g)
compared to an aflatoxin contaminated starting feed supplemented with clay additives. 1.8.0 Conclusion
25
from peanut meal while controlling aflatoxin with clay enteroabsorbants and enzymes will be explored. It primarily differentiates itself from previous work in our group by focusing on whole protein isolations versus hydrolysates. Such whole protein concentrates/isolates offer different functionality benefits and improved isolation and concentration processing
properties compared to hydrolysates. However, whole protein isolations do lead to new solubility and optimization challenges. Furthermore, by focusing on whole protein isolations, this work will provide new insights into fundamental interactions among peanut protein and aflatoxin.
Figure 1.4. Diagram of pilot-scale process to extract protein hydrolysates from peanut meal (White BL and others 2013).
1.9.0 Research Objectives
The goals of the following work are as follows:
1) Improve purification and extraction methods of aflatoxin from highly contaminated peanut meal to increase recovery rates of aflatoxin.
2) Optimize a process to extract whole protein and minimize aflatoxin from
aflatoxin-Pump% Decanter%
Wet$Solids$Cake*% (75.1%±%1.6%%%moisture)% 22.5%±%1.9%%%total%mass% %%39.4%±%3.3%%%total%solids%
Liquid$Stream*% (89.4%±%0.5%%%moisture)% 77.5%±%1.9%%%total%mass% %58.2%±%2.1%%%total%solids%
Premix% ~20%min%
Enzymatic% Hydrolysis% ~%60%min%
Sample$T1*$
Alcalase%(115%g)% Clay%(2.3%kg)%
Steam%Off% Hold%80°C% ~30%min%
Sample$T2*$
from%50°C%to%80°C%
~50%min%
Jacketed$Mixer$(50°C)$
57.6%kg%PM% 320%L%water% 640%g%NaOH%
Steam%on%
Cabinet%Dryer% (80°C)%~12%hr%
26 enriched peanut meal.
27
CHAPTER 2: QUANTIFICATION OF AFLATOXIN: METHOD DEVELOPMENT 2.1.0 Introduction
Aflatoxins are regulated in over 100 developed countries to levels between 1 – 30 ng/g on a dry weight basis due to their toxic and carcinogenic nature (van Egmond HP and others 2007). It is therefore vital that crops be sampled and accurately quantified for aflatoxin content prior to entering the food supply. In peanuts, where aflatoxin contamination can be rampant under harsh, drought-like environmental conditions, methods for quantification have been developed and refined over the last 50 years (Lamb MC and Sternitzke DA 2001). In developed countries, an elaborate infrastructure functions to successfully segregate
contaminated peanuts from the food supply, and those peanuts are diverted to oilstock. Peanut meal, the insoluble byproduct from peanuts directed for oil fractionation, is enriched in aflatoxin because aflatoxin does not fractionate with the lipid layer. This material is
valuable as it contains ~50% protein by weight; however, it too must be accurately quantified for the amount of aflatoxin present is correlated with its application. Peanut meal with
aflatoxin levels less than 20 ng/g required in the most sensitive or selective animals, such as dairy cows or broilers, whereas with concentrations greater than 300 ng/g it is commonly directed to fertilizer.
The Journal of AOAC International has published many officially approved methods for aflatoxin quantification, with the most common including high pressure liquid
28
loaded onto clean-up columns to remove the background matrix. The two most common types of purification columns are silica-gel based or immuno-affinity based. In the former, cations (generally magnesium) embedded in the silica matrix bind aflatoxin as it flows
through the column (Sobolev VS 2007). In the latter, antibodies are used to select specifically for the four primary types of aflatoxin (B1, B2, G1, G2) (Kussak A and others 1995). For
HPLC methods, purified aflatoxins can be separated into their individual components on a column, derivatized with trifluoroacetic acid, bromine, or UV light into compounds that fluoresce at desirable wavelengths (Lupo A and others 2011). Alternatively, aflatoxins can be quantified in their totality using a fluorometer, without separation on a column or
derivitization, since they naturally fluoresce at a wavelength of 365 nm (VICAM 1999). Fluorometers are commonly used throughout the US industry, though they have more variability and error than HPLC procedures (Buttinger G 2010).
Despite an abundance of standardized AOAC approved procedures, a literature survey revealed that numerous studies deviate from these standards. Consequently, variability can be found among a number of key isolation and analytical procedures for aflatoxin. The main body of work presented in this thesis focuses on processing of peanut meal to isolate whole protein and remove aflatoxin, and thus accurate quantification of aflatoxin was vital. To ensure the best results, a new HPLC detected to aflatoxin analysis was obtained in the lab, and, as a result, verification of all aspects of existing aflatoxin
quantification procedures was warranted. Variables considered included the extraction
29 purification methods.
2.2.0 Results and Discussion
2.2.1Extraction ratio of solvent to peanut meal
The extraction ratio of solvent to peanut meal is expected to have a large effect on the amount of aflatoxin quantified. As small molecules have a saturation concentration,
increasing the volume of solvent to peanut meal would be expected to increase the amount of aflatoxin detected until the maximum aflatoxin extracted reached a plateau. In the literature, it is most common to find papers using a 2:1 or 4:1 extraction solvent, and less common to see a 1:1 or 6:1 extraction method. The 2:1 and 4:1 extraction ratios were compared using 80% aqueous methanol as the extraction solvent. Aflatoxin was quantified using a VICAM fluorometer (Watertown, MA) because the HPLC protocol was not yet developed. The AflaTest® (Watertown, MA) column, a commercial immuno-affinity column, recommended by the VICAM manufacturer was employed to purify the aflatoxin from the matrix (VICAM 1999). The 4:1 solvent:peanut meal ratio extracted significantly more aflatoxin than the 2:1 system (Table 2.1). While this was a relatively simple experiment, it emphasizes the
30
Table 2.1. Effect of 80:20 methanol: water solvent: peanut meal ratio on aflatoxin quantification (n=4).
2:1 ratio 4:1 ratio P-value (α=.05) using Paired 2-way T-test Aflatoxin
(ng/g) 158.0 218.5 .01*
2.2.2 Optimization of a silica-gel clean-up procedure for HPLC analysis
A silica-gel clean-up procedure was selected for purification of aflatoxin prior to HPLC analysis due to its speed and economic advantages compared to the immuno-affinity column procedure. The procedure followed initially was as is reported in Sobolev and others 2007. Briefly, 1 ml of extract was loaded onto the column, pulled through drop-wise by vacuum, washed with solvents of decreasing polarity, and eluted with 1 ml of acetone/formic acid/water solvent. The eluent was evaporated in glass vials under nitrogen stream and resuspended in 63:37 water: methanol prior to injection on the HPLC.
31
reported by Sobolev (2007). Work is underway to confirm these results with mass
spectrometry and to determine the precise saturation limit of the column. Finally, the loss of aflatoxin during the evaporation step was considered. It has been reported in the literature that aflatoxin has a higher affinity for glass than non-polar solvents, and, without a
silicanized coating, will stick to glass vials (VICAM 1999). In the Sobolev (2007) procedure, this step was completed with standard glass vials. When pure aflatoxin standard mix (Sigma-Aldrich, St. Louis, MO) was evaporated in these glass vials, resuspended, and quantified, losses of up to 20% were observed (Figure 2.2).
Figure 2.1 Comparison of flow-through and eluent fractions generated from clean-up of peanut meal extract using FlorisilTM columns for aflatoxin analysis (n=6). 1 ml of crude
extract was loaded onto columns and pulled through using a solid phase extraction vacuum manifold. Columns were washed with .5 ml of methanol: water (80:20, v/v), 0.5 mL of methanol, and then 0.5 mL of chloroform: methanol (90:10, v/v). These components
comprised the “flow through,” that were then evaporated with a nitrogen stream at 45 °C and
resuspended in 2 ml of methanol. The aflatoxin was eluted from the column with 3 ml of acetone/water/formic acid (96:3.7:0.3, v/v), evaporated with nitrogen, and resuspended in 2 ml of methanol. Samples were quantified on the HPLC.
0 20 40 60 80 100 120
Eluent Flow-‐through
Total A(latoxin
32
Figure 2.2. Losses of standard aflatoxin-mix post-evaporation and suspension in 63:37 water: methanol quantified on the HPLC (n = 6).
2.2.3 Optimization of an immuno-affinity clean-up procedure for HPLC analysis
Due to the large quantification errors originating from multiple sources in the FlorisilTM column procedure, a new clean-up procedure using the commercial immuno-affinity column AflaTest® was investigated. The type of extraction solvent used to extract aflatoxin was considered. In the VICAM test manual, extraction with 80:20 methanol: water is recommended, and thus was used previously. However, 60:40 acetonitrile: water has been reported as a superior extraction solvent in the literature (Moller TE and Nyberg M 2004). Acetonitrile was confirmed as a more efficient solvent (Figure 2.3). The analysis also
revealed new effects related to the load volume and dilution of the extract in the case of both acetonitrile and methanol (Figure 2.3). It was observed that in samples with no aqueous dilution, the quantity of aflatoxin in the extracts was highly dependent on the amount loaded. With a dilution of at least 2.5x, this load volume effect was eliminated and significantly more aflatoxin was detected. This suggests that the AflaTest® column matrix is highly sensitive to
0 20 40 60 80 100
AFG2 AFG1 AFB2 AFB1
P
er
ce
n
t L
oss
(%
33
34 (a)
(b)
35
2.2.4 Degradation of aflatoxin samples in the HPLC
Even with the HPLC procedure optimized for extraction ratio, type of solvent, and clean-up column parameters, aflatoxin concentration was highly variable based on the time of analysis. To see if degradation was occurring as a function of time and affecting the standard curve, the standard aflatoxin mix was quantified between 0-24 hours (Figure 2.4). Significant degradation was seen nearly immediately for the AFG1 and AFG2 samples, with degradation starting for the AFB1 and AFB2 samples at approximately four hours. A
literature search revealed that this had been previously reported and suggested adding acetic acid at a 1% concentration to counteract this problem. The addition of acetic acid did prevent degradation of all aflatoxins over 24 hours. Standards run with acetic acid on the HPLC had a standard curve with a fit of 0.9999; previously, low and high concentrations of standards could not fall on the same curve. A survey of current aflatoxin methods suggested that well over 50% of quantification procedures do not specifically report adding acetic acid to
samples prepared in HPLC buffer. It is unclear if this is a lapse in methods or documentation.
Figure 2.4. Degradation of standard mix in 63:37 water: methanol with time.
0 20 40 60 80 100
0 2 4 6 24
Percen
t Lo
ss o
f
Afl
at
ox
in
(%)
Time (hours)
36 2.3.0 Conclusion
37
CHAPTER 3: EXTRACTION AND CHARACTERIZATION OF PROTEIN AND AFLATOXIN FROM PEANUT MEAL USING RESPONSE SURFACE METHODS 3.1.0 Introduction
Plant protein is becoming increasingly important world-wide as the growing energy costs of meat-based protein are placing an ever increasing strain on the world’s stressed food supply (Aiking H 2011; de Boer J and Aiking H 2011). In most developing countries,
peanuts serve as one of the most important protein sources and play a large role in the agro-economy (Prasad PVV and others 2010). Of the global peanut supply, 75% is crushed for oil due to worldwide economic demand (Prasad PVV and others 2010). In the U.S., peanuts selected for oil crushing are typically damaged, poorly sized, and/or contaminated by aflatoxin (Dorner JW 2008). Peanut meal, the byproduct of this process, while an excellent source of protein, becomes enriched in any aflatoxin present and is therefore limited to applications such as animal feed and fertilizer. A typical peanut meal contains 50% protein and very low levels of residual oil, making it an excellent candidate for processing to extract the protein, degrade or remove the aflatoxin, and overall add value to this product.
Previous work in our lab has shown that protease hydrolyzed protein can be extracted efficiently with water from highly contaminated peanut meal. Specialized aluminosilicate clays were added to these extractions to remove aflatoxin that was simultaneously
38
space (Deng Y and others 2010). In a pilot scale process using a starting peanut meal
aflatoxin concentration of 191 ng/g, the maximum reduction in aflatoxin in the soluble phase was achieved using 4% NovaSilTM (a commercial clay sorbent), giving a final aflatoxin concentration of 21 ng/g on a dry weight basis (White BL and others 2013). Further refining of the soluble fractions was required to reduce aflatoxin to levels less than 20 ng/g, which could be suitable for sensitive applications, such as dairy cattle feed.
39
from highly contaminated peanut meal will be accomplished using response surface analysis of a central composite design study with four factors: percent calcium chloride, percent clay, pH of the dispersion, and time for extraction.
The percentage of adsorbent clay used in aqueous-based aflatoxin systems has been shown to positively and linearly correlate with the percentage of aflatoxin sequestered (Seifert LE and others 2010). As these clays are thought to bind aflatoxin irreversibly, their efficacy is limited primarily by the number of binding sites available (Deng Y and others 2010). For this study, the commercial clay NovaSilTM was selected for a number of reasons. First, compared to other commercially available options, NovaSilTM has been shown to bind aflatoxin with an extremely high efficiency (Phillips TD and others 1988; Seifert LE and others 2010). Secondly, NovaSilTM has an extremely thorough and positive safety record
throughout the literature. A Web of Science (Thomson Reuters) search (October 2013) with “aflatoxin and NovaSilTM” as the keyword returns at least 34 studies. It was the clay of choice for a short-term study on pregnant rats (a highly sensitive model) and for the sole long-term study with male/female rats examining the effect of clay added to the diet over six months. Most importantly, it was safely and effectively used in a human study during which participants were fed clay to ameliorate existing aflatoxicosis (Afriyie-Gyawu E and others 2005; Afriyie-Gyawu E, Ankrah NA, and others 2008; Afriyie-Gyawu E, Wang Z, and others 2008). Finally, while clays may only be technically marketed as flow agents in feeds
according to the current FDA regulations, the state of Texas recently passed a bill permitting NovaSilTM specifically to be used as an “aflatoxin binder” (Office of the Texas State Chemist
40
Calcium chloride has been shown in a number of studies to influence the amount of aflatoxin sequestered by aluminosilicate clays or degraded in processing steps such as extrusion (Deng Y and Szczerba M 2011; Saalia FK and Phillips RD 2011). Like any ion, calcium will fill the interlayer space of clays and greatly influence its electrostatics (West AR 1999). Calcium is divalent and has a good charge to size ratio, enhancing the clay’s
coordination to aflatoxin compared to monovalent ions (Deng Y and Szczerba M 2011; Jaynes WF and Zartman RE 2011). In one experiment in which high-aflatoxin peanut meal was extruded, calcium was thought to potentially directly disrupt the interactions between aflatoxin and peanut proteins (Saalia FK and Phillips RD 2011). The effects of calcium on clay electrostatics as well as protein interactions could benefit a clay/peanut meal system by increasing the probability of clay encountering free aflatoxin and potentially enhancing the binding efficacy of the clay. However, calcium is known to cause protein precipitation above the isoelectric point (pH ~4.5), and this effect must also be considered.
Selections of the final two variables, pH and time, are for reasons a bit more
straightforward. Time will directly influence the amount of protein that can be extracted, as well as the amount of aflatoxin that can enter into the aqueous solution. Thus, the ideal time to maximize protein and minimize aflatoxin will be a fine balance between the two