PHASE AMBIGUITY REDUCTION IN LASER INTERACTED INTERFEROGRAMS
Asiah Yahayaand Yusof Munajat
Jabatan Fizik, Fakulti Sains,
Universiti Teknologi Malaysia, 81310, Skudai, Johor. e-mail. [email protected]
Abstract
Phase measurement of laser interaction is often plagued with ambiguity when analyzed using single interferogram. This ambiguity is often due to the existence of extra fringes in the area of disturbance of acoustic wave propagation by laser interaction. A new 3- interferograms phase measurement interferometry system incorporated with quadrature technique was developed to reduce this problem. The interferograms were initially shifted by 90º phase difference, a condition for quadrature imaging. Three interferograms of laser interaction with a single pulse of Nd:YAG laser were captured by three CCD cameras simultaneously, with dye laser as a flash illuminator. An appropriate algorithm utilizing intensity distributions, matched pixel to pixel was able to reduce the problem. It was found that the maximum phase change was (2.5 ± 0.1) rad for an interaction of a 3 mJ Nd:YAG laser pulse at a delay of 3.6 µs. This phase change profile can be used in the analysis of pressure profile of laser interaction by Abel inversion technique.
1. Introduction
Phase change measurement in interferometry relates the physical quantity such as the changes in the refractive index, optical path lengths, density, pressure and even temperature of the medium involved. The sensitive nature of the interferometry method provides a challenge to the design and development of the system. Phase ambiguity, when present, prevents further analysis of the parameters associated with the phase change measurement of the medium. This occurs when phase measurement is made using an algorithm based on intensity distribution of a single interferogram. Thus, a new three-interferograms phase measurement interferometry system was developed to reduce the problem.
2. Methodology
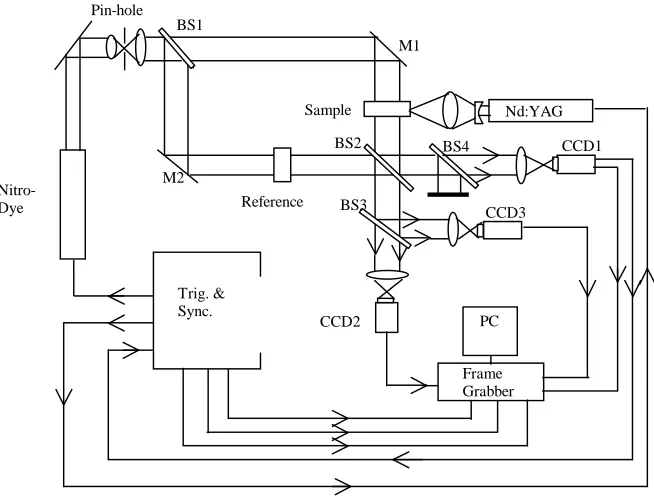
The system developed consisted of an interferometer with three-outputs, a fast photography unit, trigger and synchronize unit and also an image processing unit. The interferometer was a modified Mach Zehnder interferometer while the fast photography incorporates the use of a pulsed (1 ns) nitro-dye laser. The interferograms of laser interaction in air were captured and processed using computer programming written in Mathcad. The general layout of the system developed is shown in Figure 1.
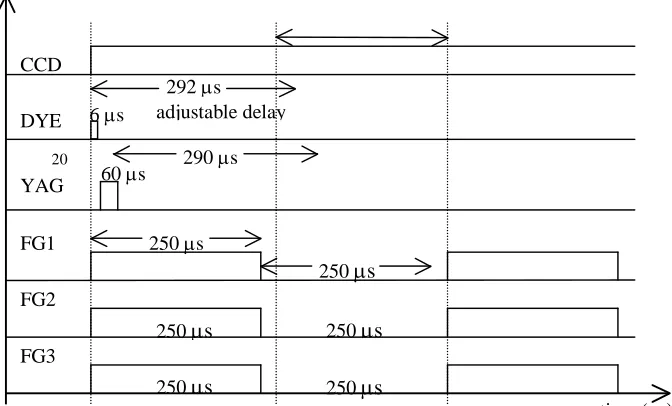
The simultaneous image capture was made possible firstly by making one of the CCD cameras, a master and the other two, the slaves [1]. A timing chart was prepared to
synchronize between the firing of the two lasers and the capture of the images. Figure 2 shows the timing chart for the system developed in this project.
The three outputs of the interferometer were arranged to be separated in phase by 90º for quadrature imaging [2]. This was accomplished by firstly making the two interfering beams circularly polarized and rotating an analyzer at each output of the interferometer. The three interferograms to be analyzed were captured simultaneously with a single pulse of Nd:YAG laser. Phase measurements analysis was based on the intensity distribution of the interferograms through an algorithm [3] given as:
2 1 2 3 1 tan I I I I Where
is the phase change to be measured and
4 3 , cos 1 , 0 2 x y
I y x I
4 5 , cos 1 , 0 3 x y
I y x I
are the intensity equations of the three interferograms. I0 is the background intensity
while ã is the visibility factor of the function.
Pin-hole Nitro-Dye Trig. & Sync. CCD1 CCD2 CCD3 Nd:YAG Frame Grabber PC Sample Reference M1 M2 BS1 BS2 BS3 BS4
Figure 1 The simultaneous interferometry system developed
(1)
4 , cos 1 , 0 1 x y
3. Result And Discussion
Recall the 90º phase difference required of the interferograms before laser disturbance. Figure 3 shows the straight and parallel fringes produced by the interference of the nitro-dye laser beams before interaction with the Nd:YAG laser. The marker helped to visualize the 90º phase difference between them. But the exact value of the phase difference was computed using a Mathcad computer programming.
Figure 3 The 90º phase difference (refer to the pointer) before breakdown due to the Nd:YAG laser.
Figure 4 The interferograms after interaction with Nd:YAG laser
(a) (b) (c)
CCD
DYE
YAG
FG1
FG2
FG3
adjustable delay 292 s
290 s
250 s 60 s
20
250 s 6 s
250 s
250 s
250 s
250 s
Figure 2 The time chart for synchronization of the events
Figure 4 shows the interferograms captured at 3.6 µs delay after laser interaction. The shapes of the fringes changed due to the changes associated with laser breakdown. The intensity levels of the interferograms were mapped and matched pixel to pixel accuracy in the three interferograms. Using FFT, this intensity was then transformed from its spatial domain to frequency domain where identification of the signal was made. Digital filtering was carried out to remove the low frequency background noise and also the high frequency electronic noise. Inversing this transform would provide a ‘clean’ signal ready to be used in the algorithm.
The resulting phase change was initially analyzed individually and sure enough the result indicated phase ambiguity in all the three interferograms. Usually, out of the set of three, one or two interferograms would exhibit ambiguity. The algorithm used in the single-interferogram analysis [4] is:
From the algorithm, it would be expected that the result would provide a saw-tooth profile because of the arctan function. This was called the wrapped phase. At this stage the phase change produced was not continuous and therefore failed to represent the true phase change taking place. An unwrapping procedure was required. The unwrapping technique incorporated in this part of phase analysis was based on the technique used by Yusof Munajat (1997).
m1= 0 r = 2,3,……256 2.417478
7.414418
r
0
0 50 100 150 200 250 300 10
5 0 5
p
h
a
se
c
h
an
g
e
(r
a
d
)
1.470622
6.24559 r
0
0 100 200 300 10
5 0 5
p
h
a
s
e
c
h
a
n
g
e
2.620808
7.378118 r
0
256
1 r
0 50 100 150 200 250 300 10
5 0 5
p
h
a
s
e
c
h
a
n
g
e
(a) (b)
(c)
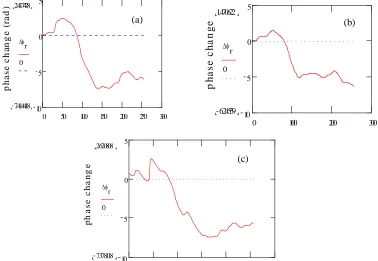
Figure 5 Phase change measurement when analyzed individually indicating phase ambiguity
y x c
y x c y
x
, Re
, Im arctan ,
2 1 2 1 2 1 1 1 1 1 1 r r r r r r r r if m if m if m m r r r m c r
1,2,256
The individual phase change measurement made of the three simultaneously captured interferograms indicated phase ambiguity (Figure 5) which thus prevented any further analysis of the associated changes to be made.
With simultaneous analysis using the combined algorithm shown in equation (1), the resulting phase change profile obtained from the same set of interferograms indicated the expected profile as shown in Figure 6. The maximum phase change due to a 3 mJ Nd:YAG laser interaction at 3.6 µs delay was found to be (2.5 ± 0.1) rad.
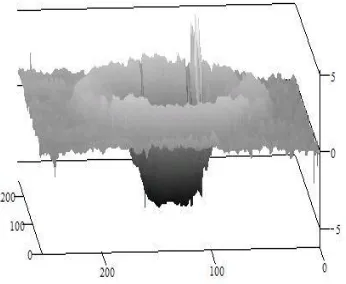
The unwrapping procedure can also be expanded to two and three dimensions. Figure 7 and Figure 8 are the examples of the 3D representations of the phase change. The images could be cut and sliced at any location for thorough investigation of the changes taking place.
2.496 282
5.777 77 r
0
0 50 100 150 200 250 300 10 5 0 5 Ph as e ch an ge ( ra d)
Figure 6 Phase change measurement when analyzed simultaneously
(3)
From the profile of the phase change obtained, the associated changes in the parameters such as the refractive index, density and pressure could be calculated.
4. Conclusion
The result obtained proved that even when all the three images produced phase ambiguity when analyzed individually, they seemed to be able to produce the expected phase change when analyzed simultaneously. For an acoustic wave at a delay of 3.6 µs formed by a 3 mJ, Nd:YAG laser pulse, a maximum phase change of (2.5 ± 0.1) rad was formed. Thus, the three simultaneously captured interferograms model developed in this project had managed to reduce the problem of phase ambiguity suffered by single interferogram analysis of laser interaction.
5. Acknowledgement
We would like to thank the Universiti Teknologi Malaysia for the financial support and the technical staff for their cooperation.
6. References
[1] Munajat. Y., “High speed Optical Studies for laser induced acoustic wave and phase measurement interferometry system”, PhD Thesis, UTM, 1997.
[2] Hogenboom, D.o., Di Marzio, C.A, Gaudette, T.J., Devaney, A.J. and Lindberg, S.C. Three dimensional images generated by quadrature interferometry. Optics
Letters. 23(1ss). 783-785,1998.
[3] Wyant, J.C., Kaliopoulos, C.K., Bhushan, B. and George, O.E. (1984). An optical profilometer for surface characterization of magnetic media. ASLE Trans. 27: 101 [4] Osten, W. and Juptner, W. Digital Processing of Fringe Patterns in Optical
Metrology. In: Rastogi, P.K ed. Optical Measurement Techniques and Applications. Artech House, Inc, Boston. London. 51-85, 1997.
[5] Roddier, C. and Roddier, F. Interferogam analysis using Fourier Transform techniques. J Appl Optics. 26(9): 1668-1673, 1987.
[6] Surrel, Y. Additive noise effect in digital phase detection. Appl. Optic. 36(1): 271-275, 1997.
[7] Gierloff, J.J. Phase Unwrapping By Regions. Proc. SPIE. 818: 267-278, 1987. [8] Greivenkemp, J.E. and Bruning, J.H. Phase shifting interferometry. In: Malacara,
D. ed. Optical Shop Testing. New York: John Wiley & Sons Inc. 501-589, 1992. [9] Kreis, T. Digital holographic interference-phase measurement using the
Fourier-transform method. J. Opt. Soc. Am. A.3: 847-855, 1986.