COMBINING SPATIAL COMPONENTS IN SEISMIC DESIGN
Michael O’Leary1, PhD, PE and Kevin Huberty1, PE, SE
1
Nuclear Power Technologies Division, Sargent & Lundy, Chicago, IL 60603
ABSTRACT
According to Regulatory Guide 1.92 [1], the square root of the sum of the squares (SRSS) method and the 100-40-40 rule are acceptable means of combining spatial components in seismic design. The two methods are compared in order to clarify their proper implementation and to identify the advantages of each approach with respect to the finite element-based design process common throughout the nuclear industry. The excess conservatism and the manipulation of the signs of multiple response parameters required for the adequate implementation of the SRSS method make the 100-40-40 rule a better approach for design.
INTRODUCTION
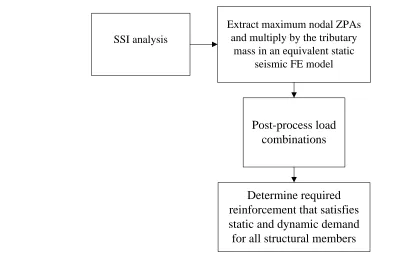
The two-step method is a common industry approach to incorporate the effects of soil-structure interaction (SSI) analysis into the design of new concrete nuclear structures. The first step is to perform the SSI analysis and the second step is to make an equivalent static seismic finite element model based on the SSI analysis results. Typically the nodal zero period accelerations (ZPA) from the SSI analysis results are multiplied by their tributary mass to determine equivalent static seismic forces associated with a horizontal or vertical input motion. These forces are applied to a three-dimensional equivalent static seismic finite element model and combined using the SRSS method or the 100-40-40 percent combination rule in accordance with Regulatory Guide 1.92 [1]. The two-step method offers a flexible and practical approach to new design. If a coarser mesh is required in the SSI analysis model due to computational limitations, for example, the two-step method can accommodate a more refined mesh in the design model. Since all of the equivalent static forces associated with the nodal accelerations act in phase, it is generally accepted that the two-step approach is conservative [2]. The flowchart in Figure 1 summarizes this concrete design process. Two acceptable methods for combining spatial components in seismic design (SRSS and 100-40-40 rule) in Regulatory Guide 1.92 [1] are compared in order to clarify their proper implementation and to identify the advantages of each approach within the context of the design process common throughout the nuclear industry.
COMBINATION OF THREE-DIMENSIONAL EARTHQUAKE EFFECTS AND MULITPLE RESPONSE PARAMETERS
In accordance with Regulatory Guide 1.92 [1], the SRSS combination of three-dimensional earthquake effects is
1
3 2
2
1
I I
R
R
=
=
, (1)Determine required
reinforcement that satisfies
static and dynamic demand
for all structural members
Post-process load
combinations
Extract maximum nodal ZPAs and multiply by the tributary
mass in an equivalent static seismic FE model SSI analysis
Figure 1: Seismic analysis and design process for concrete nuclear structures.
The 100-40-40 rule is defined in Regulatory Guide 1.92 [1] as
(
1.0
10.4
20.4
3)
R
=
R
+
R
+
R
(2)where R1, R2, and R3 are the maximum responses of the structure caused by each of the three earthquake components such that R1 ≥ R2 ≥ R3 . In ASCE 4-98 [4], all possible twenty-four permutations of the
100-40-40 rule are made explicit by the following expression:
[
1 0.4 2 0.4 3]
or[
2 0.4 3 0.4 1]
or[
3 0.4 1 0.4 2]
R= ± R ± R ± R ± R ± R ± R ± R ± R ± R
.
(3)
The principle advantage of equation
(3)
over(2)
is that the directional nature of the load is made explicit in the expression. Moreover, the response R from equation(3)
will always be equal to or greater than the response R from equation(2)
. Therefore, when the 100-40-40 rule is invoked throughout the remainder of this paper, the twenty-four responses contained in equation(3)
are implied.maximum bending moment, the revised ASCE 4-11 (draft version) [5] approach results in more reasonable reinforcement while maintaining the conservatism required in seismic design. Under the ASCE 4-11 (draft version) [5] approach, however, the SRSS method is almost always more conservative than the 100-40-40 rule, as can be seen in the following example.
COLUMN EXAMPLE
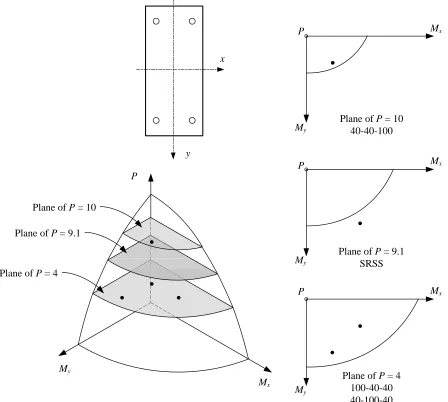
Consider a simple 10 ft column with a 1 ft by 2 ft cross section. The seismic responses due to the x, y, and z direction excitations are each equal to 10 kips applied at the top of the column: Rx = Ry = Rz = 10 kips. As can be seen in Table 1, the 100-40-40 rule yields the maximum single response parameter highlighted in red, but these parameters interact with lower corresponding response parameters. Subsequently, Mx and My points from 100-40-40 rule may fall within the biaxial interaction surface where the SRRS points do not due to the higher corresponding axial load as shown schematically in Figure 2. Furthermore, if there is a torsional component to the seismic response, the maximum torsion does not tend occur in the same load combination as the maximum shear force under the 100-40-40 rule. Again, while the maximum torsion due to the SRSS method may be lower than the 100-40-40 rule, the corresponding shear force is typically higher and subsequently more critical.
Mx
My
P
Plane of P= 4 Plane of P= 9.1
Plane of P = 10
Plane of P= 4 100-40-40 40-100-40 Plane of P = 9.1
SRSS Plane of P = 10
40-40-100
x
y
Mx
Mx
Mx
My
My
My
P
P
P
Table 1: Multiple response parameters (absolute values) for a 10 ft column where Rx = Ry = Rz = 10 kips.
Combination P (kips) Mx (kip-ft) My (kip-ft) Vx (kips) Vy (kips)
100-40-40 4 40 100 10 4
40-100-40 4 100 40 4 10
40-40-100 10 40 40 4 4
SRSS 9.1 91 91 9.1 9.1
SHEAR WALL FINITE ELEMENT MODEL
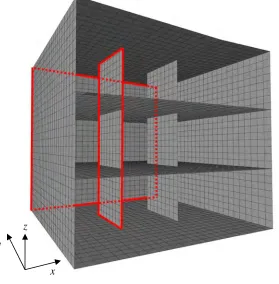
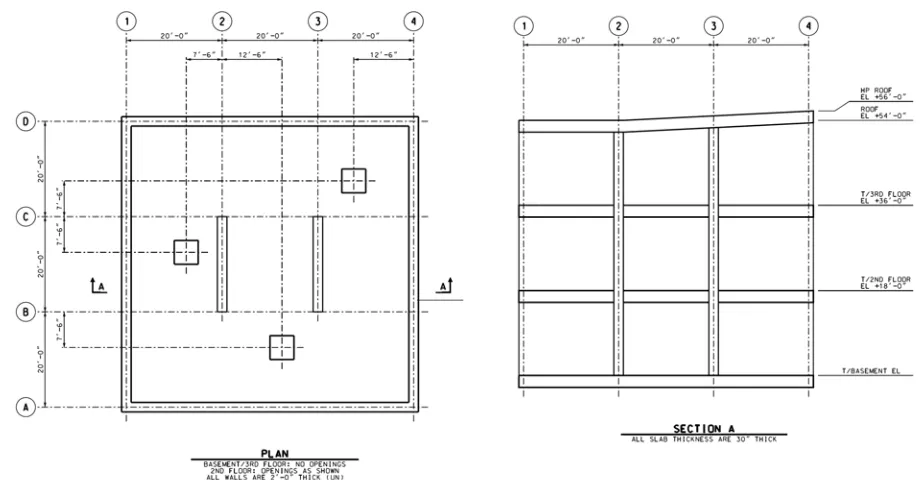
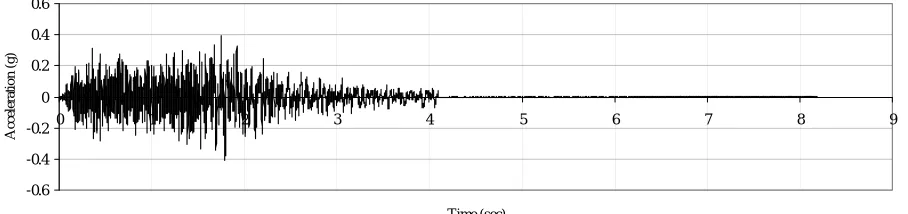
The test model shown in Figures 3 – 4 is three stories high with three bays in both directions. There is a twenty foot span between each of the three bays. The three floors are spaced at 18 feet and the slabs are 30 inches thick. The three openings shown in Figure 4 are only found on the second floor. All walls, including the two interior shear walls are two feet thick. For this study, the fixed base model is first subjected to the three orthogonal time histories shown in Figure 5. The maximum absolute accelerations from all three time history analyses are extracted and combined by the SRSS method. These three orthogonal accelerations are multiplied by their tributary masses to determine an x, y, and z direction equivalent static force. These three forces are then combined by means of the SRSS method and the 100-40-40 rule. Although the fixed-base accelerations are not identical to SSI analysis, the process of determining equivalent static seismic forces is the same.
Figure 3: Finite element test model.
x y
Figure 4: Model floor plan and elevation.
-0.3 -0.2 -0.1 0 0.1 0.2 0.3 0.4
0 1 2 3 4 5 6 7 8 9
Time (sec)
A
ccel
er
at
io
n
(
g
)
a.) X direction excitation.
-0.6 -0.4 -0.2 0 0.2 0.4 0.6
0 1 2 3 4 5 6 7 8 9
Time (sec)
A
ccel
er
at
io
n
(
g
)
-0.6 -0.4 -0.2 0 0.2 0.4 0.6
0 1 2 3 4 5 6 7 8 9
Time (sec)
A
ccel
er
at
io
n
(
g
)
c.) Z direction excitation.
Figure 5: Time histories used in the fixed base time history analyses.
RESULTS
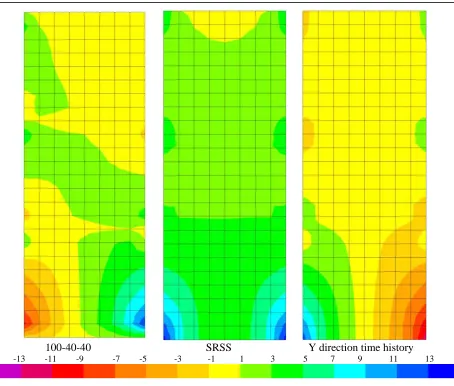
The maximum analytical results for vertical axial forces in the interior wall identified in Figure 3 are shown in Figure 6. In order to compare the accuracy of the load path, the maximum time history analysis results are shown along with the 100-40-40 rule and the SRSS method results. Since the three time history cases are analyzed separately, only the results from the dominant directional load are shown. The maximum analytical results for vertical axial forces in the exterior wall identified in Figure 3 are shown in Figure 7. Tables 2 and 3 provide the sum of the element forces along the bottom of the interior and exterior shear walls highlighted in Figure 3, respectively for the load combinations where the in-plane shear forces are greatest in magnitude. The in-plane moment is calculated by summing the moment of the vertical element forces of the bottom row of elements about the geometric center of the wall:
1
2
n w
in plane i i
i
l
M
−F
x
=
=
−
(4)100-40-40 SRSS Y direction time history
-13 -11 -9 -7 -5 -3 -1 1 3 5 7 9 11 13
Figure 6: Maximum vertical axial element forces (kips/ft) in the interior wall for the 100-40-40 rule, the SRSS method, and the y direction time history analysis at time step 7.565 seconds.
100-40-40 SRSS X direction time history
-13 -11 -9 -7 -5 -3 -1 1 3 5 7 9 11 13
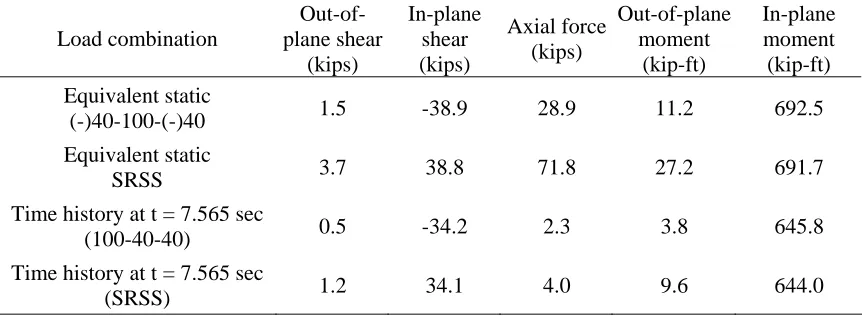
Table 2: Maximum element forces summed up along the bottom of the interior shear wall
Load combination
Out-of-plane shear
(kips)
In-plane shear (kips)
Axial force (kips)
Out-of-plane moment
(kip-ft)
In-plane moment
(kip-ft) Equivalent static
(-)40-100-(-)40 1.5 -38.9 28.9 11.2 692.5
Equivalent static
SRSS 3.7 38.8 71.8 27.2 691.7
Time history at t = 7.565 sec
(100-40-40) 0.5 -34.2 2.3 3.8 645.8
Time history at t = 7.565 sec
(SRSS) 1.2 34.1 4.0 9.6 644.0
Table 3: Maximum element forces summed up along the bottom of the exterior shear wall
Load combination
Out-of-plane shear
(kips)
In-plane shear (kips)
Axial force (kips)
Out-of-plane moment
(kip-ft)
In-plane moment
(kip-ft) Equivalent static
(-)100-40-(-)40 -5.7 -202.9 58.5 31.1 2789.1
Equivalent static
SRSS 15 203.2 189.7 83.1 2684.5
Time history at t = 1.345 sec
(100-40-40) 1.4 -188.8 -6.3 -8.9 -2634.0
Time history at t = 1.345 sec
(SRSS) 4 188.7 54.6 23.3 2671.5
DISCUSSION
The axial element force plots of the 100-40-40, SRSS, and time history load cases shown in Figures 6 and 7 are similar in terms of magnitude and load distribution. The maximum multiple response parameters reported in Tables 2 and 3 echo the interaction shown in Table 1 for the column example. While the maximum single response occurs in one of the twenty-four permutations of the 100-40-40 rule, it interacts with lower corresponding response parameters than the SRSS load. Moreover, the critical response parameters in the direction of the earthquake load, including the in-plane shear, and in-plane moment forces, are similar for both the 100-40-40 rule and the SRSS method. The corresponding SRSS axial forces in both the interior and exterior walls are well over twice the magnitude of the 100-40-40 rule axial forces, however. As a result, the SRSS method is more akin to using a 100-100-100 combination rule for designing a shear wall for axial force and moment.
cannot be easily implemented, however. The actual directional load path is required to determine the in-plane moment.
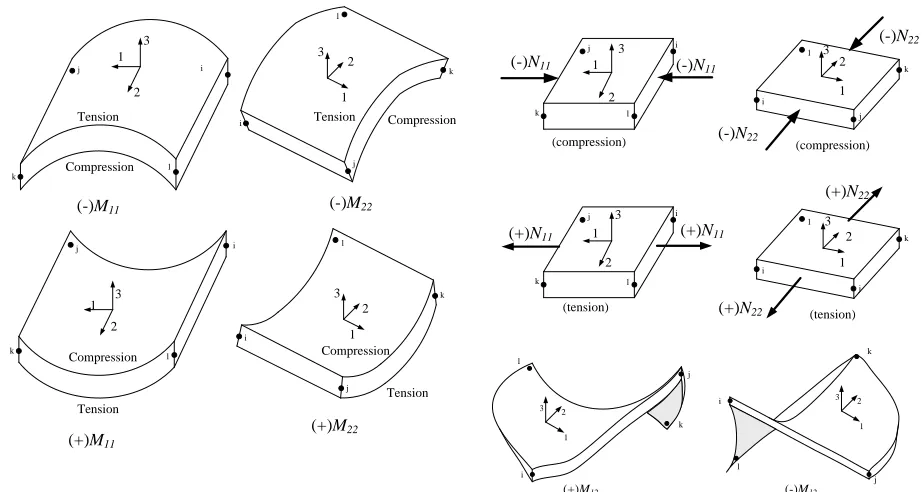
Finally, all results combined by the SRSS method are positive or negative. But as section cut force Tables 2 and 3 reveal, multiple response parameters from directional loads do not necessarily have the same sign. Therefore, unless the analyst manipulates the sign of response parameters as part of a post-processing routine, the SRSS method potentially misses load combinations in which the seismic response parameter interacts constructively with dead or live load response parameters, for example. Figure 8 illustrates the sign convention for shell elements. Tables 4 and 5 list the permutations of the seismic response for shell elements and frame elements that are missed by the positive and negative implementation of equation
(1)
. Although the number of required permutations for frame elements in Table 5 is greater than the number of shell permutations, the permutations required to account for in-plane moment when the SRSS method is used are not included Table 5.3 1 2 3 1 2 3 1 2 3 1 2 Tension Compression Tension Compression Tension Compression Tension Compression (+)M11 (-)M11 (+)M22 (-)M22
(-)N11 (-)N11
(-)N22 (-)N22 j k l j i k l j i k l j i k l 3 1 2 j i k l (compression)
(+)N11 (+)N11
3 1 2 j i k l (tension) j i k l (compression) (+)N22 (+)N22 j i k l (tension) 3 1 2 3 1 2 i 3 1 2 l k j i
(-)M12
3 1 2 k i l j
(+)M12
Figure 8: Shell element sign convention.
Table 4: Required shell element permutations for SRSS.
Permutation N11 M11 N22 M22 M12 F12 V13 V23 +SRSS + + + + + + + +
-SRSS - - -
Not captured + - + - - - - -
Table 5: Required frame element permutations for SRSS.
Permutation P Mx My
+SRSS + + +
-SRSS - - -
Not captured + + -
Not captured + - -
Not captured + - +
Not captured + - -
Not captured - + +
Not captured - - +
CONCLUSION
This study has confirmed the conservatism of the 100-40-40 rule relative to the SRSS method for a single response parameter as well the conservatism of the SRSS method when multiple response parameters are considered. Both methods of combining spatial components of earthquakes in determining equivalent static loads are acceptable according to Regulatory Guide 1.92 [1] and both methods adequately envelop the critical forces from time history analysis. In this respect, the 100-40-40 rule is preferred for design since the final reinforcement will be less congested than a design based on the SRSS method. Both methods also require permutations of signs to adequately capture the most critical load combinations. The advantage of the 100-40-40 rule is that the permutations of the loads are required before analysis, which is a relatively simple task. The SRSS method, on the other hand, requires manipulation of the sign of individual response parameters outside of the finite element analysis. And for a more complicated structure using the SRSS method, there may be no clear way of evaluating in-plane moment. In conclusion, the directional nature of the 100-40-40 loads and the relative simplicity of its implementation make it preferable to the SRSS method.
ACKNOWLEDGMENTS
The authors gratefully acknowledge Andrew Blomquist and William Godfrey of Sargent & Lundy for their assistance in preparing the finite element models and certain figures.
REFERENCES
[1] U.S. Nuclear Regulatory Commission. (2012). Regulatory Guide 1.92, Combining Modal Responses and Spatial Components in Seismic Response Analysis, Revision 3.
[2] Watkins, D., Gürbüz, O., and Ma, T. (2006). “Two-step method of seismic analysis,” Proc., First European Conference on Earthquake Engineering and Seismology, Geneva, Switzerland.
[3] Nie, J., Morante, R., Miranda, M., and Braverman, J. (2010). “On the correct application of the 100-40-40 rule for combining responses due to three directions of earthquake loading,” Proc., ASME 2010 Pressure Vessels and Piping Division, Bellevue, WA.
[4] American Society of Civil Engineers. (2000). ASCE 4-98: Seismic Analysis of Safety-Related Nuclear Structures, Revision 3.