Comparison of Methods for Mapping Forested Trails Using Remote Sensing at Umstead State Park
By
Steven Hill
Submitted to the Graduate Faculty of North Carolina State University
in partial fulfillment of the requirements for the Degree of
Master of Natural Resources
Geographic Information Systems
Raleigh, North Carolina
2015
Approved by advisory committee:
Committee Chair: Dr. Stacy Nelson
Committee Members: Dr. Yu-Fai Leung, Dr. Helena Mitasova
3 ABSTRACT
Hill, Steven. Master of Natural Resources - GIS Technical Option.
Title: Comparison of Methods for Mapping Forested Trails Using Remote Sensing at Umstead State Park.
In this project I demonstrate the usefulness of high resolution LiDAR surveys in mapping forested hiking trails. The study builds off previous studies in which the “break in slope” profile of roads is used to delineate road features in rough, forested terrain. Formal hiking trails in certain topographies also exhibit this same profile. The study site for this report is Umstead State Park, in Wake County, North Carolina. A comparison of LiDAR’s increased capabilities to delineate features is also conducted with high resolution orthophotography. Using this approach, the two selected trails were mapped with completeness of 68.9% and 80.8% of their
5 BIOGRAPHY
6 ACKNOWLEDGEMENTS
I would first like to thank Dr. Heather Cheshire for accepting my application to Masters of Natural Resources Program at North Carolina State University. I would also like to thank Dr. Yu-Fai Leung for his help in identifying the research question being answered by this project with regards to its implications for park managers. Dr. Stacy Nelson also should be
8 TABLE OF CONTENTS
Introduction………..…9
Background……….……….9
. Approach………10
Methods………..…11
Results………..……..13
Discussion………..16
Conclusion……….17
References………..…18
Appendix………19
9 Comparison of Methods for Mapping Forested Trails using Remote Sensing in Umstead
State Park
Steven Hill
North Carolina State University MNR – GIS Technical Option
1. Introduction
Trail inventories are an important component of the management of parks and recreation areas. Both formal and informal trails pose problems and maintenance responsibilities for mangers and having accurate and complete maps of trails is vitally important. A number of methods have been developed to map trails using geospatial technologies. Handheld or portable GPS units are traditionally used because they can be a low cost option. Field surveys also have the added advantage of providing attributes about ground conditions. They can, however, become prohibitively time consuming as management areas become larger and trail networks become more complex. Furthermore GPS surveys have accuracy issues unique to themselves, especially in steep, forested terrain. Remote sensing has emerged as a viable technology that can assist with the mapping of many manmade and natural features. Digital orthophotos and Heads-Up digitization is already a viable and proven method of delineating trail features provided tree canopies are not an issue (Marion, Leung, & Nepal 2006). A new approach has emerged that uses high resolution LiDAR. Specifically, its canopy penetrating capabilities allow the analyst to accurately model the structures below.
For this project I evaluate a method of mapping recreational trails using products derived from ground return LiDAR data. These trails are generally hard to detect by other remote sensing methods and a comparison to these technologies, primarily high resolution aerial imagery, is therefore warranted. This research represents a step forward in LiDAR mapping because it applies proven techniques to features that are smaller than previously mapped. A further goal of this project is to determine whether this method has applications beyond this specific scenario.
2. Background
2.1. Airborne LiDAR
LiDAR is a fast evolving technology in the remote sensing world and the range of potential applications for it in the field of natural resource management is rapidly expanding. An ever increasing spatial resolution of available datasets is helping to push this frontier further still. LiDAR, or Light Detection and Ranging, is a relatively new remote sensing technology that uses light energy, in the form of pulsed lasers, to range objects and surfaces. When airborne sensors are used, accurate three dimensional models can of the Earth’s surface can be generated
2.2. Mapping Roads using Remote Sensing Data
10 technology that can assist with the mapping of many manmade and natural features. High
resolution aerial photography and multispectral imagery has been commonly used in the natural resource environment since its development. More specifically, a number of researchers have used 6 inch imagery to map features such as: informal trails, logging roads, archaeologically significant structures, OHV trails, and trans-border trails, to name a few. The results have been promising, however, they have not for the most part dealt with the obstruction of linear features by forest canopies or other vegetation types.
Lidar may prove to be a better approach to mapping features obscured by trees assuming the resolution of the data collected is high enough for the intended application. Streams are a frequent target of aerial LiDAR surveys. A growing body of research suggests that LiDAR can be used for mapping roads (White et al. 2010). Mapping trails using orthophotography is a well-established technique in the field of geospatial technology. Fewer sources are available for trail mapping using digital elevation models. Another approach to mapping linear features involves using automated classification of features through image analysis techniques (Sherba et al. 2014). I chose to manually digitize trail features in this study because the delineation of small features such as hiking trails has yet to be demonstrated entirely.
2.3. Mapping Trails using Point Cloud Data
Another approach to mapping trails with LiDAR involves detecting continuous lines of missing canopy structure at the 0-6 foot height. Researchers have been successful using this approach to delineate trail segments (Lee et al. 2005), however, I felt that this method would be too reliant on the specific parameters of this study’s automation procedure. Additionally, the Wake County data was collected during leaf-off conditions which would potentially diminish the applicability of this technique.
3. Approach
3.1. Objective
The purpose of this project is to develop a method for the mapping of forested trails using the classified LiDAR data from the 2013 Wake County survey and compare its efficiency.
Through the visual analysis of classified LiDAR-derived digital elevation models, I attempt to manually delineate a pair of forested hiking trails and a network of multi-use trails across Umstead State Park. Those results are compared to the same features mapped using high resolution aerial photography and a handheld GPS mapping unit. A standard workflow for working with this dataset in the ArcGIS suite is also a desirable outcome of this study. A field survey of digitized trails will also be carried out to verify the accuracy of this method.
3.2. Study Area
11 Crabtree to the south. There are a number of access roads and Ranger facilities throughout park. The terrain is steep and there are a few small lakes in the park.
3.3. Two Target Features in Park
Throughout Umstead State Park there are about 13 miles of Multiuse Trails that in many ways resemble fire roads or access roads. These features measure between 3 to 5 meters wide and are paved with crushed limestone. Frequent elevation changes make these trails popular for all types of trail users, including: equestrians, bicyclists, runners, and hikers. Because of their width and the distinguishable color of the paving materials, these features are easily digitized with color orthophotos taken during leaf-off conditions. The network of multiuse trails is made up of a 4 connected trails named: Reedy Creek Trail, Cedar Ridge Trail, Graylyn Trail, and Turkey Creek Trail.
The other feature type of interest are two hiking trails in the southern part of the park, Company Mill Trail and Loblolly Trail. The hiking trails at Umstead State park tend to be considerably narrower and are mostly occluded by tree canopies. Both Company Mill Trail and Loblolly trail are well marked and frequently used by a variety of age groups. These trails tend to be 1-2 meters wide and are rated as moderate difficulty for hikers due to a number of steep grades and rock features. A number of bridges and stream crossings can be found along the trails. These trails are not paved but are often built into slopes which creates a distinctive profile that can be detected visually in DEMs. Trail treads tend to create a break in the slope of hillsides that can be seen in high resolution topographic maps.
4. Methods
4.1. Surdex LiDAR data collection
12 this contract was an average laser ground sample of 1.0 meters. Flights were carried out in
February during leaf-off, snow free conditions. More information can be found in the project summary report. Data was delivered in pre-classified LiDAR point tiles with a little more than 4,000 tiles needed to cover all of Wake County. The classification codes were defined by the American Society for Photogrammetry and Remote Sensing (ASPRS). According to this schema, code of 2 is assigned to bare ground point and the code 1 if for unassigned points. Nosie is given a separate code by the data vendor which expedites analysis. 55 of these tiles were used to cover all of Umstead State Park.
For the sake of comparison an additional dataset was used in this project; a 6 inch color infrared orthophoto mosaic. This dataset was downloaded from the extensive North Carolina State University GIS library server. These orthophotos are a multiband dataset delivered in tiles and mosaicked in ArcMap.
4.2. Processing of LiDAR points
Processing of the LiDAR data was carried out ArcMap 10.2.2. ESRI’s ArcMap. ArcMap’s Spatial Analyst and 3D Analyst toolsets have a number of different geoprocessing tools that can be used to visualize LiDAR data through the creation of LAS Datasets. These tools include filtering, profile viewing, and 3 dimensional visualization tools to name a few. The LAS Dataset format is a proprietary file type of ESRI and is the cornerstone of ArcGIS’s LiDAR analysis tools. The 55 classified LAS files needed to cover Umstead State Park were imported into ArcMap simultaneously using the LAS Dataset creation tool. Each tile measures
approximately 0.47 miles across and contains millions of points each. Ground points were filtered by the classification code previously assigned to the points using the tool, Make LAD Dataset Layer. A 1 meter digital elevation model was then created for the entire park using a raster creation tool in ArcMap. From there the Spatial Analyst Tools were used to create a hillshade map and a slope map. Using the hillshade and slope maps, analysts can see the “break in slope” that is indicative of roads and trails built into the topography. This technique was used by White et al. (2010) to accurately map logging roads in forested terrain. The specific workflow for inputting the las data into ArcMap can be seen in the Appendix to this report.
4.3. Heads-up digitizing of trails
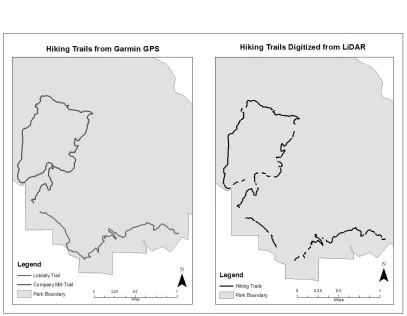
The primary method of delineating trails used for this project is heads-up digitizing of trails using 1 meter LiDAR-derived digital elevation model and associated products. By using a slope map and a hillshade map created from the high resolution DEM, the distinctive “break in slope” can be observed without further image analysis techniques. The total length of the two hiking trails was found through manual delineation and compared to GPS mapped trails and data available from Wake County GIS. Hard copy trail maps also proved invaluable aids in
13 The network of multiuse trails throughout the park was digitized manually using a mosaic of 6 inch orthophotos for Umstead State park. Overall length of digitized the multiuse trail network was calculated and compared to mapped trails data from Wake County GIS. Evaluation of whether hiking trails can be digitized from digital orthophotos is explored but unlikely, even with images taken during leaf-off conditions.
4.4. Mapping of hiking trails using recreational grade GPS
An important element of this project was the determination of the actual trail lengths of Company Mill Trail and Loblolly Trail. This was accomplished using a consumer grade Garmin 64s GPS unit. GPX track files were collected for each of the trails and imported into a GIS as shapefiles using a program called DNR GPS (or DNR GARMIN). These lines were used as a reference for the heads-up digitizing of the hiking trails in ArcMap.
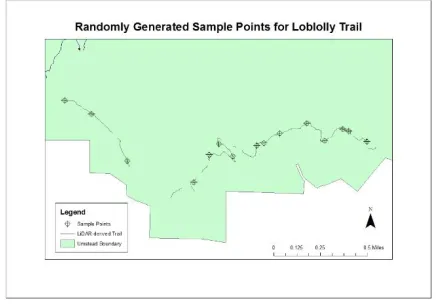
4.5. Sample points for field verification of mapped trails
For the hiking trails mapped using visual analysis of the slope and hillshade maps of the park’s terrain, a number of sample points were generated for the purpose of field verification. 15 points from the digitized segments were generated randomly in ArcMap for both Company Mill Trail and Loblolly Trail. These 30 points were
inputted as waypoints into a recreational grade Garmin 64s and navigated to in the field. The horizontal accuracy of the Garmin 64s is roughly 3 meters. Therefore a sample point was
considered field verified when I was able to come within 10 feet of the point while remaining on the tread of the trail. Waypoints could only be
inputted into the Garmin unit to the nearest 0.00001 decimal degree (about 1 meter) and this introduced further degradation of confidence in feature accuracy.
4.6. Analysis Methods
For this project I am interested in comparing the efficacy of different methods of feature delineation using remote sensing data. The primary metric for this analysis will be a
completeness rating with a field verification assessment component. A completeness rating will be given based on the percentage of trail length digitized from the LiDAR maps compared to the trail length of the reference data collected using a handheld GPS unit. A hit-or-miss analysis of the field verified sample points was carried out and presented as the producer’s accuracy of the data. The percent completeness of a trail network digitized through remote sensing is a vital consideration when deciding if this technique has applications outside of this particular case.
5. Results
5.1. Hiking Trails
14 The results from mapping the two hiking trails in Umstead State Park are displayed in the table and figure below. After all of the trail segments were digitized for the Company Mill Trail and the Loblolly Trail it was apparent that the entire trail length could not be distinguished from the surrounding surface slopes and features. Of the 3.227 miles of the Loblolly Trail collected using a handheld GPS unit, 2.223 miles were able to be digitized manually from the 1 meter DEM products. This is 68.89% completeness rating. Of the 4.798 miles of the Company Mill Trail, 3.878 miles were digitized manually. This represents an 80.83% completeness rating. The ability to distinguish between the tread of the trail and the surrounding slope was intermittent.
5.2. Multi Use Trails
The heads-up digitization of multiuse trails from the LiDAR-derived digital elevation model allowed for a nearly identical outcome to the digitization of multiuse trails using digital
Loblolly Trail Company Mill Trail GPS length (miles) 3.227 4.798
LiDAR length (miles) 2.223 3.878
% Complete 68.9% 80.8%
15 orthophotos for prior Wake County Surveys. Similarly, my own digitization of the multiuse trails from orthophotos produced similar results to both the reference data and the LiDAR-derived features. More importantly however, no hiking trails could be digitized from digital orthophotos because of the forest canopy above. Shadows cast by trees and the trunks of trees themselves combined to obscure the trails beneath.
Length of Multi-Use trails Wake County Data 13.22 miles
LiDAR 13.18 miles
High Res Ortho 13.19 miles
16 From the close-up to the left, it can be observed that this method tended to fail in areas where the tread of the trail was flush with the surrounding topography. Large gaps in the trail lengths exist for Company Mill Trail where it follows Crabtree Creek on a nearly flat terrain. The distinctive “break in slope” profile necessary for this technique may
disappear entirely in flatter terrain. This would be a major consideration when attempting to extend this method to other study sites.
5.3. Field verification of sample points
In order to test the producer’s accuracy of the feature identification technique in in this report I randomly generated 15 sample points for each trail in ArcMap. These points were entered into a consumer grade GPS unit and located in the field. For both trails I found that 14 out of 15 sample points corresponded to actual points along the trail. This represents a 93.3% accuracy of features mapped corresponding to trail segments. As previously stated there are a number of accuracy issues with this type of GPS unit, so for a point to not register as a hit meant that its coordinates were considerably far off with from the real world location.
6. Discussion
Completeness ratings of 68.9% and 80.8% for the selected hiking trails in Umstead State Park were both very promising results. With the lower of the two ratings, I thought Loblolly Trail would be the easier of the two to map because it did not follow Crabtree Creek for as long as the Company Mill Trail. After further review I found a large
discrepancy between the GPS line I collected and the Wake County reference data I had for this trail. This gap in the LiDAR-derived trail suggests to me that a new trail segment was blazed after the 2013 LiDAR survey was carried out. The GPS track file that I collected for this project followed a trail segment that
had yet been constructed in the park. This would account for such a low percentage of trail completeness for the Loblolly Trail. The former trail segment was closed to the public which made further exploration of this discrepancy difficult.
Figure 4. Company Mill Trail, where it follows Crabtree Creek
17 Another issue I ran into during this study was the confusion, or misidentification of features while using only a grayscale hillshade map to digitize both hiking trails and multiuse trails. There were a number of historical road cuts throughout the park that were easily discernible but which did not represent existing trails. Additionally, drainage lines near trails introduced a level of confusion that could not be accounted for without the reference GPS track. This may be an issue inherent to this method and it may impose certain limitations with the applicability of this method to less established sites.
It may be possible to attain better
completeness results for trail delineation if the resolution of the digital elevation model was higher than the width of the trails. However, some trails lack the distinctive profile necessary for this method to work. Higher resolution, therefore, may not solve this
problem entirely. Because the data source used to produce the DEM in this study is generally considered high resolution for the purposes and scope of its creation, the issue of resolution is a moot point. Furthermore, informal trail
systems, or less built up trails, may lack this distinctive shape entirely. In these cases, the
technique described in this report may fail to reach the same level on completeness. A follow up study that involves using z exaggeration of the hillshade map to better aid visual analysis may lead to higher completeness ratings still. Also, an exploration of the raw, ground swath points may find a greater number of ground points than those that were pre-classified by the vendor. This may prove to extend this method further still.
7. Conclusion
Mapping hiking trails obscured by forest canopy was the primary research goal of this project and in conclusion I can say that the results are promising. The highest completeness rating I could attain for a single trail was 80.8% of the entire length. This method required that the tread of the trail be distinguishable from the slope it traversed which was not always the case in this study area. Also, a 1 meter bare earth digital elevation model of a forested landscape reveals a multitude of linear features into the analysis which introduces another set of challenges when dealing with feature identification. Using visual analysis of LiDAR-derived DEM products to manually digitize trails requires local knowledge of trail networks and at least some form of reference data to overcome these confusion issues. The issue of temporal resolution also emerged in my study when a trail segment was identified that was more recent than the LiDAR data. Although this method avoided more advanced image analysis techniques and was therefore not prohibitive from the standpoint of the expertise required, the cost and infrequency of such surveys may mean that hiking trails are too ephemeral for such studies.
For park managers, I believe a high resolution aerial LiDAR survey may offer a wide range capabilities in mapping features covered in forest canopy. With regards to trails, both formal and informal, the method described above could be the basis for a more comprehensive and accurate method of mapping forested trails.
18 References
Lee, H., Slatton, K. C., & Jhee, H. (2005). Detecting Forest Trails Occluded by Dense Canopies Using ALSM Data. IEEE,4(05), 3587–3590.
Marion, J. L., Leung, Y. F., & Nepal, S. K. (2006). Monitoring Trail Conditions: New Methodological Considerations. The George Wright Forums, 23(2), 36–49.
Sherba, J., Blesius, L., & Davis, J. (2014). Object-Based Classification of Abandoned Logging Roads under Heavy Canopy Using LiDAR. Remote Sensing, 6, 4043–4060.
19 Appendix
I. Primary Workflow: LAS to DEM in ArcMap
Create LAS Dataset from Umstead .las tiles Input files: 0766_007.las…0786_017.las Output Dataset: umstead.lasd
Coordinate system: import from .las file Compute Statistics
Make LAS Dataset Layer
Input LAS Dataset: umstead.lasd Output Layer: umstead_ground Class Codes: 2
LAS Dataset to Raster
Input LAS Dataset: umstead_ground Output Raster:
Value Field: ELEVATION Interpolation Type: Triangulation
Interpolation Method: LINEAR Output Data Type: FLOAT
20 GIS512 Introductory to Environmental Remote Sensing
Introductory LiDAR Assignment
Introduction
Researchers and Park Managers want to know more about the distribution of understory
vegetation at Umstead State Park near Raleigh, North Carolina. They would like you to identify areas of dense understory (low vegetation) in an area of interest in the park. These hotspots will be used to model habitat parameters in further studies. To perform the understory density assessment, a LiDAR point cloud will be imported in ArcMap and classified by height classes for the study area. Park Managers would also like to know more about the bare earth conditions for this particular study area. This tutorial is intended to show how to import LiDAR data into ArcMap and to demonstrate a few of the LAS tools found within the standard ArcToolbox.
Background
LiDAR has large number of research applications in forestry and environmental resources management. LiDAR sensors use scanning arrays of light energy to actively find distances and ranges. By collecting multiple returns of reflected light energy, LiDAR is capable of penetrating forest canopies to reveal features and surfaces obscured by tree cover. The analysis will involve classifying the point cloud by height for an area of interest according to ASPRS class codes for Low, Medium, and High Vegetation. Low vegetation points will be exported to a separate layer and a density raster will be created from LAS point statistics. Additionally, ground classified points will be interpolated into a high resolution Digital elevation Model of the study area.
Data
A number of local governments coordinated to release a contract for a high resolution, aerial LiDAR survey for all of Wake County. LiDAR data has been delivered in tiles in the .las file format with points being assigned a classification code of 2 for ground and 1 for unassigned points. Some noise reduction has also taken place for this dataset by the data vendor.
The 4 tiles that make up the study area are: 0776_014.las, 0776_015.las, 0776_018.las, and 0776_019.las. Use Windows Explorer to move these files into this assignments working directory.
21 Analysis Procedure
Part A: Create a Low Vegetation Density Map for area
Step 1. Import las data into ArcMap as LAS Dataset
1. Open a blank map in ArcMap.
Make sure the 3D Analyst and Spatial Analyst Extensions are enabled (Customize > Extensions… > Check box next to extension names)
Turn off background processing (Go to Geoprocessing > Geoprocessing Options… > Uncheck the Enable box below Background Processing)
2. Connect to Folder to where .las files are stored.
Note: You will not be able to see .las files in ArcCatalog. View .las files in Windows Explorer. An .lasd file, once created, will be visible in ArcCatalog.
3.1. Use the Create LAS Dataset tool to import .las point cloud into ArcMap. Search for “Create LAS Dataset” Tool in the Data Management Toolbox and open tool dialog box.
22 3.3. For the Output LAS Dataset
field, click the folder icon and save the output file as study_area.lasd.
3.4. Finally, check the option boxes for Compute Statistics and Store Relative Paths at the bottom of the dialog box. You can leave the Coordinate System field blank because the tool will read the projection from the first .las tile listed. The coordinate system is Lambert_Conformal_Conic_2SP if you are curious.
3.5. Make sure the dialog box looks the one to the right and then click OK to run the tool. The result will look similar to the image below.
You can see the range of elevation values in the table of contents. These values are the feet above sea level for the individual points.
If the point cloud fails to draw, your image will have red borders around each of the tiles. The points are still there but this means the computer is having a hard time displaying the points. If you zoom, then you can start to see the point cloud better.
23 4.1. Use the LAS Dataset 3D View button to examine the point cloud from different angles.
4.2. Use the Filters option to show only ground points. Because the points are already given classification codes of ground(2) and unassigned(1), ArcMap can apply filters
automatically.
4.3. The LAS Dataset Profile View button can let you explore the point cloud in specific orientations. Can you use to Profile View tool to hazard a guess at what the linear feature in the north east corner of the study area might be?
4.4. Continue to explore the LAS Dataset toolbar if you wish.
Step 2. Classify the Forest Structure into 3 Classes by height
2.1. Search for the Classify LAS By Height tool in the 3D
Analyst toolbox. It will be located in the Data management folder within the 3D Analyst Tools. Open the tool dialog box.
2.1. For the Input LAS Dataset field, use the drop down button to select the study_area.lasd layer.
24 2.3. Make Sure the Compute
Statistics box is checked in order to update the statistics but leave all the settings as default. You can check to make sure the dialog box is the same as the image to the right. Click OK to run the tool.
2.4. Finally, check to make sure the classification procedure worked by examining the Layer Properties for study_area.lasd.
3.1. Right click on the study_area layer in the table of contents and select “Layer properties…” to open its layer properties dialog box.
3.2. Open the Filter tab and make only the Low Vegetation points visible by checking the box next to the Low
Vegetation Classification Code. The selection will look like the box to the right.
3.3. Click Apply to apply the filter.
3.4. Apply a High Vegetation filter following the same steps. Which map shows a denser point cloud, High vegetation or Low vegetation?
3.4. You can turn the filter off by selecting All Classes again.
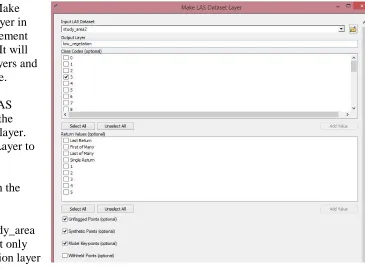
25 1.1.Search for the Make
LAS Dataset Layer in the Data Management Tools Toolbox. It will be under the Layers and Table Views tree.
1.2. Set the Input LAS Dataset field to the study_area.lasd layer. Set the Output Layer to low_vegetation.
1.3. Click OK to run the tool.
1.4.Turn off the study_area lasd layer so that only the low_vegetation layer is visible.
Step 4. Make Raster layer of LAS point statistics
1.1.Search for the Las Point Statistics as Raster tool in the Data management toolbox. It will be under the LAS Dataset tree.
1.2. For the Input LAS Dataset field, select the low_vegetation layer from the drop down box. 1.3. For Output Raster, name the raster low_veg.
1.4. For Method (optional field) Select POINT_COUNT.
26 Step 5. Find area of high density low vegetation
1.1. Build Raster Attribute Table (Data Management) for Low Vegetation Density raster if necessary.
1.2. Open Attribute table of density raster. Select cells with values greater than or equal to 90 points per 100 square feet. Find Sum of COUNT field using field statistics in attribute table. How many cells have a LiDAR count value of 90 points or higher? 447
Step 6. Change color ramp of density raster and produce a map layout
1.1. Include all required map elements and Export map as jpeg.
Part B. Interpolate LiDAR points into Digital Elevation Model
In order to create a digital elevation model of the study area it is necessary to first create a layer of only ground classified points. Open a new ArcMap map document if necessary.
Step 1. Import LAS data in ArcMap as .lasd data layer
1.1. Search for the Create LAS Dataset tool and open the tool dialog box.
1.2. Set Input files field to: 0776_014.las, 0776_015.las, 0776_018.las, 0776_019.las
1.3. Set the Output Dataset: study_area2.lasd
1.4. Leave Coordinate System field blank and check box to Compute Statistics
1.5. Click OK to run tool
27 2.1. Search for the Make LAS Dataset Layer
tool and open its dialog box.
2.2. Set the Input LAS Dataset field to study_area2.lasd
2.3 Set the Output Layer field to ground_points
2.4. Check the box next to 2 in the Class Codes field to filter only ground (class code 2) points
2.5. Leave all the other setting as default and click OK to run tool
Step 3. Interpolate ground points into 4 foot digital elevation model for study area.
3.1. Search for LAS Dataset to Raster(Conversion) to in ArcToolbox and open the tool dialog box.
3.2. For the Input LAS Dataset field, choose the ground_points layer created during the previous step.
3.3. For Output Raster field, save the output raster to your working directory as dem_4ft
3.4. Keep the Value Field set to
ELEVATION. This will take the z value associated with the las points as the value for the output raster cells.
3.5. Set the Interpolation Type radial button to Triangulation.
3.6. At the bottom of the tool dialog box, leave the Output data type at FLOAT and Sampling Type set to CELLSIZE
28 interpolate the LiDAR points to a DEM with 4 foot resolution.
3.8. Check that the tool settings match the image to the right and click OK to run the tool.
3.9. Change the color ramp of the resultant DEM to a contrasting color ramp like Surface.