A REFERENCE STRESS BASED ELASTIC FOLLOW-UP FACTOR FOR
CREEP CRACK GROWTH ANALYSES
Yuebao Lei 1 and David Dean
EDF Energy Nuclear Generation Ltd, Barnett Way, Barnwood, Gloucester GL4 3RS, UK 1
E-mail of corresponding author: yuebao.lei@edf-energy.com
ABSTRACT
In R5 creep crack growth analysis, a Z factor is required to include the effect of elastic follow-up on C(t) for secondary or combined primary and secondary loading. This Z factor should be a global parameter as C(t) itself is defined globally for a cracked body. In this paper, a reference stress based elastic follow-up factor, Zref, is defined
for power-law creep deformation and is then evaluated for centre cracked plates (CCP) under displacement controlled loading using the finite element (FE) method. The FE Zref is used in conjunction with the R5 method to
predict C(t) and the results show that the Zref defined in this way can be used to accurately predict the FE C(t) values.
The FE Zref is also shown to depend on the geometry of the cracked body and the creep law exponent.
INTRODUCTION
In a residual life assessment of a defective component operating at elevated temperature using R5 [1], it is necessary to evaluate the creep crack tip parameter, C(t), as a function of time, t. For secondary stress alone or combined primary and secondary loading, it is necessary to include the effects of elastic follow-up when evaluating C(t). This is achieved in R5 Volume 4/5 [1] by introducing an elastic follow-up factor, Z, into the reference stress relaxation equation [1, 2]. Previous investigations (e.g. [3]) show that the value of Z may have a strong effect on C(t) predictions in the transient creep period. However, R5 Volume 4/5 does not currently specify a detailed method for determining the Z factor for cracked bodies. It is only suggested that the Z factor for a cracked body may be estimated by increasing the Z factor for the corresponding uncracked body by unity. However, there is not sufficient evidence and theoretical background to validate this suggestion. In practice, a Z value greater than 3 has been found in [3] for a centre crack plate (CCP) under displacement controlled loading, where the Z factor for the uncracked plate was unity. The development of independent methods for calculating elastic follow-up factors for cracked bodies is therefore required to improve the accuracy of C(t) predictions for secondary stress and combined loadings.
In R5 Volume 2/3 [1], the elastic follow-up factor, Z, is a local parameter defined at a discrete point in the uncracked component, generally the point which is subjected to the most severe stresses. In a cracked body, the value of Z varies across the uncracked ligament, with higher values in the near crack tip region and lower values at points remote from the crack tip. In R5 Volume 4/5 [1], a Z factor is introduced to include the effects of elastic follow-up on C(t) when secondary loads are significant. This Z factor should be a global parameter associated with the relaxation of the reference stress as C(t) itself is defined globally for a cracked body. In this paper, a global elastic follow-up factor, Zref, is first defined based on the reference stress relaxation. It is then calculated using the
finite element (FE) creep analyses and is used in conjunction with the R5 approaches to predict C(t). In many cases, it is not possible to evaluate the reference stress directly from FE analyses. Therefore, the geometry and loading have been selected for this preliminary study to permit the reference stress to be obtained from the FE analyses.
BACKGROUND
In this section, the theory for C(t) prediction as described in [2] is briefly reviewed, showing the effect of the elastic follow-up factor, Z. In this paper, only elastic-creep analyses for pure secondary loadings are considered and all equations in this section have been simplified to reflect this.
Consider a power-law creep relationship where the creep strain rate,
ε
&
c, can be expressed asn c Dσ
ε =& (1)
( )
(
) (
)
(
)
(
)
(
0 1 1)
1 0 1 0 0 − = + + + ∗ n ref ref n ref ref n ref ref C t C ε ε Φ ε ε σ σ (2)
where σref is the total (combined primary and secondary) reference stress as a function of time, t,
0
ref
σ is the initial
total reference stress at t = 0, εref is the total reference strain at time t and reference stress σref,
0
ref
ε is the initial
reference strain at t = 0 and C0* is defined as
R C*= ref0 ref0 ′
0 σ ε& ,
(
)
2
p ref p
K
R′= σ (3)
where Kp and σrefp are the elastic stress intensity factor (SIF) and the corresponding reference stress for primary
load. Note that, for secondary stress only, a dummy Kp and corresponding σrefp for the structure and load type can
be used. The factor Φ in Eqn. (2) is a constant for pure secondary loading [2, 3]
(
−1)
for >1=Z Z Z
Φ (4)
where Z ≥ 1 is the elastic follow-up factor.
The current value of reference stress, σref , may be obtained by solving the relaxation equation. When there
is no crack growth, the reference stress rate, σ&ref , for secondary stress may be expressed as [1, 2]
(
ref c)
c ref Z E ε σ ε
σ& =− & , (5)
where ε&c
(
σref,εc)
is the creep strain rate for the current reference stress, evaluated at the current creep strain, εc,and E is Young’s modulus. The reference stress may then be obtained by solving Eqn. (5) for given initial conditions, σref =σref0 at t = 0.
The initial reference stress may be directly obtained from the J value obtained from FE analysis for secondary loading, Js, using the relationship between J and the reference stress [3]
(
JsE)
R ref ref Eref
0 0 0
, ε σ
σ = ′ ′ = (6)
where E´ is the effective Young’s modulus with E´ = E for plane stress and E´ = E/(1-ν2) for plane strain conditions,
where ν is Poisson’s ratio.
DEFINITION OF THE GLOBAL ELASTIC FOLLOW-UP FACTOR
The Z factor required in Eqn. (5) is a global parameter because Eqn. (5) is a reference stress based relaxation equation. The reference stress based Z factor, Zref, may be defined directly from the reference stress
relaxation equation, Eqn. (5), and for the creep law defined in Eqn. (1) may be expressed as
0 0 0 0 0 0 0 1
1 ref ref
ref c ref ref ref t n ref ref ref t n ref ref dt D dt ED Z σ σ ε ε σ σ ε σ σ σ σ − = − = −
The Zref defined in Eqn. (7) is a global parameter for a cracked body. It is expected that good results might
be obtained when Zref is used in the prediction of C(t) in conjunction with Eqn. (2) as Eqn. (2) is derived on the basis
of the reference stress concept [4, 5].
FE ANALYSIS OF ELASTIC FOLLOW-UP
FE creep analyses are performed to evaluate the Zref factor for CCP specimens under displacement
controlled loading. Note that the reference stress cannot be directly obtained from the FE analyses. However, the reaction forces during relaxation are measurable from the FE analyses and the reference stress relaxation with time may then be obtained by applying the reaction force to the specimen as a mechanical load. The Zref factor can then
be evaluated using Eqn. (7). C(t) values are also evaluated in the FE analyses which can then be used to validate the use of Zref in the C(t) prediction scheme.
A CCP specimen of width 2W and length 2L with a centre crack of length 2a is considered (Fig. 1). The plate is analysed under plane strain elastic-creep conditions and displacement controlled loading. The commercial FE package ABAQUS [6] is used in the creep analysis. The plate is idealised by 4-noded elements (ABAQUS type CPE4 [6]). Only one quarter of the plate is modelled because of symmetry of the specimen. The focused mesh is designed around the crack tip for C(t) calculation.
C(t) is calculated by the in-built contour integration functions on 45 contours around the crack tip. The radius of the first contour is about 1×10⁻⁵a and that of the 45th contour is about 0.4a. C(t) values presented in this report are the values obtained on the 3rd contour. Note that the values of C(t) obtained on the first two contours are omitted because the FE stress, strain and displacement fields in the small area very close to the crack tip are generally not accurate and the values of C(t) are, therefore, not reliable.
Elastic material is considered with E = 200GPa and ν = 0.3. For all analyses, a power-law creep law (Eqn. (1)) is used with D = 1.0×10⁻¹⁶ (for time in h and stress in MPa). For most of the cases, n = 5, however, n = 4 and 6 are analysed for two cases to study the creep law sensitivity of the Zref factor. For all analyses, small strain is
considered.
FE RESULTS
The reference stress as a function of time, t, may be determined from the following equation
( )
t( )
t(
(
)
(
aW)
)
ref = −
∞
1 3 2
σ
σ (8)
2L 2a
2W ∆
∆
Fig. 1 Geometry and dimensions of a CCP specimen under constant
displacement
0 1 2 3 4
0.0 0.2 0.4 0.6 0.8 1.0
FE Fitted result
3.0
0
ref c
ε ε
0
1−σref σref
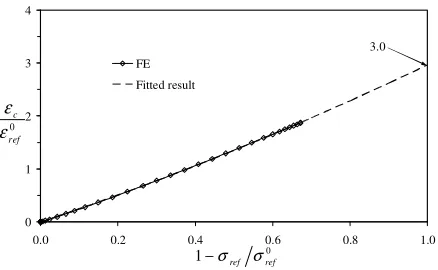
Fig. 2 The reference stress relaxation curve for a CCP specimen with L/W = 3 and a/W = 0.25 obtained from FE
where σ∞
( )
t is the reaction stress along the plate length measured at the remote ends of the plate from the FE creep analysis, as a function of time, t, and the plane strain Mises limit load [7] is adopted. A stress intensity factor (SIF) solution for a CCP specimen under tension in [8] is used to evaluate Kpwhen calculating R′. The creep strain due to the reference stress history may then be evaluated using
(
)
=∫
t n( )
ref refcσ D 0σ tdt
ε (9)
where the creep law defined by Eqn. (1) is adopted. Hereafter, the relationship between εc εref0 and
0
1−σref σref is
referred to as the “reference stress relaxation curve” which should start from the origin.
A typical reference stress relaxation curve obtained from the FE analyses for a CCP specimen with L/W = 3 and a/W=0.25 is shown in Fig. 2. In Fig. 2, the curve is fitted to data from the FE analyses and is then extended to
1
1−σref σref0 = , i.e., 0
0
=
ref ref σ
σ .
From Eqn. (7), Zref is the secant slope of the reference stress relaxation curve, which is generally a function
of the reference stress and, therefore, time, t. When the curve is a straight line, Zref is independent of time. From Fig.
2, the reference stress relaxation curve is not a straight line and the Zref factor is, therefore, a function of σref. The
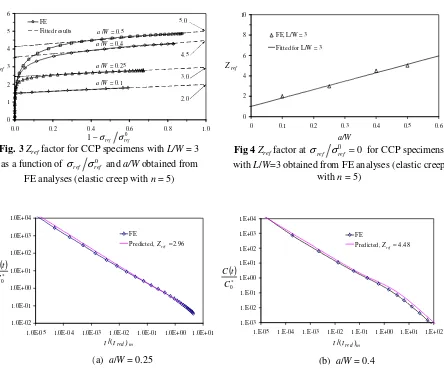
Zref values obtained from the FE data for four crack depths are plotted in Fig. 3, against
0
1−σref σref . The Zref
values evaluated from the fitted curves are also presented in this figure. From Fig. 3, the Zref values obtained from
both the FE data and the fitted curves are almost identical in the region 1 0 0.3
≥
−σref σref , however, the FE Zref
values are significantly lower than those evaluated from the fitted curves in the region 1 0 0.3
< −σref σref .
Moreover, some of the FE values of Zref in the early stage of relaxation, i.e. 1−σref σref0 <0.01, are less than 1. This
is believed to be because global unloading occurs during the early stage of the stress redistribution period when the fast stress relaxation in the high stress area near the crack tips may cause significant global stress relaxation. From Fig. 3, this effect depends on crack depth. For a/W = 0.1, it is almost negligible because the near-tip high stress area is small, however, for a/W = 0.5, it continues until 1−σref σref0 =0.3 because of the relatively large high stress area. Lei [3] has shown that higher Z factors result in conservative C(t) predictions. Therefore, the maximum Z value during the relaxation period may be used in the C(t) calculation to obtain conservative results. From Figs. 2 and 3, the maximum secant slope of the reference stress relaxation curve is at σref σref0 =0. The Zref values for CCP
specimens with L/W = 3 from the fitted curves at
σ
refσ
ref0=
0
are plotted in Fig. 4 against a/W. The best fit to the data in Fig. 4 for L/W = 3 and n = 5 shows that the maximum Zref factor may be represented by(
aW)
Zref =1+8.24 (10)
Zref = 1 when a/W = 0, which is the reference stress based Z for an uncracked plate under displacement controlled
loading. The current simplified estimation of the Z factor using R5 Volume 4/5 [1] suggests a constant of 2 for CCP specimens of any a/W. This is correct only for a/W < 0.1 as, from Eqn. (29), the elastic follow-up factor depends on the crack depth; for example, Zref = 5.1 for a/W = 0.5.
C(t) is predicted using Eqs. (2)-(5) with the Zref values obtained from FE in place of Z. The normalised C(t)
(normalised by ∗
0
C , defined by Eq. (3)) values are plotted in Fig. 5 for a/W = 0.25 and 0.4 in log-log coordinates,
against the normalised timet
(
tred)
m, where(
tred)
mis the redistribution time for an equivalent mechanical loadcorresponding to ref0 p ref σ
σ = and is defined as
(
)
0(
0)
(
(
0)
−1)
−1 ′= ′
= ref ref ref n
m
red E ED
t σ ε& σ (11)
DISCUSSION
For a cracked body, Zref may be affected by a number of factors. It has already been shown that Zref for a
CCP specimen increases with increasing a/W (see Fig. 4). Other factors that may influence Zref include the load
level, the creep exponent, n, and the ratio between the total length and the width of the plate, L/W. The dependence of Zref on these factors is discussed below.
Figure 6 compares two reference stress relaxation curves for a CCP specimen of L/W = 3 and a/W = 0.25 under different applied displacement values. The two curves from the two displacement levels are almost identical, indicating that the reference stress based Zref factor defined by Eqn. (7) is independent of load level.
Figure 7 compares the reference stress relaxation curves of two CCP specimens with a/W = 0.4 but different L/W ratios. From Fig. 7, the reference stress relaxation curves demonstrate that increasing L/W increases creep strain accumulation and hence the value of Zref.
Figure 8 compares FE reference stress relaxation curves of a CCP specimen (a/W = 0.25 and L/W = 3) for n = 4, 5 and 6. It is seen from the figure that the higher the n value, the higher the value of Zref. The effect of n on Zref
may also depend on the relevant crack depth, a/W. 0
1 2 3 4 5 6
0.0 0.2 0.4 0.6 0.8 1.0
Zref
FE Fitted results
0
1−σref σref a/W = 0.1
a/W = 0.25
a/W = 0.4
a/W = 0.5
2.0 3.0 4.5 5.0
Fig. 3 Zref factor for CCP specimens with L/W = 3
as a function of σref σref0 and a/W obtained from
FE analyses (elastic creep with n = 5)
0 2 4 6 8 10
0 0.1 0.2 0.3 0.4 0.5 0.6
a/W Zref
FE, L/W = 3
Fitted for L/W = 3
Fig 4 Zref factor at 0
0 =
ref ref σ
σ for CCP specimens
with L/W=3 obtained from FE analyses (elastic creep with n = 5)
1.0E-02 1.0E-01 1.0E+00 1.0E+01 1.0E+02 1.0E+03 1.0E+04
1.0E-05 1.0E-04 1.0E-03 1.0E-02 1.0E-01 1.0E+00 1.0E+01 t/(tred)m
FE Predicted,
( )
∗
0
C t C
96 . 2
=
ref
Z
(a) a/W = 0.25
1.E-03 1.E-02 1.E-01 1.E+00 1.E+01 1.E+02 1.E+03 1.E+04
1.E-05 1.E-04 1.E-03 1.E-02 1.E-01 1.E+00 1.E+01 1.E+02 t/(tred)m
FE Predicted,
( )
∗
0
C t C
48 . 4
=
ref
Z
(b) a/W = 0.4
CONCLUSION
In this paper, a reference stress based global elastic follow-up factor, Zref., has been defined and evaluated
using FE creep analyses for plane strain centre cracked plates under displacement controlled loading. The Zref. factor
has been investigated and used to predict C(t) in conjunction with the R5 C(t) prediction scheme. The results have been compared with C(t) values obtained directly from the FE analyses. The conclusions drawn from this investigation are as follows.
1. The reference stress based elastic follow-up factor, Zref, depends on the crack geometry, cracked body geometry
and the creep law exponent, n, but is found to be independent of load level. Zref = 1 for uncracked bodies
subjected to displacement controlled loading.
2. For the CCP specimens considered in this paper, Zref is also a function of the reference stress. The maximum
value of Zref during the relaxation of the secondary stresses can, when used in conjunction with the C(t)
prediction scheme, give close and conservative predictions of the FE C(t) values for all cases analysed in this paper.
3. Future work should consider developing methods for determining the Zref factor for cracked bodies under
combined primary and secondary stresses or thermal/residual stress only. 0
1 2
0.0 0.2 0.4 0.6 0.8
Displacement = 0.2 mm Displacement = 0.1 mm
0
ref c
ε ε
0
1−σref σref
Fig. 6 Comparison of the FE reference stress relaxation curves between different applied displacement values for a CCP specimen with L/W
= 3 and a/W = 0.25 (elastic creep with n = 5)
0 1 2 3 4 5
0.0 0.2 0.4 0.6 0.8 1.0
L/W = 3 L/W = 4.8
0
ref c
ε ε
0
1−σref σref
Fig. 7 Comparison of the FE reference stress relaxation curves between two CCP specimens with a/W = 0.4 but different L/W (elastic creep
with n = 5)
0 1 2 3 4
0.0 0.2 0.4 0.6 0.8 1.0
n = 4 n = 5 n = 6 Fitted results
0
ref c
ε ε
0
1−σref σref
2.5 3.0 3.6
ACKNOWLEDGMENT
This paper is published by permission of EDF Energy Nuclear Generation Ltd.
REFERENCES
[1] R5: Assessment procedure for the high temperature response of structures, Issue 3, British Energy Generation Ltd, 2003.
[2] Ainsworth, R A, Dean, D W and Budden, P J, Creep crack growth under complex loading, Journal of ASTM International, Vol. 8, No. 5, Paper ID JAI103847, 2011.
[3] Lei, Y, A validation of the newly extended method for the estimation of the creep crack tip characterising parameters using existing finite element results, British Energy Report E/REP/BDBB/0083/GEN/05, 2005. [4] Ainsworth, R. A., The assessment of defects in structures of strain hardening material, Engineering
Fracture Mechanics, 19, p.633-642, 1984.
[5] Ainsworth, R. A. and Budden, P. J., Crack tip field under non-steady creep conditions — I. Estimates of the amplitude of the fields, Fatigue Fract Engng Mater Struct 13 p.263-276, 1990.
[6] ABAQUS, V6.3, Hibbitt, Karlsson & Sorensen, Inc., Providence, RI, 2002.
[7] R6, Assessment of the integrity of structures containing defects, Revision 4, Amendment 8, British Energy Generation Ltd, 2010.