142
Optimization of the Value Chain of the Service
Process of the Automotive Mechanical Workshop:
Saint Louis T
. Through lean tools
Eng. Noe Aguila
Tecnological Institute of Apizaco, Apizaco Tlaxcala, México
1. ABSTRACT
In Mexico, when we talk about sources of employment, the term of Smes(Small and Medium Enterprises) is well known, since they generate more than 75% of jobs nationwide compared to large companies with only about 25% remaining. Its contribution to GDP (gross domestic product) is currently at least fifty percent, when writing this is clear that they are very important for the economy of Mexico, as well as for people who depend on income from these. When we think about above and we take a look at the current reality in our country we realize that most of the Smes presents a great problem since different studies indicate that they will close prematurely, projecting a life period of 2 to 5 years. It is important to note that both public and private policy do not support or encourage their development will follow this trend. And those people who in a certain moment played the role of entrepreneurs lose their savings and return to look for a job again. In this article we express the concern that we feel for them and we know that they require our support to remain working indefinitely, whereby, we took a look to one particular Enterprise that allowed us to carry out the research project to provide a method of continuous improvement through the Lean Manufacturing Philosophy that allow to optimize the service processes seeking to reduce the time of service (lead time), increase the productivity and on time delivery of the units, generating satisfied customers and reducing costs, which will allow the company to improve its profitability and continue with its operations in an indeterminate manner thus breaking the premature bankruptcy trend described above. 2. KEY WORDS
Lead Time: Time elapsed since the unit arrives for service until it is delivered to the client. VSM: Value Stream Mapping
Value Stream: Also known as a value chain. Represents all the activities carried out to generate the product or service.
Waste: All the activities that add time, effort, cost but not value. Smes: Small and Medium Enterprises
143
Gemba: Knowing the process, observing and verifying it directly without intermediaries, it is necessary to perform Kaizen properly
TT: Takt Time
TPS: Toyota Production System DAP: Process analysis diagram LM: Lean Manufacturing
3. THE AUTOMOTIVE MECHANICAL WORKSHOP: SAINT LOUIS T
It was inaugurated in January 2016 by the Owner is by profession Automotive Mechanic Engineer and after having served as Service Manager in a Recognized Car Brand and in order to meet the demand present in the south of Tlaxcala. The company starts as a family business, is located in a municipality of Tlaxcala, Mexico and has administrative and operational areas to cover all the activities from it. The Workshop has an approximate area of 600 m2, in addition to starting its operation with a workforce of 12 employees at the end of its first year of creation to make possible the fulfillment of the different labor responsibilities of the company. Saint Louis T is an automotive mechanic workshop dedicated to offering its services to the general public of the different brands and models existing in the automotive market.
4. THE PROCESS OF MECHANIC SERVICE
The service begins when the client arrives with his unit to the company, continues with the respective mechanical maintenance, goes through the washing and finishes with the delivery to the client and billing. The stages that encompass the process are detailed below:
1. Reception: The service starts from the moment the unit arrives at the facilities by the customer or by means of crane service, the owner is questioned about the minors due to the fault and information that can help detect and diagnose the fault quickly, once insurance of the failure is made a budget.
2. Quotation (Total Price of Service): Includes the cost of spare parts and workforce cost. For this, the client is provided with a budget with reactions in which there is a guarantee and which also guarantee the work. If the client does not accept this budget, 2 more are considered upon request:
I. If the customer wants spare parts in particular, the quotation is made but it is indicated that in spare parts of his choice the guarantee is not given in the labor of 2 months that is normally offered.
II. Just in case the client requires it, a third budget can be generated that would be repair or replacement of use. This option is the least recommended to the client because its security is involved.
If an agreement with the quote is reached the next step is purchase of spare parts, otherwise the client withdraws his unit and the process ends.
3. Purchase of supplies (Spare parts, oils, lubricants, auto parts and mechanical parts): Once accepted any of the aforementioned contributions, we proceed to purchase necessary supplies.
144
parts of the car that had been removed are assembled or assembled. And finally, the necessary tests are carried out to ensure that the service has been carried out successfully.
5. The Client is informed that his Unit is Ready: A call is made to the client to indicate that the service was successfully performed.
6. Cleaning and Vacuuming: It is offered to all customers as an added value to the service offered. And
the customer call starts immediately afterwards.
7. Final Checking: The client is shown that the anomaly has been repaired, sometimes a test is carried out if the client requires it, although the service is guaranteed for 2 months.
8. Invoice and Delivery: When the client gives the approval of his unit, he proceeds to charge the service. If you require an invoice, the corresponding VAT is added.
The guarantee offered is 2 months in labor and 30 days in spare parts.
Forms of payment: cash, check, bank transfer, with 3 and 6 month credit card without interest or debit. Mechanic Services:
Saint Louis T offers a variety of services and among the main ones are the following: Table 1. Mechanic Services
Motor adjustment Tune up of motor Brake system Suspension system Lubrication
Maintenance to standard and automatic boxes.
Levels of liquids
Alignment and balancing Clutch change
Change of distribution bands Diagnoses by Scanner Cooling system Hidraulic direction
Clients
Saint Louis T has clients from the public, private and particular sectors. The type of clients is described below:
Public Client: Public corporation, state enterprise or State Corporation is one that is owned by the government, be it national, municipal or any other administrative layer
Private Client: It is a type of commercial enterprise that is owned by private, non-governmental investors Particular Client: Physical persons that not belong to the government, either private enterprise.
The Public Clients units range from sedan patrols, Trucks f150, managerial units, 3.5 ton trucks and until commercial sedan cars and the like. While for private and particular clients units of different body types are attended, like: Pick up, Coupe, Minivan, Hatchback, Panel trasero, Familiar (wagon station), 4x4, and Sedan too, being this last one the most common attend en the Workshop.
Suppliers
145
the Owner is responsible for the collection in their own unit. Below is a list of suppliers from Tlaxcala and Puebla, although when you the part or piece required is not found, it is bought in Mercado Libre:
1. Auto Zone.
2. California Refactionary 3. Mexico Suspensions. 4. Libra Refactionary. 5. Rolcar Refactionary. 6. María Felix Refactionary
7. Direct in Agencies of Apizaco Tlaxcala of the different brands: Chevrolet, Nissan, Toyota, Honda, etc. 8. Rectified San Cosme
9. The Union Refactionary.
5. GEMBA AND BRAIN STORMING TO DETECT OPPORTUNITY AREAS
GEMBA
It starts knowing the facilities of the company, to become familiar with the process from beginning to end analyzing all the stages, activities and operations of the process from the reception unit until the delivery to the client. That by means of a detailed observation and having in mind lean thinking, areas of opportunity are detected:
• Certain quantity of spare parts, additives without any order or inventory as a surplus of previous services that possibly arose from the periodic volume purchase seeking to take advantage of discounts and obtain a decrease in input costs
• There are also cardboard boxes thrown away, scattered work tools, engine parts or engines throwing oil in some areas where mechanical maintenance is performed, impeding the free flow of personnel and the process itself, increasing the risk of an accident labor.
• Units (cars, vans) occupying space in the facilities stealing space that hinders being able to provide the service to other customers, which translates into economic losses.
• In addition, there are no formal procedures to follow to provide the service and each technician does it differently according to their experience, which causes the service to be extended in most cases.
• The management and administrative activities on the part of the owner are saturated since they include: dealing with the customer, receiving units, picking up parts in the state and outside it, which is counterproductive as new units arrive for possible services, these are removed in his absence so it would be good to start delegating responsibilities.
• Customers from 3 sectors are served, which are Public, Private and Private. The first two require credit service and in most services provided the collection of invoices is extended. The service to individuals is the clients that represent the only source of immediate liquidity to and that can contribute to cushion the offered credits to private and public sectors.
146
All above mentioned causes the service costs to skyrocket and causes delays in the delivery in the agreed time, generating a negative aspect and discomfort in the client. It is intended that with the use of the philosophy of lean manufacturing as well as the tools it comprises, the value chain of the process will be optimized and an improvement in the productivity of the SME will be generated that reduces its costs and increases profits.
BRAINSTORMING
This technique was used to gather main ideas about the causes that generate delay in the service which raise the costs of the same and discomfort in the client, the list is as follows:
• Empirical and different mechanical procedures for each mechanic. • There are no information meetings where feedback is given to staff. • There are no incentives.
• Poor motivation.
• There is not a defined Layout.
• The acquisition of spare parts and additives is slow. • It is not defined who corresponds certain activities. • There is no staff training.
• The owner's activities are too many which makes it difficult to focus on the planning of your company. • The daily activity of the company is done without prior planning.
• Long distances to capture tool and refactions which generates dead times. • No delegation of activities.
6. LEAN MANUFACTURING´S TOOLS & WASTE
LEAN TOOLS
1. Mapping of the Value Chain. 2. 5'S
3. Standard Work
4. Single-Minute Exchange of Die (SMED) 5. TPM
6. Kaizen 7. Takt Time 8. Kanban 9. Just in Time
THE 7 WASTE + 1 CONSIDERED IN LEAN.
147 1. Overproduction: It refers to produce more than the amount required by the customer, to manufacture products before they are needed, that is to produce faster than what is required.
2. Overinventory. It is the excess of raw material, work in process or finished product and its indefinite storage which generates a negative impact on the company translated into storage, transportation, handling or obsolescence costs, being able to suffer damages, hidden quality errors and others. Stock wastage is the result of having more stocks than is needed to meet immediate demand, so if material accumulates before and after the process indicates that the production flow is not continuous.
3. Overprocessing. It is the consequence of subjecting the product to unnecessary processes that do not generate value to the client and for which it is not willing to pay.
4. Defective Products. Are those products that are outside the specifications of the client and therefore do not add value to it. These mean a great loss of productivity since it includes extra work as a consequence of not having correctly executed a process. They generate direct costs of non-quality, consumption of raw materials, labor, reprocesses as well as dissatisfaction on the part of the client.
5. Transportation. It is the unnecessary transfer of raw materials, equipment, machinery and people that does not add value to the product. These unnecessary distances must be eliminated since it generates a cost, increases delivery times and risks of damage.
6. Waiting Times. Time that is lost when an operator waits for his machine to finish the job or operation, or otherwise when the machine stops waiting for the worker to make adjustments or even for both worker and machine to wait for work orders, materials or tools.
7. Unnecessary movements. It refers to unnecessary movements of people or equipment within the area of
a process. It is the result of a badly designed layout that forces the worker to make movements that force the normal displacements to have an inadequate position placing at risk the health of the worker and generating an unproductive environment. It should seek to reorganize work stations and staff to achieve a better layout and optimize space and movement.
8. Do not take advantage of the Talent, Capacity and Creativity of the people. In addition to the first 7, it is considered mute to waste human talent, not using the capacity of the staff for the needs of the position or the improvement of processes. The ideas of the members of the organization should be taken advantage of to detect possible changes, the non-involvement of the personnel generates demotivation in the employees, waste of resources and distrust in the improvement systems.
7. THE PROPOSED METHODOLOGY FOR CONTINOUS IMPROVEMENT TO OPTIMIZE THE SERVICE PROCESS OF SAINT LOUIS T
1. OWNER'S COMMITMENT AND USE OF STRATEGIC PLANNING
148
the occurrence of each day without any previous planning, for which the Owner is proposed to use a Lean strategic planning tool known as Hoshin Kanri to help in the planning of the company.
2. CHANGE OF WORK CULTURE THROUGH TRAINING
Once you have the Owner's commitment, the next step is to train staff about the Lean philosophy to start the transition process. The change of the work culture represents a new way of life and habits that requires breaking organizational paradigms. It should be clarified that "anyone can start the change, the problem is to keep it."
3. SELECTION OF SERVICE TO IMPROVE
It is necessary to select a service from the company to improve it, this service must be vital for the company, which represents losses, poor performance, high costs or higher sales and which, when improved, represents a significant impact in terms of cost reduction, improvement of productivity and profitability of it. At the beginning, the opportunity areas should be observed and identified directly from the process, followed by a brainstorm from the process experts to define a list of causes or factors that affect the performance of the process delaying it.
4. ACTUAL PERFORMANCE
Once the service to which we should focus to improve and apply the proposed methodology is selected, the main causes that affect the performance of the service must be monitored to prioritize them. The current VSM of the process is traced to obtain its performance, that is, the total time of the service. We also draw 2 types of process and operations diagrams to identify activities that represent waste and that should be optimized or eliminated.
5. ANALYZE THE PROBLEM TO IDENTIFY MAIN CAUSES THAT ORIGIN IT
The main causes that affect the performance of the process are identified and the value chain is analyzed in order to reduce the Lead Time to optimize it, also the Takt Time is also calculated according to the service selected to project the increase in annual sales by optimizing the value chain of the process and increasing the units attended annually compared with those that have been attended before the improvement project.
6. PROPOSE LEAN TOOLS TO IMPROVE THE SERVICE
Lean Tools are proposed to eliminate the main causes that delay the service which will allow us to reduce the Lead Time of the selected process thus optimizing the value chain.
7. ACTIONS TO KEEP THE LEVEL ACHIEVED
Recommended actions are recommended so that when implementing the Lean tools to the process they allow to reach and keep the desired level.
149
Once the service has been improved it is necessary to select a new one, as long as the owner's commitment continues and he is aware of the training of his staff so that steps 3 through 8 are repeated, which gives rise to an endless loop of continuous improvement of the process.
8. METHODOLOGY APPLICATION
1. OWNER'S COMMITMENT AND USE OF STRATEGIC PLANNING. Se debe tener el
compromiso del dueño en todo momento ya que el abandono por parte del mismo representa el fracaso del proyecto.
2. CHANGE OF WORK CULTURE THROUGH TRAINING. . You must be trained in the Lean
philosophy throughout the project. For which purpose to determine a training program that includes topics and dates.
3. SELECTION OF SERVICE. What was described in the section of step 5 Opportunity Areas of the company in question was obtained through the Japanese Gemba Technique together with the Brainstorming technique developed with experts from the process: Owner, Mechanics, mechanic assistants and administrative personnel. It allowed us to define the main factors or causes that affect the performance of the process delaying the service and so we can focus on working to minimize them, always seeking to achieve the main objective of this work, which is optimize the value chain of the service process to reduce the lead time and get as a consequence a cost reduction of it.
Main factors that delay the service:
1. Lack of Short Term Planning. The Owner performs all management and administrative, some of them are: payment and issuance of invoices, input collection, customer service, distribution of work, external service to engines, grinding discs, grinding heads, alignment, rolling and the rest of activities of the business and as well as the staff are carried out according to what is required without any previous planning .
2. Appropriate late diagnosis. For lack of training or experience in the staff. While in an agency service to correctly detect a fault it takes an hour and 2 to repair it.
3. Dead Times. By not having an order in the Tool and devices, and an efficient plant distribution. You
have to determine the cost $ that represents the SME per unit of time (cost per minute or hour).
4. New Models. Sometimes it turns out that for something as simple as changing a bulb you have to be an
expert since it involves disassembling many parts.
5. Mechanical Procedures without Standardization. Each mechanic performs his own procedure
according to his experience, including unnecessary activities that lengthen the maintenance time of the unit.
150
7. Emergency Services. When this happens, the acquisition of inputs is neglected, and the services provided within the workshop are delayed, because the vehicle is serviced directly at the fault site.
To select the service to be improved, the sales, profits and costs of the company are plotted, which are described below, followed by the corresponding graph:
The first one shows us the annual sales of 3 consecutive years until 2018, we can see that sales have decreased considerably in these 3 years and that if the company continues to go bankrupt as indicated by the studies on Smes that predict them 3 to 5 years of life.
In the second Graph we can see the same sales but according to the 3 types of clients to whom the company provides its services. And we can see that in 2018 private customers are the ones that represent the highest sales and therefore the highest profits.
In the third and fourth graph the profit and costs are presented respectively for each type of client and as well as the service of each most representative client (highest frequency).
151
$0.00 $500,000.00 $1,000,000.00 $1,500,000.00 $2,000,000.00
2016 2017 2018
ANNUAL SALES
$0.00 $200,000.00 $400,000.00 $600,000.00 $800,000.00 $1,000,000.00
SALES 2016 SALES 2017 SALES 2018
ANNUAL SALES BY CLIENT
PUBLIC PRIVATE PARTICULAR
$0.00 $20,000.00 $40,000.00 $60,000.00 $80,000.00 $100,000.00 $120,000.00
PUBLIC/ Adjustment
Engine
PRIVATE/ Tune Up
PARTICULAR/ Tune Up
ANNUAL PROFIT FOR REPRESENTATIVE SERVICE BY CLIENT
$0.00 $50,000.00 $100,000.00 $150,000.00 $200,000.00 $250,000.00 $300,000.00
PUBLIC/ Adjustment
Engine
PRIVATE/ Tune Up
PARTICULAR/ Tune Up
ANNUAL COST OF REPRESENTATIVE SERVICE PER CLIENT 2018
SAINT LOUIS T Figure 1. Saint Louis T. Graphics: Sales, Profit and Cost
152
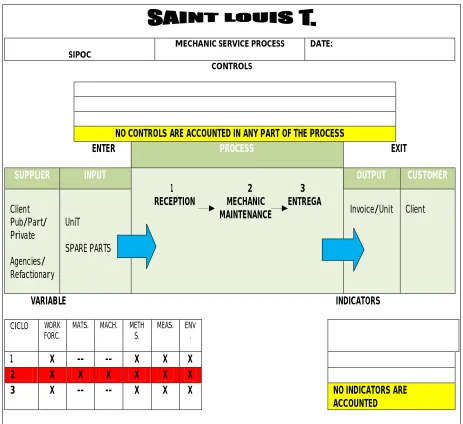
153 SIPOC diagram of the mechanical service
Observe the following flow diagram at a high level which, in turn, will allow us to carry out a detailed flow diagram. Allowing visualize the sequential steps of the mechanical process where we clearly observe its inputs, outputs, suppliers and customers. Showing important details about the beginning and ending of the process.
Table 2. SIPOC
SIPOC
MECHANIC SERVICE PROCESS DATE:
CONTROLS
NO CONTROLS ARE ACCOUNTED IN ANY PART OF THE PROCESS
ENTER PROCESS EXIT
SUPPLIER INPUT
1 2 3 RECEPTION MECHANIC ENTREGA
MAINTENANCE
OUTPUT CUSTOMER
Client Pub/Part/ Private
Agencies/ Refactionary
UniT
SPARE PARTS
Invoice/Unit Client
VARIABLE INDICATORS
CICLO WORK
FORC.
MATS. MACH. METH S.
MEAS. ENV .
1 X -- -- X X X
2 X X X X X X
3 X -- -- X X X NO INDICATORS ARE
154 4. ACTUAL PERFORMANCE
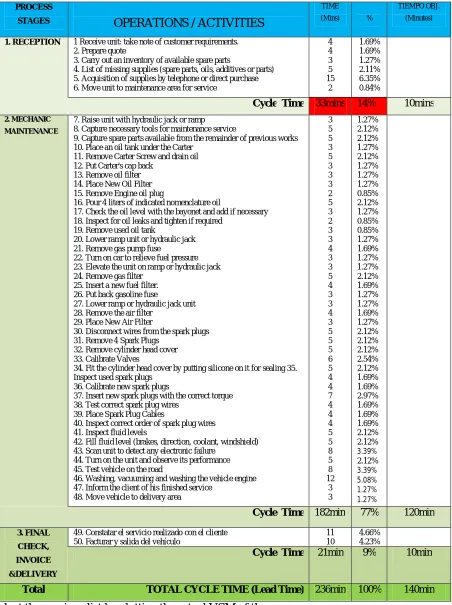
To measure the performance of the tuning service, a format was designed to follow up on the activities carried out and obtain the time of each one. The filling of these formats was completed from a total of 79 tunings made in 3 months and the results obtained are shown in the following figure:
Table 3. Lead Time: Tune up service Autos Sedan
NO PARTICULAR CLIENT SERVICE OFFERED
M1 (BETO)/ M2 (ALVARO) TIEMPO TOTAL (LEAD TIME) MINS
1 CORREA, MANUEL GUSTAVO TUNE UP SEDAN AUTOS 220
2 CASTAÑEDA AYAY,MODESTO TUNE UP SEDAN AUTOS 215
3 FERNANDEZ , JORGE LUIS TUNE UP SEDAN AUTOS 236
4 FERNANDEZ HUGO TUNE UP SEDAN AUTOS 225
5 HUAMANI MEDINA FIDEL FELIPE TUNE UP SEDAN AUTOS 236
6 LAZARO VASQUEZ MIGUEL TUNE UP SEDAN AUTOS 195
7 SARTILLO ROGELIO TUNE UP SEDAN AUTOS 190
8 LLAULLI RODOLFO TUNE UP SEDAN AUTOS 190
9 SOLANO CLAUDIO TUNE UP SEDAN AUTOS 196
10 LOZANO VASQUEZ MANUEL JESUS TUNE UP SEDAN AUTOS 189
11 SERDAN JUAN TUNE UP SEDAN AUTOS 196
12 VEGA HIPOLITO TUNE UP SEDAN AUTOS 200
13 CAMPOS MARCO ANTONIO TUNE UP SEDAN AUTOS 197
14 PERZ LUIS TUNE UP SEDAN AUTOS 180
15 PINARES TUNE UP SEDAN AUTOS 183
16 PINARES EDGAR TUNE UP SEDAN AUTOS 191
17 CASAS, LAURA GLADYS TUNE UP SEDAN AUTOS 181
18 PIZARRO JUAN TUNE UP SEDAN AUTOS 198
19 SEGURA, JOSE TUNE UP SEDAN AUTOS 193
20 PORTALRICARDO TUNE UP SEDAN AUTOS 178
21 PRADO KARINA TUNE UP SEDAN AUTOS 176
22 QUIROZ RAMON TUNE UP SEDAN AUTOS 187
23 ROSALES REYNA TUNE UP SEDAN AUTOS 188
24 RAMIREZ ALEX TUNE UP SEDAN AUTOS 178
25 RAMOS ALDO TUNE UP SEDAN AUTOS 187
26 REYNA RAMON, SERGIO ALEXANDER TUNE UP SEDAN AUTOS 185
27 REYNA VEGA DIEGO TUNE UP SEDAN AUTOS 182
28 RIOS CASAS HENRY JESUS TUNE UP SEDAN AUTOS 178
. TUNE UP SEDAN AUTOS 196
. TUNE UP SEDAN AUTOS 195
. TUNE UP SEDAN AUTOS 202
79 MORENO JESUS TUNE UP SEDAN AUTOS 220
We can notice in the previous table that the maximum time recorded is 236 minutes, so the time of each activity of particular client for tune up service was recorded in order to identify the waste, that is, the activities that do not add value , the list obtained with the corresponding associated time is the following:
Max. Time
Lead time: process takes an average of
199.9 mins.
155
Table 4. List of activities of the Actual Performance of Tune Up Service Particular Client Sedan Autos PROCESS
STAGES OPERATIONS / ACTIVITIES
TIME
(Mins) %
TIEMPO OBJ. (Minutes)
1. RECEPTION 1 Receive unit: take note of customer requirements. 2. Prepare quote
3. Carry out an inventory of available spare parts
4. List of missing supplies (spare parts, oils, additives or parts) 5. Acquisition of supplies by telephone or direct purchase 6. Move unit to maintenance area for service
4 4 3 5 15 2 1.69% 1.69% 1.27% 2.11% 6.35% 0.84%
Cycle Time 33mins 14% 10mins
2. MECHANIC MAINTENANCE
7. Raise unit with hydraulic jack or ramp 8. Capture necessary tools for maintenance service
9. Capture spare parts available from the remainder of previous works 10. Place an oil tank under the Carter
11. Remove Carter Screw and drain oil 12. Put Carter's cap back
13. Remove oil filter 14. Place New Oil Filter 15. Remove Engine oil plug
16. Pour 4 liters of indicated nomenclature oil
17. Check the oil level with the bayonet and add if necessary 18. Inspect for oil leaks and tighten if required
19. Remove used oil tank
20. Lower ramp unit or hydraulic jack 21. Remove gas pump fuse
22. Turn on car to relieve fuel pressure 23. Elevate the unit on ramp or hydraulic jack 24. Remove gas filter
25. Insert a new fuel filter. 26. Put back gasoline fuse
27. Lower ramp or hydraulic jack unit 28. Remove the air filter
29. Place New Air Filter
30. Disconnect wires from the spark plugs 31. Remove 4 Spark Plugs
32. Remove cylinder head cover 33. Calibrate Valves
34. Fit the cylinder head cover by putting silicone on it for sealing 35. Inspect used spark plugs
36. Calibrate new spark plugs
37. Insert new spark plugs with the correct torque 38. Test correct spark plug wires
39. Place Spark Plug Cables
40. Inspect correct order of spark plug wires 41. Inspect fluid levels
42. Fill fluid level (brakes, direction, coolant, windshield) 43. Scan unit to detect any electronic failure
44. Turn on the unit and observe its performance 45. Test vehicle on the road
46. Washing, vacuuming and washing the vehicle engine 47. Inform the client of his finished service
48. Move vehicle to delivery area
3 5 5 3 5 3 3 3 2 5 3 2 3 3 4 3 3 5 4 3 3 4 3 5 5 5 6 5 4 4 7 4 4 4 5 5 8 5 8 12 3 3 1.27% 2.12% 2.12% 1.27% 2.12% 1.27% 1.27% 1.27% 0.85% 2.12% 1.27% 0.85% 0.85% 1.27% 1.69% 1.27% 1.27% 2.12% 1.69% 1.27% 1.27% 1.69% 1.27% 2.12% 2.12% 2.12% 2.54% 2.12% 1.69% 1.69% 2.97% 1.69% 1.69% 1.69% 2.12% 2.12% 3.39% 2.12% 3.39% 5.08% 1.27% 1.27%
Cycle Time 182min 77% 120min
3. FINAL
CHECK,
INVOICE
&DELIVERY
49. Constatar el servicio realizado con el cliente 50. Facturar y salida del vehículo
11 10
4.66% 4.23%
Cycle Time 21min 9% 10min
Total TOTAL CYCLE TIME (Lead Time) 236min 100% 140min
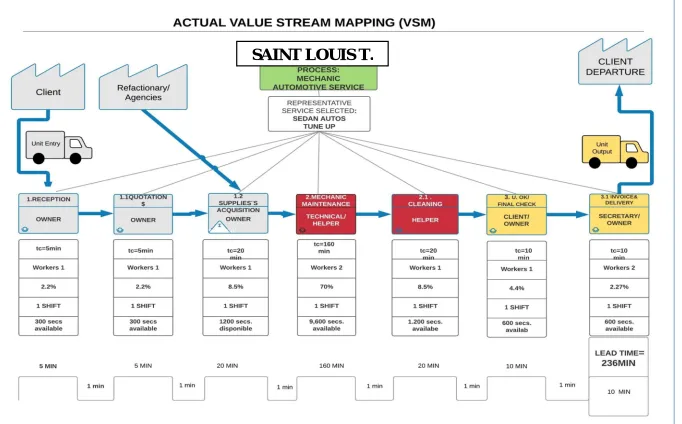
156 Figure 2. Actual VSM
157
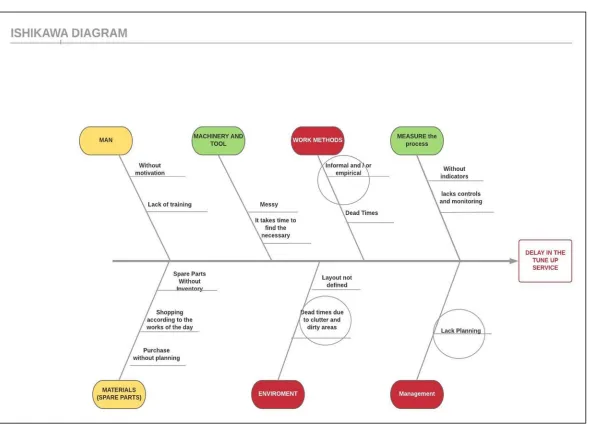
5. ANALYZE THE PROBLEM TO IDENTIFY MAIN CAUSES THAT AFFECT THE PERFORMANCE
158
From the previous Ishikawa diagram together with the Gemba and Brainstorming Techniques, 7 main factors are determined that affect the performance of the service by delaying it. For this reason, these 7 factors are monitored to determine those that are the main ones to attack them through the application and selection of a Lean tool. The monitoring of the factors was done with the help of the verification sheets obtaining the following results:
Check Sheet
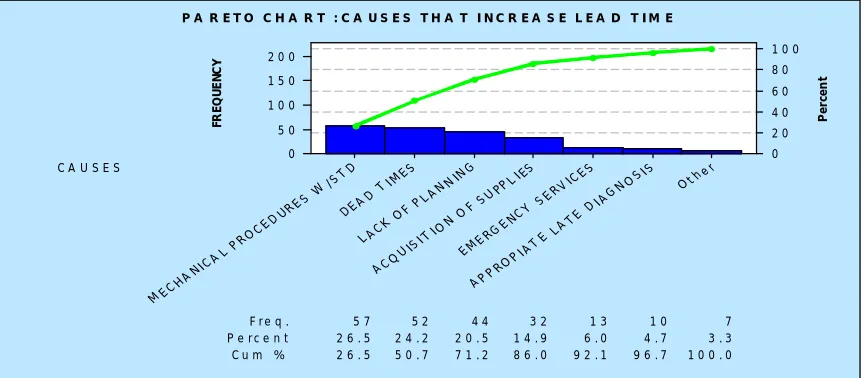
Through this tool the frequency of the 7 causes was monitored and that increase the total time of service (lead time). The Service was provided to 57 units in the 5 weeks monitored during the first month at the beginning of the project, belonging to clients of the 3 types that the SME owns: particular, private and public:
Table 5. Causes that delay the tune up service
CAUSES WEEK 1 WEEK 2 WEEK 3 WEEK 4 WEEK 5 FREQUENCY PERCENT
1. LACK PLANNING 8 9 11 7 9 44 20.5%
2.APPROPRIATE LATE DIAGNOSIS
2 3 2 2 1 10 5%
3.DEAD TIMES 10 9 12 11 10 52 24%
4.NEW MODELS 3 2 1 1 0 7 3%
5.MECHANICAL PROCEDURES WITHOUT STD
12 11 13 11 10 57 26.5%
6.ACQUISITION OF
SUPPLIES
6 5 7 6 8 32 15%
7.EMERGENCY SERVICES
3 2 3 3 2 13 6%
Units per week 12 11 13 11 10 57 100 %
The data of the verification sheet above are presented below graphically for a better interpretation:
F r e q . 5 7 5 2 4 4 3 2 1 3 1 0 7
P e r c e n t 2 6 . 5 2 4 . 2 2 0 . 5 1 4 . 9 6 . 0 4 . 7 3 . 3
C u m % 2 6 . 5 5 0 . 7 7 1 . 2 8 6 . 0 9 2 . 1 9 6 . 7 1 0 0 . 0
C A U S E S
O th e r
A PP R OP I
A TE L AT E
DI A G NO
S IS
E ME R GE N
C Y S E RV I
C ES
A CQ U IS I
T IO N O
F S U PPL I
ES
L AC K OF
P LA N NIN
G D EA D
TI M E S
M EC H AN I
C AL P RO C
E DU R E S W
/ST D
2 0 0
1 5 0
1 0 0
5 0
0
1 0 0
8 0 6 0 4 0 2 0 0 FR E Q U E N C Y P e rc e n t
P A R E T O C H A R T : C A U S E S T H A T I N C R E A S E L E A D T IM E
159
According to the Pareto chart above we can see the 3 most frequent causes that generate service delay: 1. Informal Mechanical Procedures
2. Dead Times by disorder. 3. Lack of Planning
Being the Mechanical Procedures the main cause of service delays. According to table 4, we can see that the stage that represents the longest process time is the mechanical maintenance area:
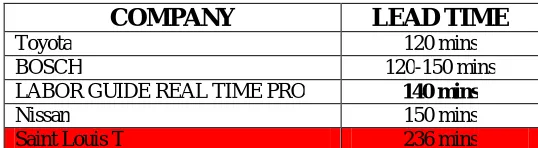
When analyzing the Lead Time of the service we can notice that it is in 236 min, and according to the Labor Guide for Real Time Pro developed by Dowell & Systems, we have that the ideal time for a Tune Up in a body type Sedan is 140 minutes, which compared with companies such as Bosch Service, Nissan and Toyota shw the time the same time. Dowell & Systems indicate in their Labor Guide that if our Lead Time in this service exceeds this time, it generates excessive costs and annoyance in the client. Dowell & Systems are experts in times of automotive mechanical services in USA. Observe the times of each company:
Table 6. Lead Time of leading companies in the automotive industry
COMPANY LEAD TIME
Toyota 120 mins
BOSCH 120-150 mins
LABOR GUIDE REAL TIME PRO 140 mins
Nissan 150 mins
Saint Louis T 236 mins
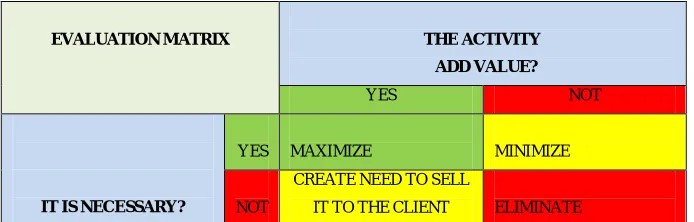
In order to reduce the total service time by 40%, that is, from 236 to 140 minutes, it is necessary to list all the activities that are carried out to carry out the service and be able to determine which ones represent waste. The Process Analysis Diagram is drawn up in which each activity is evaluated according to the Rother / Shook matrix (2003) to identify waste or activities that do not add value:
DELIVERY 9%
MECHANIC MAINTENANCE
77% RECEPTION
14%
160
Table 7. Evaluation Matrix to detect waste activities
EVALUATION MATRIX THE ACTIVITY
ADD VALUE?
YES NOT
IT IS NECESSARY?
YES MAXIMIZE MINIMIZE
NOT
CREATE NEED TO SELL
IT TO THE CLIENT ELIMINATE
The diagram of analysis of operations and apply the previous matrix to each of the 50 activities (table 4) of the current performance of the tuning service:
Table 8. Process Analysis Diagram (DAP) Tune Up Sedan Autos
Enterprise: Automotive Mechanic Workshop St. Louis T
Activity No. Activ.
Time Minutes
Objetive Time per stage
Responsable: Mechanic Boss Operation 38 175 Recepción: 10 minutos
Service: Tune up sedan autos Inspection 5 25 Mantenimiento Mecánico:120 minutos
Fecha de Emisión: Delay 1 15 Entrega: 10 minutos
Ultima revisión: Transport 3 13
Elaborated: Inventory 1 3
Client: Particulars Combined 2 5
Total 50 236 min
Etapas: Reception Maintnce Delivery Area Total Pyme:
568m2 Evaluación
Actividadesmt
VALUE PYME / VALUE CLIENT
Time Mins.
¿Add value?
¿Es necesa
ry?
Simbol
Action
1. Receive unit: take note of requirements 4 No Yes Minimize
2. Prepare quote 4 No Yes Minimize
3. Carry out an inventory of available spare parts 3 No Yes Minimize
4. List of missing spare parts 5 No Yes Duplicate, link to 3
5. Acquisition of supplies by telephone or direct purchase
15 No Yes Minimize
6. Move unit to maintenance area for service 2 No Yes Minimize
7. Raise unit with hydraulic jack or ramp 3 No Yes Minimize
8. Capture necessary tools to service 5 No Yes Minimize
9. Capture spare parts available from inventory 5 No Yes Minimize
10. Place an oil tank under the Carter 3 No Yes Minimize
11. Remove Carter Screw for draining 5 Si Yes Optimize
12. Put Carter’s cap back 3 Si Yes Optimize
13. Remove oil filter 3 Si Yes Optimize
14. Place New Oil Filter 3 Si Yes Optimize
15. Remove Engine oil plug 2 Si Yes Duplicat, link to 11
16. Pour 4 liters of oil 5 Si Yes Optimize
17. Check oil level and add if necessary 3 Si Yes Optimize
18. Inspect for oil leaks and tighten if required 2 Si Yes Optimize
161
20. Lower ramp unit or hydraulic jack 3 No Yes Minimize
21. Remove gas pump fuse 4 No Yes Minimize
22. Turn on auto to relieve fuel pressure. 3 No Yes Minimize
23. Lift on ramp or with auto hydraulic jack 3 No Yes Minimize
24. Remove gas filter 5 Si Yes Optimize
25. Insert a new fuel filter. 4 Si Yes Optimize
26. Put back 161asolina fuse 3 No Yes Minimize
27. Lower ramp or hydraulic jack unit 3 No Yes Optimize
28. Remove the air filter 4 Si Yes Optimize
29. Place New Air Filter 3 Si Yes Optimize
30. Disconnect wires from the spark plugs 5 Si Yes Optimize
31. Remove 4 Spark Plugs 5 Si Yes Optimize
32. Remove cylinder head cover 5 No No Eliminate
33. Calibrate Valves 6 No No Eliminate
34. Put on the cylinder head cover putting silicone on it
5 No No Eliminate
35. Inspect used spark plugs 4 No No Eliminate
36. Calibrate new spark plugs 4 No No Optimize
37. Put new spark plugs with the correct torque 7 Si Yes Optimize
38. Test right Ohms of spark plug wires 4 No No Eliminate
39. Place Spark Plug Cables 4 Si Yes Optimize
40. Inspect correct order of spark plug wires 4 No No Eliminate
41. Inspect fluid levels 5 Si Yes Optimize
42. Fill fluid level (brakes, direction, coolant, windshield)
5 Si Yes Optimize
43. Scan unit to detect any electronic failure 8 Si No Create need for sell to client
44. Turn on the unit and observe its performance 5 No Yes Minimize
45. Test vehicle on the road 8 No Yes Minimize
46. Washing, vacuuming and washing the vehicle engine
12 Si Yes Optimize
47. Inform the client of his finished service 3 No Yes Minimize
48. Move vehicle to delivery area 3 No Yes Minimize
49. Verify service with the client 11 No Yes Minimize
50. Bill and exit the vehicle 10 No Yes Minimize
Total 236
min
38 5 1 3 1 2
162 Waste identified in the previous Analysis Chart
1. Knowledge, Experience and creativity of employees. The company SAINT LOUIS T does not have a
system that takes advantage of the knowledge, experience and creativity of the employees, much less with a system of recognition towards them for their motivation. The problems that arise when providing the service are resolved by the Service Manager, for this reason if this is not found generates delays. The employee is not considered in this activity and the delegation of responsibility is something that must be taken into account.
2. Unnecessary movements. The mechanical technicians, assistants and other personnel have to move severe meters in the facilities, to look for tool and spare parts for the execution of the operations.
3. Inventory. There are 2 areas that store the spare parts, it does not have a safety inventory, that is, if a spare is missing, it must be ordered immediately and if the work is urgent, it must be purchased directly with the retailers. In this part only for the tuning service it has been suggested to handle a safety stock of filters, spark plugs and oil.
4. Overprocessing (Duplicate activities). There are activities such as pick up of spare parts and tools, removal and assembly of spare parts, inspections and filling of fluid levels in the mechanical maintenance stage, where duplicated activities are identified that can be merged with one another to form one due to inadequate coordination, since there is no procedure that standardizes these activities.
5. Transport. The movement of the unit is slow by units that occupy a place and have already been serviced, in addition to units that stay in “stand by “because the client has not given indications to continue with his service which generates slow fluidity and in part also to the disorder of the facilities.
6. Waiting Times. This waste is detected in the reception stage when there are no necessary spare parts these have to be ordered or bought what they generate, in the mechanical maintenance stage at the time of capturing the available spare parts, there is no inventory of them so the technician or owner personally have to look for them. In the supply of tools a similar problem is noticed since there is no detailed control over these, that is to say that some of these tools could be being used by some technician or in any case these are disordered making their location difficult.
In the step 6 a standard work sequence is proposed to achieve a time of 140 mins by analyzing the operations performed in the DAP described above
Tatk Time
We will analyze the service by calculating the Current Takt Time, which refers to the production rate that must be followed according to the time available based on a certain demand. The formula is Takt Time = Available Time / Demand.
The Takt Time formula is TT = Available Time / Demand, to make the calculation consider the following premises:
163
Monthly there is an average demand of 50 units for mechanic service, which annually represent 600 units. Providing a Tune Up service to a Type Sedan unit represents a sale of $ 1500 and a gain of 26.66% on the sale.
Now for the Takt Time Current the formula is applied as such, but for the calculation of the Future or desired Takt Time it is contemplated to lower the Lead Time to 140 minutes which is the time handled by Toyota, Bosch Service and the labor guide for real time pro, for this it was necessary to clear the demand of the original formula to obtain the number of services that we can perform with a Lead Time of 140 minutes, where D = Time Available / Tatk time
Now for the purposes of analysis and calculation, suppose that the number of services refers to Tune Up to particular customers since there are a variety of mechanical services. The approach we want to show is that if the model methodology is applied to the key services of each client, it will be possible to reduce the Lead Time considerably and, as a consequence, productivity will be improved and cost reduction will become eminent. Consider the following information (MXN):
Table 9. Takt Time
CONCEPT TT Annual Available
Time
Annual Demand Annual sales Annual
Income
TT Current 221min. 132,480 mins. 600 units $900,000 $240,000
TT Future 140 mins. 132,480 mins. 946 units $1,419,000 $378,000
-81mins = 40.6 % +346 units = 57,6% + $519,000 =
57.6%
+ $138,000= 57.6%
The Actual Lead Time of the Up Service is 236 minutes versus 221 minutes of Takt time. This TT indicates in theory that every 221 minutes 1 tuning service is performed but in practice it takes 236 minutes to do it. By identifying the waste and applying the Lean tools, it is projected to achieve a gradual reduction of 40% of the Total Lead Time from 236 minutes to 140. By reducing the service to 140 minutes with the same annual available time, 346 units could be served. Which represents an increase of 57.6% in demand.
The challenge is to achieve this and to be able to do so it is necessary to identify waste by mapping all the activities or operations that are carried out in the process. It has to be gradual starting with small goals from 5% up to 40%.
The Future TT would mean increasing sales by 57.6% which translates into an increase in profits of $ 138,000 per year. Take into account that the profit margin of the Tune Up service to Private customers is the lowest compared to the other clients’ key services:
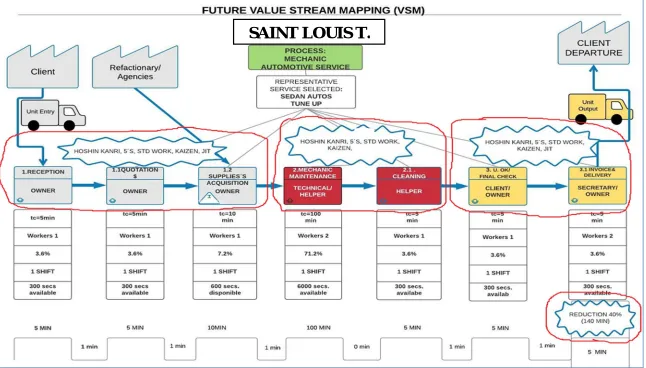
164 6. PROPOSE LEAN TOOLS FOR IMPROVEMENT THE SERVICE
The future VSM of the process shows the reduction from 236 minutes to 140 minutes of Lead Time, indicating the time per stage s and also indicates the Lean tools proposed to reduce the Lead Time of the process (Figure 5. Future VSM):
165
We can see tha the Lean Tools to apply for optimize the value chain in order of importance of the root causes that delay the service according to the obtained in the Pareto diagram, Ishikawa and Future VSM, we have:
1. Informal Mechanical Procedures (26.5 % )
Lean Tool proposed: Standard Work, at the beginning, standardize the tune up service for private customers of sedans and gradually standardize them in their entirety.
Date:
PROCESS: TUNE UP MOTOR AUTOS SEDAN
Pag. 1 de 1
Revised: Versión: 01
STAGES STD WORK TiME
(objetive)
%
1. RECEPTION 1. Receive unit and record requirements 2. Quotation and filling in the entry form 3. List of spare parts available and missing 4. Purchase of spare parts
5. Move unit to mechanical maintenance area
2 5 2 10 1 1.43% 3.57% 1.43% 7.14% 0.71%
Cycle Time 20 min 14.29%
2. MECHANIC
MAINTENANCE
6. Capture Tools to give service
7. Capture spare parts available from inventory 8. Lift unit on ramp or hydraulic jack 9. Place a tank for used oil under the Carter 10. Remove Engine oil plug and Carter screw 11. Remove used oil and screw Carter plug 12. Remove oil filter
13. Place New Oil Filter 14. Pour 4 liters of oil
15. Inspect for oil leaks and tighten if required 16. Descend unit
17. Inspect oil level, add if necessary and put engine oil plug 18. Remove gas pump fuse
19. Turn on car to relieve gas pressure 20. Turn off and lift unit
21. Remove gas filter 22. Place New Fuel Filter 23. Descend unit 24. Put back gasoline fuse 25. Remove the air filter 26. Place New Air Filter 27. Disconnect spark plug wires 28. Remove 4 Spark Plugs 29. Calibrate new spark plugs 30. Put 4 spark plugs 31. Place spark plug wires
32. Inspect and fill fluid levels if necessary 33. Turn on the unit and observe its performance 34. Inspect gas leak, tighten filter if required 35. Test vehicle on the road
36. Washing and vacuuming 37. Move vehicle to delivery area 38. Inform the client of his finished service
5 5 4 1 4 3 4 4 5 3 1 2 2 2 1 4 4 1 1 2 2 2 5 2 5 2 4 6 2 10 5 1 1 3.57% 3.57% 2.86% 0.71% 2.86% 2.14% 2.86% 2.86% 3.57% 2.14% 0.71% 1.43% 1.43% 1.43% 0.71% 2.86% 2.86% 0.71% 0.71% 1.43% 1.43% 1.43% 3.57% 1.43% 3.57% 1.43% 2.86% 4.29% 1.43% 7.14% 3.57% 0.71% 0.71%
Cycle Time 105min 75%
3. DELIVERY 39. Verify service with the client 40. Bill and exit the vehicle
5 5
Tiempo de Ciclo 10 min 7.14%
166
Elabored by: Noe Aguila Revised by: Pedro T.T Authorized by: Amaday T.G
2. Dead Times by disorder. (24.2 %)
Lean Tool proposed: 5´S Starting with Pilot Area: Mechanic Maintenance and gradually to all areas of the work shop.
3. Lack of Planning (20.5 %)
Lean Tool proposed: Hoshin Kanri for Strategic Planning, deployment program to support the owner in the planning of SME activities.
Lean tool proposed KAIZEN: Encourage the participation of employees in improvements in any area of the process by using a suggestion system through a suggestion box ()
Continuous training in Lean Manufacturing Philosophy to all staff
Actions to motivate staff such diplomas or worker of the month
Work under the Just in Time system regarding the acquisition of spare parts, supplies and implement a safety stock in spare parts that are in high demand to favor service time
7. ACTIONS TO KEEP THE LEVEL ACHIEVED
The following actions are proposed to maintain performance and guarantee the achievement of objectives: • Establishment of Indicators and Controls in the Process
• Publicize the results • Delegate activities
• Ensure continuous support from the Owner • Problem response plan
• Development of process manual • Standardize all services in full. • Statistical process control • Standard work
8. RESTART CONTINUOUS IMPROVEMENT CYCLE THROUGH THE SELECTION OF A NEW SERVICE TO IMPROVE IT
167 ACKNOWLEDGEMENTS
To my Children:
Alexander, Christofer and Brandon, for being the reason of my existence.
To my Wife Sandy: For all your support in good and bad times
To my Mom: I will never stop thanking my Mother for giving me everything I always need.
Especially thanks to Brothers and Sister:
Manuel: For always supporting me in all aspects and for being an example of an older brother
Leo: for supporting me selflessly in my development in Des Moines Iowa.
Mary: For being my initial guide in my professional development.
CONCLUSIONS
The application of the proposed Continuous Improvement Methodology to optimize the value chain the mechanical service process allowed us to identify the main opportunity areas of the Sme, as they are:
Informal mechanics procedures: what led us to suggest the Lean tool: Standard Work tool. Start with the key processes of each client and gradually standardize in full the services.
Dead times by disorder: Implement 5's starting with a Pilot area, which is suggested to be the area of mechanical maintenance and and little by little to all areas.
Lack of planning: Hoshin Kanri is suggested for strategic planning as a Lean tool to help the Owner in the activities that he develops in his Company, for which a deployment program will be developed as a guide and support of the same.
168
adoption of a Lean work culture through constant staff training and being open to change in improvement projects is a commitment that all staff must assume and be responsible for.
The most important element in the process that we must not forget and take into account for the improvement of it is to use the capacity, creativity and talent of the staff. It is common for improvement projects to forget this element when Taichi Ohno himself commented that instead of the Toyota Production System he would have preferred to call it the Thinking Production System since the success of the system depends on the personnel.
The realization of this research leads me to the following reflection. The most relevant thing that this research demonstrates is that the techniques.
Through the analysis and situational diagnosis of the company, it was possible to detect serious flaws in the service processes directly influencing customer satisfaction and the profitability of the company, such as the following:
• The information provided by the Ishikawa diagram in the "Methods" block indicates that the organization has the elements of work work, which refers to the standardization of the different work processes.
• The information provided in the exchange of ideas in relation to the waste detected also indicates that the company does not have a "Suggestion System" that takes into account, recognizes and rewards the improvement ideas provided by the staff.
REFERENCES
Hernández Matías Juan C. “Lean Manufacturing: Conceptos, técnicas e implantación”. Escuela de Organización Industrial. Primera Edición. España. 2013.
Rother & Shook (2003), Learning to see, alue Stream Mapping to Add Value and Eliminate MUDA, USA, Lean Enterprise Institute.
Womack, James P., Jones D. T, (1992). Lean Thinking, U.S.A, Ed. Mc Graw Hill
Womack, J. & Jones D.T, (1996). The machine that changes the world, U.S.A, Ed. Mc Graw Hill