384
Mechanical Properties of Bamboo Props and
Their Utilization as Sustainable Structural
Material
Onyeka, F. C*1, Nwoji, U. G2, Mbanusi, E. C3.
1
Department of Civil Engineering, Edo University, Iyamho, Edo State, Nigeria
2
Department of Civil Engineering, University of Nigeria, Nsukka, Nigeria 3
Department of Building, Nnamdi Azikiwe University, Awka, Nigeria
ABSTRACT
Problems faced in using bamboo as construction material are numerous, it ranges from water absorption and moisture content etc. To avoid this problems proper treatment and analysis of bamboo major properties should be done. The research is focused on the study of mechanical strength properties of bamboo to establish if bamboo would play a complementary role to wood in both furniture making and construction works as a sustainable material for the building industries. The study investigated on the mechanical properties of the bamboo in Nigeria aiming at assessing its suitability. The study showed that there is need for additional resources of material to complement wood. Experiments carried out on the mechanical and physical properties as well as bamboo reinforced column and beams. This test include tensile, compressive, bending, stiffness, elasticity, hardness and durability of bamboo to resist different forces or loads on structural members. Results showed that Bamboo has good tensile and compression strength. It was observed from this research that the strength properties of bamboo are higher than most of the soft and hard woods. The research revealed out that solid and hollow bamboo can equally be utilized for both furniture products and construction works. The researcher used observations, interviews and experiments for collecting data. The paper concludes by encouraging schools, colleges, small to medium enterprises and wood industries on the utilization of bamboo as a complementary resource material for furniture and construction works. It is recommended that proper analysis of strength properties and resource sustainability, renewable and availability of bamboo is done and bamboo plantations is encouraged to start in all the states of federation in Nigeria.
Keywords: Bamboo, Mechanical Property, Compressive and tensile strength, Bamboo Utilization, Bamboo Diversification
1.0 INTRODUCTION
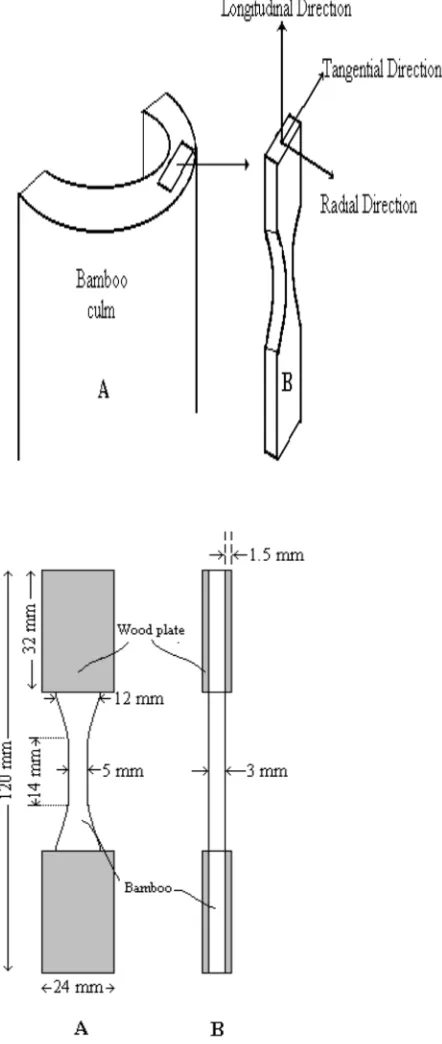
385 conditions as moisture, soil, and competition. Bamboo is an orthotropic material, which means it has particular mechanical properties in the three directions: longitudinal, radial, and tangential.
There are many species of bamboo growing in different parts of the world. Dendrocalamus strictus is commonly recognized as Calcutta bamboo [2], but also known as male bamboo [3], and solid bamboo [4]. Calcutta bamboo is the most widely used bamboo in India [5], especially for the paper industry. It is also used in house construction, basket making, mats, furniture, agriculture implement and tools handles. It is the most common species of bamboo cited in the some West Africa and India forest and is available in every state in India [6]. This species is also found in Burma, Bangladesh and Thailand, as well as being cultivated in Malaysia, Indonesia, Sri Langka and southern parts of the United States [2, 7].
Studies have been carried out to investigate the variation of these three directions, as well as between the internodes and nodes, and the variation between different locations in the culm [8, 10]. The mechanical behavior of the full size culm (round form) [11, 12-13] and small specimens [9, 7, 14-13] has been investigated. In this study, tension parallel to grain and the static bending tests for small size specimens were conducted.
The material under investigation is bamboo prop, with samples gotten from Ekuama-Okigwe bamboo forest, due to the high yield of bamboo in the area. Bamboo can be considered as prop in construction industries rather than steel or any material because Bamboo is able to resist more tension than compression. The fibers of bamboo run axial. In the outer zone are highly elastic vascular bundles that have a high tensile strength. The tensile strength of these fibers is higher than that of steel, but it’s not possible to construct connections that can transfer this tensile strength.
This study aimed at investigating the mechanical properties of two types of commercially available products, bamboo scriber and laminated bamboo sheets that qualifies it to be considered as prop in construction industries and compares these to timber and engineered timber products. This investigation is done by carrying out some test on the bamboo mechanical strength properties in order to establish the bamboo species that can be used for furniture and constructional works. These properties include the compressive strength, tensile strength and flexural strength. It has to address the suitability of bamboo to be used as a material for utilization in the furniture and construction material in alternative to wood or as an additional material to wood.
2.0 RESEARCH METHODOLOGY
Materials used includes different types of bamboo thus wet bamboo, dry, solid and hollow bamboo about a three year old bamboo was tested for mechanical strength properties and the bamboo culms were observed, its physical appearance, experiments for mechanical properties were carried out at the laboratory.
2.1 DATA COLLECTION
386 the researcher was the physical characteristics of Calcutta bamboo, the environmental conditions where bamboo grows, its effect to the strength properties, the uses of bamboo, samples of different pieces of bamboo were collected for testing the mechanical properties to determine their contributions to the strength (Tensile and Compressive Strength), elastic modules, fire resistance and shrinkage of bamboo as a material for use.
After harvesting, the bamboo culms were measured for color, weight, culm length, number of internodes per culm, internode length at bottom, middle and top, internode diameter at bottom, middle and top, and the culm wall thickness at bottom, middle and top. After these measurements, the culms were cut into 14 metres long segments, and were placed in a conditioning chamber for several weeks. Moisture content was monitored until equilibrium was reached at temperature of 20oC, and relative humidity of 65%.
Location 1 Location 2 Location 3 Location 4
Node
Internode
P hy s ic al pr op er ties PH and bu ffer capa city
M e c h a n ic a l p r o p e r t ie s W e tt a b ilit y
A d h e s iv e p e n e tr a t io n
Figure 1. Sampling technique from Dendrocalamus strictus culm.
The culms were carefully marked and labeled to identify the bottom to the top parts. The specimens for mechanical properties part (culms) were divided into four parts, each 14metres in length. Location 1 is the lower bottom part, location 2 is the upper bottom part, location 3 is the lower top part, and location 4 is the upper top part (Figure 1). Twenty culms were randomly selected from the thirty culms harvested.
The term “locations” used in this study was associated with the location along the culm length, while “section” refers to the nodes and internodes. The specimens were placed in a conditioning chamber before they were used for the experiments.
2.2 LABORATORY PROCEDURES
The Tension Parallel to Grain and Bending test was carried out on wet, dry, solid and hollow bamboo about a three years old Calcutta bamboo was tested for mechanical strength properties to detect the mechanical strength. To achieve these, following tests were carried:
(i) Tensile Strength (ii) Compressive Strength (iii) Flexural Strength test
(iv) Shear Strength test (v) Elastic Modulus test and (vi) Moisture Content test
Tension Parallel to Grain
387 radial and tangential. The width, thickness and length of the tension parallel to grain specimen were 12 mm (0.472 in.), 3 mm (0.118 in.) and 120 mm (4.724 in.) respectively.
388 Bending
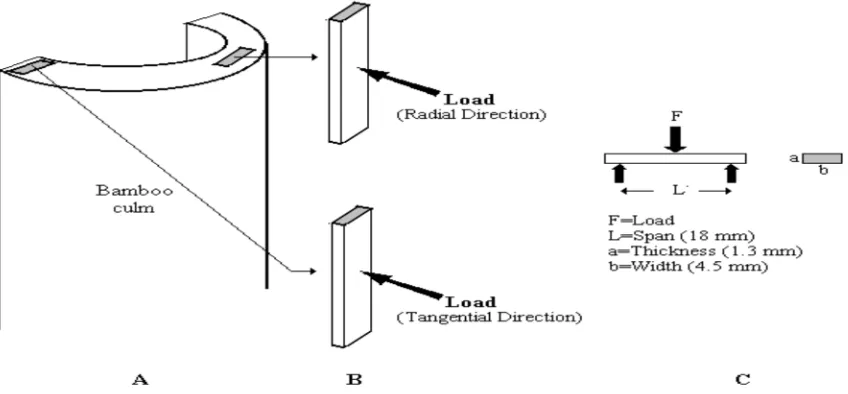
Specimens for the bending test were taken from the culm internodes as illustrated in Figure 1. Specimens from nodes were also taken from the culm to compare the value between internode and node. Comparisons of the bending strength and stiffness were made along the culm height, between nodes and internodes, as well as between radial and tangential directions.
Figure 4. Radial and tangential load direction. Half-culm (A), bending specimens (B), dimension of bending specimens (C)
2.3 ELASTICITY TEST/TENSILE TEST
In connection with the elastic modulus you can see an advantage in the use of slim tubes in relation to their cross section, too. The accumulation of highly strong fibers in the outer parts of the tube wall also work positive in connection with the elastic modulus like it does for the tension shear and bending strength.
There exists a perfect relation of the cross section of the tube, if you fall below or above it, the elastic modulus decreases (the higher the elastic modulus of the bamboo, the higher is the quality). Like the elastic modulus of solid wood the one of bamboo also decreases 5 to10% with growing stress. The enormous elasticity makes bamboo to be a very useful building material in areas with high risk of earthquakes. In Asia they still construct scaffolds with bamboo tubes.
First, the samples were cut to the proper size and shape. The length of the samples was largely determined by the distance between the nodes. Most of the samples tested were between 229 and 305 mm long. The widths of the samples were reduced since some of the original samples were too strong to be broken.
The thickness, along with the width, differed between the samples because Bamboo is a natural material whose physical properties vary. For this reason a careful dimensioning of the sample was done before testing the bamboo.
389 approximately halfway between the middle and the ends. The distance between these points was measured and recorded, along with the width and thickness. Measuring the dimensions of the specimens made it possible to determine the average stresses and strains in each sample. Since the information given in literature is limited with regards to the effect of the node on bamboo’s strength, it was desired to investigate this effect. Thus, some samples with nodes were selected to compare their behavior to un-nodded samples. The samples with nodes were prepared so that a node was at the center of the gauge length. To protect the bamboo from being crushed by the grips of the testing machine, aluminum tabs were fabricated and applied to the bamboo samples.
For tensile strength testing a Universal Testing Machine (MTS QTEST/150) machine was used.
This machine is able to apply tensile loads of up to 34 kips (151 kN).
Fig 5: Testing Elastic/Tensile strength using Universal Testing Machine (MTS QTEST/150
machine)
2.4 COMPRESSIVE STRENGTH/ SHEARING STRENGTH
Especially for the construction of the bamboo tube joining it is important to consider the shearing resistance. The influence of the distance of the shearing surface decreases with growing length of shearing surface. At a wall thickness of 10 mm the shearing strength is about 11% lower than at a tube with a wall thickness of 6 mm; this could be explained by the distribution of the high-strength fibers per cross section surface. The Values of the tables are from intern odium material. The values for the node material are about 50 % higher.
390 2.5 FLEXURAL (BENDING) STRENGTH
A props analyzed common bamboos: diameter of tubes= 70-100 mm, wall thickness= 6-12 mm with a span of 3-60mm. The elastic deflections were minimum =1/25-9 and maximum 1/16and as an average 1/20-1 of the spans. Where a deflection in the construction was unavoidable and annoying, one could bend the recently harvested tubes so that you get a super elevation, which later will be compensated under the working load.
Materials:
I. A ready-mixed concrete with a nominal strength of 27 N/mm2 and a specified slump of 18cm was used. A main bamboo rebar was manufactured by tying two split moso bamboos (botanical name: Phyllostachys pubescens) with a section size of 30 × 10 mm so that their inner sides faced each other. Sliced moso bamboo with a section size of 15 × 3.8 mm was used as a stirrup. The bamboo stirrup was bent in hot water after its epidermis was removed using a planer. To prevent the bamboo from absorbing water and to strengthen the bond between the bamboo rebar and the concrete, polymer cement mortar was sprayed on the surface of the bamboo rebars after they were assembled using tie wires.
II . Three cylindrical concrete specimens, 100 mm in diameter and 200 mm in height, were prepared for compressive and splitting tensile tests, and both tests were carried out in accordance with the Japan Industrial Standard. The tensile strength and Young’s modulus of the main bamboo rebar were measured using six dumbbell-shaped specimens, three of which included a node in their straight part, and the other three did not include the node.
Fig 7: Bending test of Bamboo in Progress
391 3.0 RESULTS AND DISCUSSION
Tests were carried out to detect the mechanical strength properties of bamboo including physical, mechanical using different types of bamboo thus wet bamboo, dry, solid and hollow bamboo about a two year old bamboo was tested for mechanical strength properties and the bamboo culms were observe its physical appearance, experiments for mechanical properties were carried out.
Analysis of covariance was performed on the mechanical properties with relative density as the covariate. The linear model considered for the study is shown below:
yij = µ+ αi + xij+ £ij (1)
Where: y = Observation (mechanical property), µ = Mean, α= Treatment, xij = Covariate
(relative density), ¥= Regression coefficient, £= Error
Analysis of variance was performed (using type III: SS (treatment)) on the mechanical properties of different locations. The null hypothesis for the ANOVA is shown below.Ha: At least one of
the α differs from 0.
Estimation of mechanical properties was made using the covariate information, and the adjusted mean values were calculated. The treatment levels were compared using the least squares means and Turkey-Kramer test.
3.1 RESULT PRESENTATION
Table 1: Analysis of covariance of tension strength and stiffness at Locations 1 and 2, and sections of Dendrocalamus strictus culms. Vertical axis: Tensile Stress (N/mm2)
and Tensile Modulus (N/mm2 X. Note: Means with the same letter are not significantly
different at p < 0.
Source of
variation
DF Sum of Squares F-value
Location:
αult
E
pl
1
1
1
22100.4
412325296.4
43635.0
16.22 (HS)
13.21 (HS)
392
Section
αult
E
pl
1
1
1
49972.1
5096112.2
11258.6
39.92 (HS)
0.13 (NS)
12.72 (HS)
MOR means Modulus of Rupture (Sult) and MOE means Modulus of Elasticity and SPL means Strength at Proportional Limit. (HS) indicates significance at the 1% level of probability. (NS) indicates not significant. Section is nodes and internodes. Strength and stiffness unit in N/mm2.
Fig 8: Adjusted tensile properties of Dendrocalamusstrictusat locations 1 and 2 of culm.
Table 2: Linear regression equation, mean value and adjusted mean value for the comparison of tensile strength and stiffness at different locations.
7 Mean Value Based
on Mean Relative
Density of Location
RD1=0.6920;RD2=0.6908
Adjusted
Mean Value
of Different
Locations
(N/mm2) Mean Value
(N/mm2)
Standard
Deviation
0 20 40 60 80 100 120 140 160 180 200
U lt .S tre s s S tre s s a t P ro p . L im it
E
location 1
393
Location (Internodes only)
αult.1 = -17.65 + 251.14RD1
αult.2 = 11.80 + 251.14RD2
E1 = 4002.92 + 30030.70RD1
E2 = -8024.25 + 30030.70RD2
αpl.1 = -8.16 + 149.82RD1
αpl.2 = 33.21 + 149.82RD2
156.1
185.3
16778.7
12722.8
95.5
136.7
37.7
41.8
6952.0
4496.3
33.8
26.7
156.0
185.4
16761.5
12740.2
95.4
136.8
a b
a b
a b
RD is Relative Density. Number 1 is denoted for location 1, number 2 is denoted for location 2.
Means with the same letter are not significantly different at p < 0.01 by Turkey-Kramer Test and the General Linear Model Procedure. The mean tensile modulus of the internodes was 16,779 N/mm2 while the value for nodes was 17,771 N/mm2. The adjusted mean values of the internodes and nodes with, relative density as the covariate, were 17,422 N/mm2 and 16,777 N/mm2 respectively.
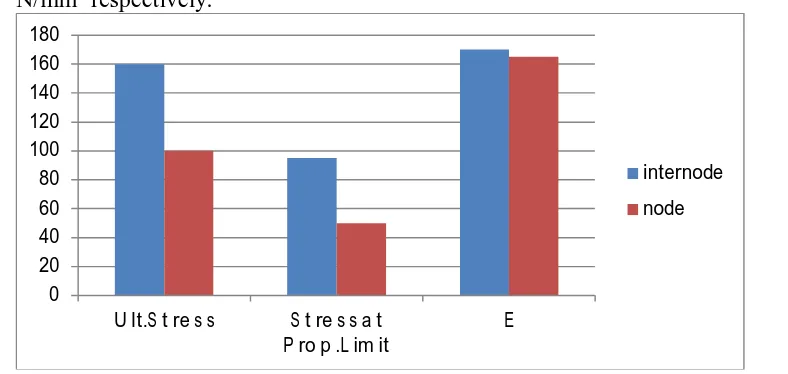
Fig 9: Adjusted tensile strength and stiffness. Value of Dendrocalamus strictusat different sections of culm.
Y-axis-Tensile Stress (N/mm2) and Tensile Modulus (N/mm2 X100)
0 20 40 60 80 100 120 140 160 180
U lt.S t re s s S t re s s a t P ro p .L im it
E
internode
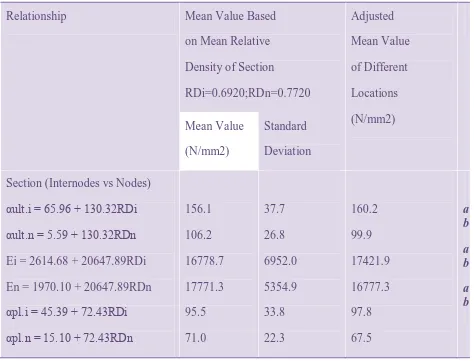
394 Table 3: Covariance for linear regression equation, mean value and adjusted mean value
for comparison of tensile strength and stiffness at different sections.
RD is Relative Density. Letter I, is denoted for internodes, letter n, is denoted for nodes.
Means with the same letter are not significantly different at p < 0.01 by Tukey- Kramer Test and the General Linear Model Procedure. Internodes and nodes are from location 1 only.
Relationship Mean Value Based
on Mean Relative
Density of Section
RDi=0.6920;RDn=0.7720
Adjusted
Mean Value
of Different
Locations
(N/mm2) Mean Value
(N/mm2)
Standard
Deviation
Section (Internodes vs Nodes)
αult.i = 65.96 + 130.32RDi
αult.n = 5.59 + 130.32RDn
Ei = 2614.68 + 20647.89RDi
En = 1970.10 + 20647.89RDn
αpl.i = 45.39 + 72.43RDi
αpl.n = 15.10 + 72.43RDn
156.1
106.2
16778.7
17771.3
95.5
71.0
37.7
26.8
6952.0
5354.9
33.8
22.3
160.2
99.9
17421.9
16777.3
97.8
67.5
a b
a b
395 Table 4: Covariance of bending strength and stiffness at different directions, locations and
sections of Dendrocalamus strictus culms.
(HS) indicates significance at the 1% level of probability. (NS) indicates not significant
Fig 10: Adjusted bending strength and stiffness of Dendrocalamusstrictusfor different directions in the culm.
Y Axis---Bending Strength and Stiffness (N/mm2).
0 20 40 60 80 100 120 140 160
mor spl MOE(X100)
RADIAL
TANGENTIAL
Source of
variation
DF Sum of Squares F-value
Direction:
MOR
E
SPL
1
1
1
3128.1
250602.2
39.9
1.30(NS)
0.02(NS)
0.03(NS)
Location:
MOR
E
SPL
3
3
3
33563.8
71711944.5
9546.6
7.03(HS)
2.32(HS)
3.37(HS)
Section
MOR
E
SPL
1
1
1
462.5
13850064.7
2374.4
0.28(NS)
1.59(HS)
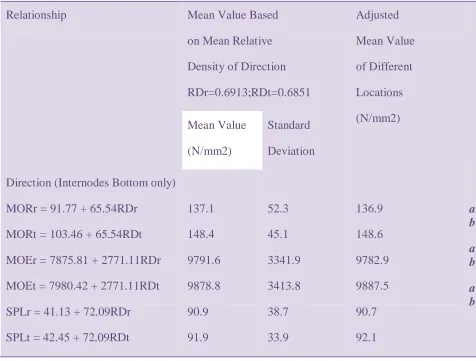
396 Table 5: Covariance for linear regression equation, mean value and adjusted mean value
for the comparison of bending strength and stiffness for different direction.
RD is Relative Density. Letter r, is denoted for radial direction, letter t, and is denoted for tangential direction. Means with the same letter are not significantly different at p < 0.01 by Tukey-Kramer Test and the General Linear Model Procedure. Radial and Tangential Specimens are from location 1 only.
Relationship Mean Value Based
on Mean Relative
Density of Direction
RDr=0.6913;RDt=0.6851
Adjusted
Mean Value
of Different
Locations
(N/mm2) Mean Value
(N/mm2)
Standard
Deviation
Direction (Internodes Bottom only)
MORr = 91.77 + 65.54RDr
MORt = 103.46 + 65.54RDt
MOEr = 7875.81 + 2771.11RDr
MOEt = 7980.42 + 2771.11RDt
SPLr = 41.13 + 72.09RDr
SPLt = 42.45 + 72.09RDt
137.1
148.4
9791.6
9878.8
90.9
91.9
52.3
45.1
3341.9
3413.8
38.7
33.9
136.9
148.6
9782.9
9887.5
90.7
92.1
a b
a b
397 Fig 11: Adjusted bending strength and stiffness of Dendrocalamusstrictusat different section of culm.(N/mm2)
Table 6: Covariance for linear regression equation, mean value and adjusted mean value
for the comparison of bending strength and stiffness at different sections.
0 20 40 60 80 100 120 140 160 180
MOR SPL
INTERNODE
NODE
Relationship Mean Value Based
on Mean Relative
Density of Section
RDi=0.6863;RDn=0.7080
Adjusted
Mean Value
of Different
Locations
(N/mm2) Mean Value
(N/mm2)
Standard
Deviation
Section (Internodes vs Nodes)
MORi = 90.50 + 90.03RDi
MORn = 86.17 + 90.03RDn
MOEi = 10044.06 + 559.53RDi
MOEn = 9295.14 + 559.53RDn
SPLi = 91.77 – 0.78RDi
SPLn = 101.58 – 0.78RDn
152.3
149.9
10428.1
9691.3
91.2
101.0
39.5
42.4
3073.0
2774.1
30.5
30.3
153.2
148.9
10433.8
9684.8
91.2
101.0
a b
a b
398 RD is Relative Density. Letter i, is denoted for internodes, letter n, is denoted for nodes
Means with the same letter are not significantly different at p < 0.01 by Tukey- Kramer Test and the General Linear Model Procedure. Internodes and nodes are from location 1 only.
Fig 12: Bending Strength and Stiffness (N/mm2)
Note: Means with the same letter are not significantly different at p < 0 .0 1 by Tukey’s Standardized range (H S D) test.
0 20 40 60 80 100 120 140 160 180 200
MOR SPL MOE(X100)
Location1
location2
location3
location4
Relationship Mean Value Based
on Mean Relative
Density of Locations
RD1=0.6863;RD2=0.7218
RD3=0.6778;RD4=0.7225
Adjusted
Mean Value
of Different
Locations
(N/mm2)
Mean Value
(N/mm2)
Standard
399 Table 7: Covariance for linear regression equation, mean value and adjusted mean value
for the comparison of bending strength and stiffness at different location.
RD is Relative Density. Number 1 to 4 are denoted for location 1 to location 4 using Kramer Test and the General Linear Model Procedure.
Locations
MOR1 = -16.17 + 245.83RD1
MOR2 = -28.16 + 245.83RD2
MOR3 = -16.40 + 245.83RD3
MOR4 = 7.83 + 245.83RD4
MOE1 = 3565.96 + 9998.01RD1
MOE2 = 4089.37 + 9998.01RD2
MOE3 = 4649.84 + 9998.01RD3
MOE4 = 5134.51 + 9998.01RD4
SPL1 = 16.22 + 109.30RD1
SPL2 = 20.59 + 109.01RD2
SPL3 = 25.93 + 109.01RD3
SPL4 = 34.55 + 109.01RD4
400 Table 8 Summary of the adjusted bending strength and stiffness of bamboo prop from
Ishagu-Okigwe and Uturu and Isikwuato.
Relationship Adjusted Mean Value
(N/mm2)
Isiagwu okigwe
(RD=0.85)
Uturu isikwuato
(RD=0.57)
Locations
Bαult.1 = -16.17 + 245.83RD1
Bαult.2 = -28.16 + 245.83RD2
Bαult.3 = -16.40 + 245.83RD3
Bαult.4 = 7.83 + 245.83RD4
BE1 = 3565.96 + 9998.01RD1
BE2 = 4089.37 + 9998.01RD2
BE3 = 4649.84 + 9998.01RD3
BE4 = 5134.51 + 9998.01RD4
Bαpl.1 = 16.22 + 109.30RD1
Bαpl.2 = 20.59 + 109.01RD2
Bαpl. 3 = 25.93 + 109.01RD3
Bαpl.4 = 34.55 + 109.01RD4
192.78
180.80
192.56
216.79
11,764
12,288
12,848
13,333
109.13
113.50
118.84
127.46
123.95
111.96
123.72
147.95
9,265
9,788
10,349
10,833
78.52
82.89
88.23
401 3.2 DISCUSSION OF RESULTS
I. TENSION PARALLEL TO GRAIN
Tensile Strength and Stiffness
The tensile strength and stiffness of locations 1 and 2 (Locations are stated in the table of results i.e. Table 1 to 8), as well as internodes and nodes are discussed. The average moisture content for the specimens was 11.4%. Table 1 shows the analysis of covariance of this value for the different locations and sections. The analysis shows that there are significant differences between locations along the culm height for the tensile strength and stiffness values. The values between internodes and nodes are also significantly different from each other, except for modulus of elasticity (MOE). Table 1 shows the value of linear regression equation, mean value, and the adjusted mean value used for the comparison between locations. The mean tensile strength ( ult) of location 1 was 156.14 N/mm2 while location 2 was 185.30 N/mm2. The difference
between the locations was 29.16 N/mm2. The adjusted mean value of the locations 1 and 2 with
relative density as the covariant was 156.00 N/mm2 and 185.44 N/mm2. The difference is increased to 29.44 N/mm2. There was a slight increase in tensile strength ( ult) of the adjusted
value, however either adjusted or not, the analysis showed that mechanical properties for location 1 were significantly different from those for location 2. The mean tensile modulus of elasticity (E) of location 1 was 16,779 N/mm2, while location 2 was 12,723 N/mm2. The adjusted mean values at locations 1 and 2, with relative density as the covariant, were 16,762 N/mm2 and
12,740 N/mm2 respectively. There was a slight reduction in the mean tensile modulus (E) when
adjusted for relative density.
There is currently no data available on the tensile strength and stiffness of bamboo in other studies, thus a direct comparison of bamboo used in this study cannot be carried out. Comparisons were made with the available data for bamboo species. The average maximum tensile stress strength ( ult) of air-dry (12%) giant timber bamboo (Phyllostachys bambusiodes) was 120.06 N/mm2 (17,413 psi). The tensile strength of bottom, middle and top locations was 110.83 N/mm2 (16,074 psi), 118.25 N/mm2 (17,151 psi) and 131.10 N/mm2 (19,014 psi), respectively. The study found that the tensile strength significantly increased with culm height. The tensile strength for locations 1 (bottom) and location 2 (middle) in this study also showed a significant increase, where the adjusted mean values were 156.00 N/mm2 (22,626 psi) for location 1 and 185.44 N/mm2 (26,896 psi) for location 2.
This was consistent with the increasing relative density from bottom to top for both studies. The presence of nodes in the middle of the necked-down area in this study and the study on giant timber bamboo made a significant difference in the tensile strength determined. They claimed that due to its lower tensile strength the nodes created a stress concentration on the narrow neck. The mean tensile strength for nodes and internodes in that study were 102.22 N/mm2 (14,826 psi) and 137.89 N/mm2 (20,000 psi) respectively. The adjusted mean tensile strength for nodes and internodes found in this study were 99.87 N/mm2 (14,485 psi) and 160.24 N/mm2 (23,241 psi) respectively.
Elasticity Test/Tensile Test
From the analysis of mean tensile modulus of elasticity (MOE) for location 1 was significantly
402 N/mm2 while for location 2 it was 136.71 N/mm2. The adjusted mean values at location 1 and 2, with relative density as the covariant, were 95.43 N/mm2 and 136.80 N/mm2 respectively. From
the analysis αpl for location 1 was significantly less than location 2. The comparison was made
only on the internodes and nodes of location 1. The mean ultimate tensile stress for internodes was 156.14 N/mm2, while the corresponding value for the nodes was 106.20 N/mm2. The adjusted mean values at internodes and nodes, with relative density as the covariant, were 160.24 N/mm2 and 99.87 N/mm2 respectively. The ultimate tensile stress of the internodes was significantly greater than the nodes.
The mean tensile modulus of the internodes was 16,779 N/mm2 while the value for nodes was 17,771 N/mm2. The adjusted mean values of the internodes and nodes with, relative density as the covariate, were 17,422 N/mm2 and 16,777 N/mm2, respectively. From the comparison analysis, there was no significant difference between the nodes and internodes. The mean tensile stress at the proportional limit for the internodes was 95.52 N/mm2, while the corresponding
value for nodes was 71.01 N/mm2. The adjusted mean values of the internodes and nodes, with
relative density as the covariant were 97.79 N/mm2 and 67.50 N/mm2. From the comparison
analysis, the αpl of the internodes was significantly greater than the corresponding value for
nodes.
From the general linear procedure and Tukey-Kramer test, the adjusted mean Modulus of Rupture (Sult ie. MOR) of both directions were not significantly different from each other when relative density was considered. The adjusted mean values for MOE and SPL were also not significantly different in the radial and tangential direction when tested under the same statistical procedures.
Fig 13: Test of Modulus of Rupture in a piece of Bamboo.
II. BENDING
Bending strength and stiffness
Bending strength and stiffness of bamboo has been studied by several researchers. Tewari, 1992 reported the mean MOR, SPL (Strength at Proportion Limit), and MOE in dry condition
(10.1%) of bamboo from Isiagwu, Okigwe as 153.39 N/mm2 (22,248 psi), 106.54 N/mm2
403 State in the dry condition (10.1%), with mean relative density of 0.57, were 83.16 N/mm2 (12,061 psi), 43.73 N/mm2 (6,342 psi) and 9,998 N/mm2 (1.16 x 10⁶ psi) respectively.
Bending strength and stiffness of locations 1 to 4 (Locations are stated in the table of results i.e. Table 1 to 8), in the radial and tangential directions, and the effects due to internodes and nodes
are discussed. The bamboo species was Mitenga (Bambusa longispiculata), which was tested in
the round form. The mean MOR, SPL andMOE in dry condition were 49.50 N/mm2 (7,180 psi),
33.56 N/mm2 (4,867 psi), and 10,066 N/mm2 (1.46 x 10⁶ psi) respectively. The relative density was reported to be 0.91, which was quite high considering that the bending strength and stiffness were low. Another example given in result Sattar, 1994. Small specimens were tested in the
green condition and the green relative density was 0.785. Mean αult, αpl, and E were 97.34
N/mm2 (14,118 psi), 47.94 N/mm2 (6,953 psi), 7,929 N/mm2 (1.15 x 10⁶ psi) respectively.
From the general linear procedure and Tukey-Kramer test, the adjusted mean MOR of both directions were not significantly different from each other when relative density was considered. The adjusted mean values for MOE and SPL were also not significantly different in the radial and tangential direction when tested under the same statistical procedures.
Mean MOE in the radial and tangential direction was 9,791.6 N/mm2 and 9,878.8 N/mm2, respectively. The adjusted values were 9,872.9 N/mm2 and 9,887.5 N/mm2, respectively. The mean SPL in the radial and tangential direction was 90.9 N/mm2 and 91.9 N/mm2. While the
adjusted values were 90.7 N/mm2 and 92.1 N/mm2. Table 6 shows the mean MOR of nodes and
internodes was 149.9 N/mm2 and 152.3 N/mm2, respectively.
The adjusted mean MOR was 148.9 N/mm2 and 153.2 N/mm2. The difference between the property values was slightly increased when relative density was taken as the covariate. However, the adjusted mean MOR of both sections were not significantly different from each other.
On the other hand, the adjusted mean values for MOE and SPL at the different sections were significantly different when tested under the same statistical procedures. The mean MOE in the
nodes and internodes sections were 9,691 N/mm2 and 10,428 N/mm2, respectively. The adjusted
values were 9,685 N/mm2 and 10,434 N/mm2, respectively. The mean SPL for the nodes and internodes sections were 101.0 N/mm2 and 91.2 N/mm2, respectively, while the adjusted values
were 101.04 N/mm2 and 91.2 N/mm2, respectively. From Table 7, the mean MOR of location 1
to 4 were 152.3 N/mm2, 149.3 N/mm2, 151.2 N/mm2 and 185.5 N/mm2, respectively. The adjusted mean MOR of the four locations are 156.1 N/mm2, 144.4 N/mm2, 157.1 N/mm2 and 180.3 N/mm2. The difference was slightly changed when relative density was taken as the covariate. From the general linear model procedure and Tukey- Kramer test, it was found that the adjusted mean MOR of location 1, 2 and 3 were not significantly different from each other. However, the value for location 4 was significantly different from the other locations. The adjusted MOE values for location 1, 2 and 3 are not significantly different from each other, but locations 1 and location 4 differ significantly.
On the other hand, locations 2, 3 and 4 show no significant difference. The mean MOE values for locations 1 to 4 were 10,428 N/mm2, 11,306 N/mm2, 11,426 N/mm2 and 12,358 N/mm2,
404 12,150 N/mm2, respectively. The SPL values followed a different pattern, where locations 1, 2 and 3 show no significant difference from each other, while locations 1 and 2 were significantly different from locations 4. Locations 3 and 4 were not significantly different from one another. The mean SPL values were 91.2 N/mm2, 99.5 N/mm2, 100.0 N/mm2 and 113.5 N/mm2 for locations 1 to 4 respectively, while the adjusted mean values were 92.9 N/mm2, 97.3 N/mm2, 102.6 N/mm2 and 111.28 N/mm2, respectively.
Several researchers studied mechanical properties of bamboo by determining the Bending strength and stiffness of bamboo. Tewari, 1992 reported the mean MOR, SPL and MOE in dry condition (10.1%) of bamboo from Isiagwu, Okigwe as 153.39 N/mm2 (22,248 psi), 106.54 N/mm2 (15,452 psi) and 20,063 N/mm2 (2.91 x 10⁶ psi) respectively. The mean relative density in their study was 0.85. Anon, 1972 reported that the mean MOR, SPL and MOE of bamboo from Abia State in the dry condition (10.1%), with mean relative density of 0.57, were 83.16 N/mm2 (12,061 psi), 43.73 N/mm2 (6,342 psi) and 9,998 N/mm2 (1.16 x 10⁶ psi) respectively.
The regression equation in Table 7 was used to adjust for the relative density of the Calcutta bamboo from Isiagwu and Uturu. Using the mean relative densities of bamboo from Isiagwu and Uturu, which were 0.85 and 0.57, respectively, the MOR, SPL and MOE for locations 1 to 4 is summarized in Table 8. The adjusted mean values were calculated using equations 1. Comparing the bending strength and stiffness to other bamboo species, bamboo seems to be in the middle range. Examples of lower and higher values were taken from. The test conducted was either in the full size (round form) or small specimen (cut form).
Comparing bamboo with timber species that are used in structural composites is also necessary. Table 1 presents equations for predicting selected properties of small clear specimens of timber in the green and dry condition (adjusted to 12%) for softwood and hardwood based on the relative density. Table 2 presents MOR and MOE of timber species that are used in composite products. Timber species mentioned are yellow-poplar, aspen, pine, Douglas-fir and hemlock. Mean MOR of yellow-poplar and quaking aspen in the dry condition (12%) are 70.00 N/mm2 and 58.00 N/mm2, respectively, while the mean MOE values are 10,900 N/mm2 and 8,100 N/mm2.
405 4.0 SUMMARY AND CONCLUSION
From a practical point of view, variability in a material is not a desirable behavior, such as a variation of tensile properties along the length of the culm, or the presence of nodes that reduce the strength. In order to solve this problem, nodes could be cut-off for the production of such products as oriented strand board and particleboard. However, it would not be economical to discard the nodes or even technically feasible in the production of parallel strand lumber. In order to use the whole culm in these products, the nodes and locations can to be distributed evenly throughout the composite system. Moreover, the better material can be placed on the surface layer, while the lesser could be put in the core. Thus, improving material recovery for the production.
In addition to the mechanical properties, the raw materials for composite products have to be selected based on their strength to weight ratio. Many timber species, which have a low strength to weight ratio, are not desirable because their density is too high. The selection of bamboo for composite products can be a set-back due to its higher density. However its strength and availability may out weight this disadvantage.
From the work, it is observed that tensile strength of bamboo is good and can be used as reinforcement in R.C.C structure for low cost housing project. Moisture content directly affects the strength of bamboo, bamboo shows ductile behavior as in steel. Hence it can be use as compression members in steel as well as R.C.C. structure. It was discovered that bamboo reinforcement technique is used for both main and distribution reinforcement as it was same earlier done for steel reinforcement.
5.0 RECOMMENDATION
The study of bamboo properties are necessary as the following recommendations were made:
(i) According to study by researchers in world, in next 60 years, steel production will be
reduced, hence a utilization of natural and eco-friendly options like bamboo should be used.
(ii) Tensile strength of bamboo is good and can be used as reinforcement in R.C.C structure for low cost housing project.
(iii) Compression strength of round bamboo ranges from 47.9 to 69.9 Mpa. As per review dendrocalamus strictus and Bambusa vulgaris schard have highest compression value and can be in confident for construction works.
(iv) Bamboo is weak at node section major failure in bamboo occurs at node and should be taking into consideration in its application.
(v) Bamboo reinforcement technique is used for both main and distribution
406 expected that the bond strength covering with full treatment shows the high value 1.2-1.35MPa.
(vi) Improving structural behavior the reinforced concrete beam can be strengthening
using bamboo sticks as a retrofitted material.
REFERENCES
1. Hearn, E.J. (1997), Mechanics of materials. An introduction to the mechanics of elastic and plastic deformation of solids and structural materials. (Third edition). University of Warwick, U.K. Butterworth, Heinemann.
2. Farrelly, D. (1984), the book of bamboo. Sierra Club Books, San Francisco, California.
3. Tewari, D.N. (1992) A monograph on bamboo. International Book Distribution, Dehra Dun (India).
4. Anon (1992), Proceeding IUFRO DIV.V/ITTO/FROM. International Workshop on Improved Utilization of Timber Resources in Southeast Asia. 7-11 Dec. 1992, Kuala Lumpur, Malaysia.
5. Kumar, S., and P.B. Dobriyal, (1992) Treatability and flow path studies in bamboo. Part 1. Dendrocalamus strictus nees. Wood and Fiber Science. 24(2):113-117.
6. Limaye, V.D. (1952), Strength of bamboo (Dendrocalamus strictus), Indian Forest Records. 1(1):1-17.
7. Anon. (1972), The use of bamboo and reeds in building construction. Department of Economic and Social Affairs. United Nations, New York.
8. Abd.Latif, M., A. Ashaari, K. Jamaludin, and J. Mohd. Zin (1993) Effects of anatomical
characteristics on the physical and mechanical properties of Bambusa
Bluemeana. Journal Tropical Forest Science 6(2): 159-170.
9. Lee, A.W.C., B. Xuesong, and N.P. Perry (1994). Selected physical and mechanical properties of giant timber bamboo grown in South Carolina. Forest Prod.J. 44(9): 40-46. 10. Sattar, M.A., M.F. Kabir, and D.K. Bhattacharjee (1991) Effect of age and height position of
muli (Melocanna baccifera) and borak (Bambusa balsooa) bamboo on their physical and mechanical properties. Proceedings: 4th International Bamboo Workshop. Bamboo in Asia and the Pacific. Chiangmai, Thailand.
11. Sattar, M.A., M.F. Kabir, and D.K. Bhattacharjee (1994) Physical and mechanical properties of Bambusa arundinacea, Bambusa longispiculata, Bambusa vulgaris and Dendrocalamus giganteus. Bangladesh Journal of Forest Science. 23(2):20-25. 12. Espiloy, Z.B., A.B. Ella, and A.R. Floresca. (1986) Physico-mechanical properties and
anatomical structure relationships of two erect bamboo species. The Philippines Lumberman 32(4):25-27
13. Shukla, N.K., R.S. Singh, and S.N. Sanyal (1988). Strength properties of elevan bamboospecies and study of some factors affecting strength. Journal of the Indian Academy of Wood Science. 19(2):63-80.
14. Abd.Latif, M., W.A. Wan Tarmeze, and A. Fauzidah (1990). Anatomical features and mechanical properties of three Malaysian bamboos. Journal Tropical Forest Science 2(3): 227-234.