Cancer Management and Research
Dove
press
O R i g i n A L R e s e A R C h
open access to scientific and medical research
Open Access Full Text Article
improving evaluation of the distribution
and density of immunostained cells in breast
cancer using computerized video image analysis
Brendon J Coventry1
Michael J Weightman1
John M skinner2
John Bradley3
1Discipline of surgery, University
of Adelaide; 2Department of
Pathology; 3Department of Clinical
immunology, Flinders University, Adelaide, sA, Australia
Correspondence: Brendon J Coventry Discipline of surgery, University of Adelaide, Royal Adelaide hospital, north Terrace, Adelaide, sA, 5000, Australia Tel +61 8 8222 4440
Fax +61 8 8222 5896
email [email protected]
Abstract: Quantitation of cell density in tissues has proven problematic over the years. The manual microscopic methodology, where an investigator visually samples multiple areas within slides of tissue sections, has long remained the basic ‘standard’ for many studies and for routine histopathologic reporting. Nevertheless, novel techniques that may provide a more standardized approach to quantitation of cells in tissue sections have been made possible by computerized video image analysis methods over recent years. The present study describes a novel, computer-assisted video image analysis method of quantitating immunostained cells within tissue sections, providing continuous graphical data. This technique enables the measurement of both distribution and density of cells within tissue sections. Specifically, the study considered immunoperoxidase-stained tumor infiltrating lymphocytes within breast tumor specimens, using the number of immunostained pixels within tissue sections to determine cellular density and number. Comparison was made between standard manual graded quantitation methods and video image analysis, using the same tissue sections. The study demonstrates that video image techniques and computer analysis can provide continuous data on cell density and number in immunostained tissue sections, which compares favorably with standard visual quantitation methods, and may offer an alternative.
Keywords: immunostaining, video image analysis, cellular quantitation, tissue sections, breast cancer, tumor infiltrating lymphocytes
Introduction
One important application of immunohistochemistry, with both research and diagnostic functions, is the quantitation of stained cells within tissue sections.1,2 For many
years, the easiest and most readily available method of cell quantitation has been one of visual manual microscopic evaluation, where the investigator observes and assesses the apparent density of immunostained cells to assign the most representative ‘category’, which usually involves a discontinuous ordinal scale such as 0, +/-, +,
++, +++, and ++++.2
However, a lack of repeatability (due to significant inter- and intra-observer variability) has proved to be a major limitation with such methodologies.1–5 Moreover,
visual quantitation is relatively time-intensive, has some degree of imprecision and requires a certain level of experience.6,7 The difficulties inherent with standard
quantal visual scale methods relate to the accurate placement of a particular density of immunostaining into a specific category, as this process is relatively subjective and requires a number of assumptions. Although there is relative uniformity between the grading assigned by different investigators at the extremes of staining
Cancer Management and Research downloaded from https://www.dovepress.com/ by 118.70.13.36 on 20-Aug-2020
For personal use only.
Number of times this article has been viewed
This article was published in the following Dove Press journal: Cancer Management and Research
Dovepress Coventry et al
(grades 0 and ++++), variation is often most pronounced regarding the distinctions between the intermediate intensities of staining, such as between assigning a grade of + and ++ or between ++ and +++ for observed cellular density.2–5
In reality, cell density is a continuous biological spectrum that ranges from zero, in which there are no immunostained cells, to maximal, in which there are densely packed con-tiguous immunostained cells. Therefore, the advent of novel computer-assisted video image analysis methods (VIA) is potentially significant, as it provides the ability to quantitate cells using a continuous scale from zero to maximal density, rather than a quantal or discontinuous grading scale as deter-mined by standard visual methods.
Currently, there is no standardized visual grading system in place for cell quantitation and, instead, a myriad of different quantal scales exist throughout the literature.3 Although most
grading systems are similar, different studies and results are unable to be directly compared, as the divisions between the quantal grades are not universally identical. This creates a source of interexperimental disparity within the literature. VIA may provide some solutions towards standardization.
Indeed, with the development of video image capture techniques and methods of measurement of image data, more reliable and standardized measurement is now available.1
Several authors have applied this technology to a number of tissues, both pathologic and normal, including synovial tissue,6 non-Hodgkin’s lymphoma,8 thyroid carcinoma,9
psoriasis,10 endocrine cells,11 breast carcinoma,12 and
colonic carcinoma.13 The current study, however, considered
immunoperoxidase-stained tumor infiltrating lymphocytes (TIL) within breast tumor specimens.
The study aimed to develop and describe a technique for quantitation of immunoperoxidase stained cells in tissue sections using the continuous grayscale of the video image analysis system to measure cell density along a gradient from zero to maximal density. Both density and distribution of stained cells were considered important parameters to assess. The method compared use of 1) standard visual manual quantitation (grading) and 2) video image analysis quantitation, performed on the same tissue sections for assessing cell density.
Methods
Tissues
Primary breast carcinoma tissue samples were taken directly following surgical resection and immediately embedded in optimal cutting temperature (OCT) medium (Miles Laboratories, Elkhart, IN), then snap-frozen in an isopentane
slurry in liquid nitrogen. Tissues were stored at -80°C for later use. A sample size of 21 specimens was chosen, based upon that of previous comparable studies.3,7
sectioning
Cryostat sections were cut at 4 µm, placed on gelatinized glass slides, air dried overnight, fixed in cold acetone, and washed in phosphate buffered saline (PBS) to remove the OCT medium.
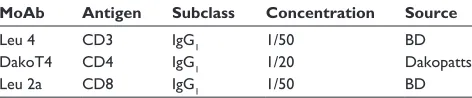
Monoclonal antibodies
Three primary murine anti-human monoclonal antibodies were used (Table 1). Each tissue was immunostained for different epitopes (CD3, CD4, and CD8) using specific monoclonal antibodies, so that comparisons could be made between the distributions of different cells within an individual tumor specimen through use of video image analysis.
All primary antibodies were incubated overnight in a humid chamber to allow adequate antibody binding and prevent drying. Before being used for tissue sections, antibodies were tested on human tonsil and lymph node sections to determine an optimal dilution, which was defined as the concentration that produced specific staining with minimal or no background staining. High contrast with background was particularly desirable for VIA measurements. Negative isotypic control antibodies and relevant positive control tissues were included.
immunostaining
Horse anti-mouse biotinylated second antibody was incubated for 30 minutes, followed by endogenous peroxidase blocking with a 1% solution of H2O2 in 70% ethanol, then the avidin-biotin immunoperoxidase complex was incubated for 45 minutes using reagents from a Vectastain kit (Vector Laboratories, Burlingame, CA). 3,3′-Diaminobenzidine (Sigma-Aldrich Co, St Louis, MO) was enhanced with nickel chloride (0.08%) to produce a blue-black reaction product. This step is aimed at achieving higher sensitivity.14,15 Three 5-minute PBS washes were used
between steps to ensure adequate removal of non-bound antibodies and reagents.
Table 1 Monoclonal antibodies used
MoAb Antigen Subclass Concentration Source
Leu 4 CD3 igg1 1/50 BD
DakoT4 CD4 igg1 1/20 Dakopatts
Leu 2a CD8 igg1 1/50 BD
Cancer Management and Research downloaded from https://www.dovepress.com/ by 118.70.13.36 on 20-Aug-2020
Dovepress image analysis of TiL in breast cancers
Direct microscopic visual quantitation
The 21 stained breast carcinoma tissue sections were assessed microscopically for the degree of cellular infiltrate and scored on a grading system of 0, +/-, +, ++, +++, or ++++ on the basis of average density of cells per unit area of section at ×250 magnification.2 In order to minimize interobserver
variability, a quantal grade was recorded for each tissue by three independent observers (BJC, JMS, JB), with the ‘ average’ value then being assigned for each case. The scoring scale used is shown in Figure 1.
Computer-assisted video image
analysis quantitation
The stained tissue sections were examined using a VIA device (MD-20, Flinders Imaging, Leading Edge Ltd, Adelaide, Australia), as detailed by Jarvis16,17 and Skinner et al.18 This
device comprises a microscope with a head-mounted video camera, digitizer, software, video screen, and computer. The microscopic image is captured and can be edited on the video screen and specifically designed software enables measure-ments of the pixel area.
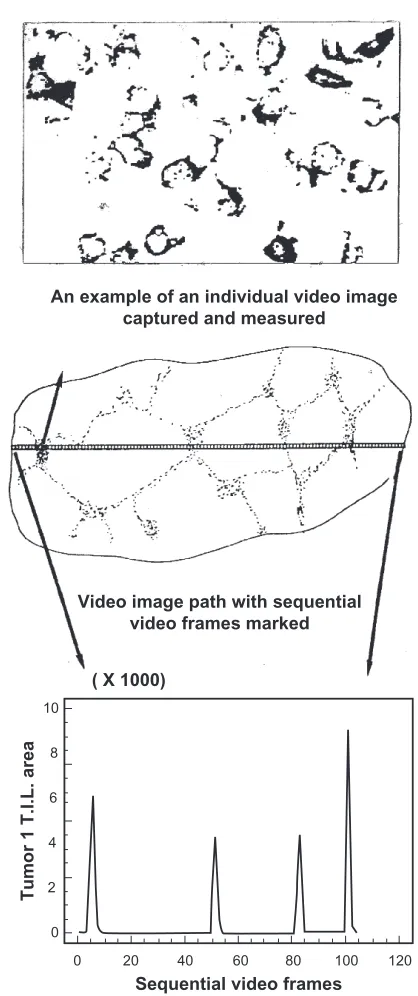
Thresholds were chosen such that all reaction product visible to the naked eye (and video camera) was included in each measurement and the background was excluded. A Leitz Laborlux microscope (Solms, Hesse, Germany) with CD20 video camera (Panasonic, Kadoma, Osaka, Japan) attached was used for all experiments, although a higher resolution camera would now be used. Individual immunostained tissue sections were placed on the microscope stage and the image was displayed in live video. Sections were scanned initially under the low power objective (×10) in order to select a suitably representative path that accurately repre-sents both the staining distribution and cellular density of immunostained cells in the section (Figure 2, middle). This path could be either horizontal or vertical, depending upon technical ease.
Having selected the most representative path using low power, the section was then examined under the high power objective (×40) magnification and, commencing at one edge of the section, the first image of the sequence was captured
on-screen (Figure 2, top). Magnification of ×400 was chosen because the on-screen image of the reaction product was high in contrast with the background, and images at this magnification required less editing than images at ×250 or less. The area of staining was recorded for each entire video field in terms of the number of pixels of staining of the total
0 ½ 1 2 3 4
Optical scoring scale
Figure 1 An example of the standard quantal visual scale method for grading immunostained cells, as used for this study.
An example of an individual video image captured and measured
Video image path with sequential video frames marked
( X 1000)
Sequential video frames
Tumor 1 T.I.L. area
10
8
6
4
2
0
0 20 40 60 80 100 120
Figure 2 Video image analysis (ViA) image of nickel-enhanced DAB immunostained CD3 (Leu4) cells (top) representing one video field at ×400 power; the video path comprising multiple sequential video fields (middle) from which measured data are stored; and the graphical record from the ViA data showing the distribution and density of immunostained cells (bottom). [Axes y = staining area in pixels × 1000; × = sequentially numbered video fields or frames from one side of the section to the other].
Cancer Management and Research downloaded from https://www.dovepress.com/ by 118.70.13.36 on 20-Aug-2020
Dovepress Coventry et al
pixels comprising the video screen image. For example, a single immunostained cell would measure around 200 pixels, whilst a densely cellular immunostained high power field may measure 30,000 pixels or more (numbering 150+ cells).
Once a measurement of the total area occupied by the reaction product in the video field was made, the video image was moved horizontally to the next sequential field utilizing distinctive features of the immunostained cells to decide where the next contiguous video field begins. In this way, no part of the video path was omitted or repeated. This procedure was repeated until the section was traversed from one side to the other. Therefore, a series of measurements across the section was recorded and each was plotted to form a graph of the density of immunostained cells across the tissue section (Figure 2). It was not necessary to calculate the number of cells as the reac-tion product area is constantly related to cellular density.19
The tumor sections examined ranged in breadth from 80 to 120 consecutive video fields. Therefore, because each section was not identical in breadth, the number of consecutive video fields required to traverse each section was corrected to make all calculations of area under the curves equivalent to a sec-tion with breadth of 120 video fields. Therefore, all total pixel values were multiplied by a correction factor of 120/a, in which ‘a’ is the actual number of consecutive video fields traversed in the section. Thus, all calculations on all curves were rendered directly comparable.
graphical data displays
Data sets for each consecutive video field were stored for each section on computer hard disk. Graphs were plotted from the data for each tissue section scanned using Statgraphics time-series analysis (v 4.0; Statpoint Technologies, Inc, Warrenton, VA). Plots for several sections stained with nickel enhanced DAB were generated. Visual graphical displays of the data are shown in Figure 2, bottom.
statistics
Data from the direct manual visual grading of each tissue section from the three observers was averaged to derive a single representative grading. Data from each identical corresponding cancer tissue section was measured using the described computerized video image analysis method and then compared with the corresponding visual grade assignment for that same tissue section. Computerized video image analysis pixel counts for the tissue sections that had been assigned each particular grade, using the direct visual grading system, were collated. Means, standard deviations, medians, and ranges were calculated.
Results
standard quantal microscopic
visual grading
Of the 21 breast tissues immunostained, it was assessed that antibody stained cells in 100% of cases, resulting in no grades of 0 being awarded. The frequency of the standard quantal grade awarded to each specimen is presented in Table 2. The distribution appears slightly positively skewed.
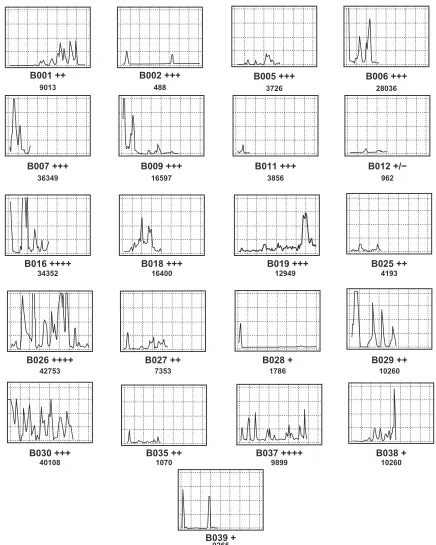
Video image analysis scanning
The results of the VIA scanning for the CD3-immunostained sections are presented in Figure 3, both graphically and numerically. The number depicted below each graph is the corrected area (in pixels) under the respective curve and thus represents a standardized comparative estimate of cellular density within each tissue section. Moreover, each is compared to the manually assigned standard quantal grades.
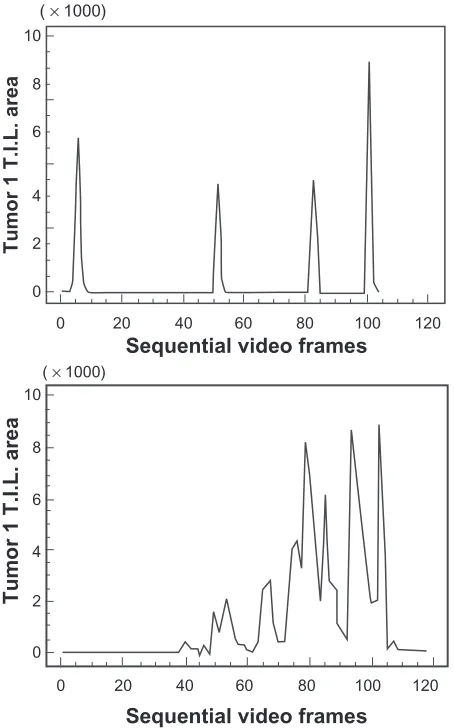
The data from Figure 3 are further summarized in Table 2, where the VIA results have been grouped according to the visual grade assigned. It can be seen that the ranges for each grade are large and there is considerable overlap between them, especially relating to the lower limit. Figure 3 and, more specifically, Figure 4 demonstrates how the VIA data allow for seemingly consistent visual estimates of a grade (eg, +++) to be discriminated further, as demonstrated by the wide range shown in pixel counts and the distribution of cells within a tissue section, respectively.
Cell dispersion and distribution
information
Additional qualitative data were obtained concerning the distribution of cells within the tissue sections examined, as demonstrated graphically in Figure 3. Peaks in the VIA scan graphs correspond to cell clustering with high density of immunostaining, whereas troughs with zero value correspond
Table 2 Descriptive statistics from data sets (median, mean, and range in pixels)
Video image quantitation Visual
grades Case frequency
Median Mean (±SD) Range
0 0 – – –
+/- 1 926 926 –
+ 3 9,265 7,103.7 (±4,632.0) 1,786–10,260 ++ 6 5,773 9,731.0 (±11,689.5) 1,070–32,901 +++ 8 16,498.5 19,331.6 (±14,404.6) 488–40,108 ++++ 3 34.352 29,001.3 (±17,068.1) 9,899–42,753
Cancer Management and Research downloaded from https://www.dovepress.com/ by 118.70.13.36 on 20-Aug-2020
Dovepress image analysis of TiL in breast cancers
B039 +
9265
B030 +++
40108 B035 ++1070 B037 ++++9899 B038 +10260
B016 ++++
34352 B018 +++16400 B019 +++12949 B025 ++4193
B012 +/−
962
B011 +++
3856
B009 +++
16597
B007 +++
36349
B001 ++
9013
B002 +++
488
B005 +++
3726
B006 +++
28036
B029 ++ B028 +
B027 ++ B026 ++++
10260 1786
7353 42753
Figure 3 examples of CD3 (Leu4) immunostaining in 21 separate breast tumors showing plots. [x and y axes are standardized and are the same as indicated in Figure 2].
to no immunostained cells. Graphical profiles can be used for comparison of both distribution and density of immunos-tained cells within different tumors. Moreover, these profiles serve as a visual representation of the area under the curve. Figure 4 shows differences in distribution of cells in two tumors of the same manual visual grade
Assessment of multiple cell types
Serial sections of the same tissue immunostained for different epitopes (CD3, CD4, CD8) using specific monoclonal anti-bodies demonstrate that comparisons can be drawn between the distribution of different cells within an individual tumor (Figure 5).
Cancer Management and Research downloaded from https://www.dovepress.com/ by 118.70.13.36 on 20-Aug-2020
Dovepress Coventry et al
Discussion
The study describes a technique of computer-assisted VIA, which might offer a standardized approach to cellular quan-titation of immunostained cells within tissue sections, on a continuous scaling system. The comparison of VIA with the standard visual grading methods demonstrated two major points of interest. Firstly, video image analysis appeared to discriminate between the densities of immunostained cells in different tumors. For example, tumors with similar graphi-cal profiles were given different grades and, conversely,
tumors with similar grades showed differences in their overall graphical profiles (Figures 3 and 4). Secondly, and importantly, information concerning the distribution of cells in each tumor section was only achieved using VIA. This is because visual grading represents only an averaged estimate of cell density. Much of the available data recorded from any individual tumor are lost when the grading technique is used to derive a single quantal grade. For example, by the standard quantal method, a grade of +++ is assumed to be uniform across a tissue section, but in almost all cases this was not strictly correct, with the cellular density varying sometimes considerably in different parts of the same tissue section. This may potentially lead to ‘dilution’ of the available data. High intra-observer variability and difficulties with reproducibility are well recognized as serious limitations of standard manual quantal visual cell density grading methods,2–4 and other
methods have been diligently sought in an attempt to reduce or eliminate these types of errors and problems.
As noted, a major potential advantage of the VIA measurement technique is that it permits direct comparison of both cell densities and distribution between tumors (and within a tumor section). VIA techniques have the ability to generate a graphical representation of the density of immunostaining within a tissue section. Comparison of cellular density is then relatively easy to discern graphically between different tissues stained with the same monoclonal antibody (Figure 3), or between serial sections of the same tissue using different antibodies (Figure 5).
It was noted that VIA methods could discriminate between infiltrates designated as identical using direct visual methods (Figure 4), both in terms of offering a continuous scale and providing qualitative information regarding the cell distribution. This is largely because the direct manual visual scale method utilizes a process of summation and then averaging (mental or arithmetic) to derive the ‘grade’ for quantitation of the immunostained cells, whereas, the VIA graphical method measures the overall cellular density (area under the curve), while the shape of the graphical profile defines the distribution of cells or clusters (on a continuous scale). Therefore, VIA is a system of measurement, rather than merely a tool for comparison. Although not the method chosen in this study, it is possible to calculate the mean or median from the sum of measurements of video fields constituting the consecutive video pathway, to derive an estimate of the average VIA staining (cell) density in a tissue section. This provides a cellular density comparable to the manual graded visual scale method estimate, but on a continuous scale rather than a quantal scale.
10
8
6
4
2
0 ( × 1000)
0 20 40 60 80 100 120
Sequential video frames
Tumor 1 T.I.L. area
10
8
6
4
2
0 ( × 1000)
0 20 40 60 80 100 120
Sequential video frames
Tumor 1 T.I.L. area
Figure 4 Two separate breast cancer tissue sections (tumor 1 and 2) immunostained using CD3 antibody, both graded as +++ by manual visual methods, but revealing different distributions of cells across the respective tissue sections (×400).
B028
Figure 5 serial sections of the same tissue (B028) immunostained for different epitopes (CD3, CD4, CD8; L to R) using specific monoclonal antibodies demonstrate that comparisons can be drawn between the distribution of different cell types within an individual tissue.
Cancer Management and Research downloaded from https://www.dovepress.com/ by 118.70.13.36 on 20-Aug-2020
Dovepress image analysis of TiL in breast cancers
Relationships between the dispersion of different types of cells within a tissue section can be assessed using double (or triple) immunostaining techniques, but with more simplicity and perhaps greater accuracy of measurement than using serial sections (Figure 5). Distributions of one cell type within different tumors, or comparing different cell types within serial sections of the same tumor can be performed readily by superimposition of the curves, provided identical axes are used. It should be emphasized that preparation of tissues for immunostaining, using suitable color filters and obtaining high resolution of positive immunostaining signal from background is essential to provide adequate contrast for image analysis, as in any other situation where image analysis is used. Automation of microscope stage movements and mathematically precise selection of video paths are modifications that will eventually expedite measurement performance and accuracy still further.
The quantitation of cell density using the VIA methods described here relies on the valid approximation that measurement of the total reaction product viewed in a video field (in pixels) is virtually identical to measurement of the summated reaction product (in pixels) around the isolated, individual cells within that same field.19
Therefore, VIA measurement of individual immunostained cells and measurement of clustered cells with confluent immunostaining reaction product show such very close correlation that simply measuring the on-screen reaction product is a sufficient, easy, and accurate index of cellular density in most situations. Exceptions are classically those where high background, poor intensity, or non-contrasting staining occurs; however, these types of limitations also present similar problems with the visual scale, or any other current methods of quantitation.
Although video image analysis clearly offers less overt variability than visual scale methods, some potential variability still persists where value judgments are required to 1) set thresholds or 2) select video pathways for measurement. Although selection of the path for video scanning is a potential source of error with the above VIA methods, the selection of a grade for immunostained cellular density utilizes broader assumptions and is in fact more liable to selection error. Overall, selection bias and error are perhaps inherent to a greater degree in the standard quantal visual scale method estimates, than computerized VIA methods, for the reasons given above.
The video image analysis methods described lend themselves to further analysis in other tissues and situations and are likely to be of use to many investigators quantitating
cellular staining in tissue sections or well-defined cellular smears. There is a need for a reliable and reproducible technique for cell quantitation that can achieve international standardization for research and comparison. Ideally, further investigation of this method would constitute a larger study that investigates the inter- and intra-observer differences associated with video image analysis, in order to verify repeatability.
The study of TILs within breast cancer, for example, requires an accurate and reproducible method of quantifying immunostained cells, in order to assess the relative density of cellular infiltration.20,21 The potential improvement
in detection and measurement sensitivity offered by VIA methods over standard grading techniques needs to be explored in more depth to provide a highly useful research tool for elucidating subtle micro-environmental characteristics of clinical importance. As VIA methods offer data representation on a continuous rather than a quantal scale, the data interpretation is potentially more biologically realistic. Such methods may also possibly reduce the risk of failing to detect important subtle differences in the density and distribution of cells within cancer tissues, which may potentially be associated with better determination of clinical outcome.22 This aspect is currently being investigated using
the video image analysis method described.
Acknowledgments
The authors would like to thank Peter Graff, Paul Stoll, and Lynn Jarvis for their encouragement and assistance in the work. Financial support for this study was provided by the National Health and Research Council of Australia and the Royal Australasian College of Surgeons.
Disclosure
No conflicts of interest were declared in relation to this paper.
References
1. Bernardo V, Lourenço SQC, Cruz R, et al. Reproducibility of immunostaining quantification and description of a new digital image pro-cessing procedure for quantitative evaluation of immunohistochemistry in pathology. Microsc Microanal. 2009;15(4):353–365.
2. Walker RA. Quantification of immunohistochemistry – issues concerning methods, utility and semiquantitative assessment I. Histopathology. 2006;49(4):406–410.
3. Taylor CR, Levenson LM. Quantification of immunohistochemistry – issues concerning methods, utility and semiquantitative assessment II.
Histopathology. 2006;49(4):411–424.
4. Seidal T, Balaton AJ, Battifora H. Interpretation and quantification of immunostains. Am J Surg Pathol. 2001;25(9):1204–1207.
5. Heyderman E, Warren PJ, Haines AM. Immunocytochemistry today – problems and practice. Histopathology. 1989;15(6):653–658.
Cancer Management and Research downloaded from https://www.dovepress.com/ by 118.70.13.36 on 20-Aug-2020
Cancer Management and Research
Publish your work in this journal
Submit your manuscript here: http://www.dovepress.com/cancer-management-and-research-journal
Cancer Management and Research is an international, peer-reviewed open access journal focusing on cancer research and the optimal use of preventative and integrated treatment interventions to achieve improved outcomes, enhanced survival and quality of life for the cancer patient. The journal welcomes original research, clinical & epidemiological
studies, reviews & evaluations, guidelines, expert opinion & commen-tary, case reports & extended reports. The manuscript management system is completely online and includes a very quick and fair peer-review system, which is all easy to use. Visit http://www.dovepress.com/ testimonials.php to read real quotes from published authors.
Dovepress
Dove
press
Coventry et al
6. Kraan MC, Haringman JJ, Ahern MJ, Breedveld FC, Smith MD, Tak PP. Quantification of the cell infiltrate in synovial tissue by digital image analysis. Rheumatology. 2000;39(1):43–49.
7. Benali A, Leefken I, Eysel UT, Weiler E. A computerized image analysis system for quantitative analysis of cells in histological brain sections.
J Neurosci Methods. 2003;125(1–2):33–43.
8. Hendricks JB, Rainer R, Munakata S. Computer-assisted and visual methods of assessing cellular proliferation in tissue sections from non-Hodgkin’s lymphoma. Anal Quant Cytol Histol. 1995;17(6): 383–388.
9. Gupta N, Sarkar C, Singh R, Karak AK. Evaluation of diagnostic efficiency of computerized image analysis based quantitative nuclear parameters in papillary and follicular thyroid tumors using paraffin-embedded tissue sections. Pathol Oncol Res. 2001;7(1):46–55. 10. Goedkoop AY, de Rie MA, Teunissen MBM, et al. Digital image
analysis for the evaluation of the inflammatory infiltrate in psoriasis.
Arch Dermatol Res. 2005;297(2):51–59.
11. El-Salhy M, Sandstrom O, Nasstrom E, Mustajbasic M, Zachrisson S. Application of computer image analysis in endocrine cell quantification.
Histochem J. 1997;29(3):249–256.
12. Kohlberger PD, Obermair A, Sliutz G, et al. Quantitative immuno-histochemistry of factor VIII-related antigen in breast carcinoma: a comparison of computer-assisted image analysis with established counting methods. Am J Clin Pathol. 1996;105(6):705–710. 13. Norazmi MN, Hohmann AW, Jarvis LR, Skinner JM, Stoll P, Bradley J.
The use of computer-assisted video image analysis in the enumeration of immuno-stained cells in tissue sections. J Immunol Methods. 1990; 131(2):223–227.
14. Coventry BJ, Neoh SH, Mantzioris BX, Skinner JM, Zola H, Bradley J. A comparison of the sensitivity of immunoperoxidase staining methods with high-sensitivity fluorescence flow cytometry-antibody quantitation on the cell surface. J Histochem Cytochem. 1994;42(8):1143–1149. 15. Coventry BJ, Bradley J, Skinner JM. Differences between standard
and high-sensitivity immunoperoxidase staining methods in tissue sections – comparison of immunoperoxidase staining methods using computerised video image analysis. Pathology. 1995;27(3):221–223. 16. Jarvis LR. Microcomputer video image analysis. J Microsc. 1988;
150(2):83–97.
17. Jarvis LR. The microcomputer and image analysis in diagnostic pathology. Microsc Res Tech. 1992;21(4):292–299.
18. Skinner JM, Zhao Y, Coventry BJ, Bradley J. Video image analysis in pathology. Dis Markers. 1993;11(2–3):53–70.
19. Norazmi MN, Hohmann AW, Skinner JM, Bradley J. Density and phenotype of tumour-associated mononuclear cells in colonic carcinoma determined by computer-assisted video image analysis. Immunology. 1990;69(2):282–286.
20. Loughlin PM, Cooke TG, George WD, Gray AJ, Stott DI, Going JJ. Quantifying tumour-infiltrating lymphocyte subsets: a practical immuno-histochemical method. J Immunol Methods. 2007;321(1–2):32–40. 21. DeNardo DG, Coussens LM. Inflammation and breast cancer. Balancing
immune response: crosstalk between adaptive and innate immune cells during breast cancer progression. Breast Cancer Res. 2007;9(4): 212–221.
22. Pagès F, Galon J, Dieu-Nosjean MC, Tartour E, Sautès-Fridman C, Fridman WH. Immune infiltration in human tumors: a prognostic factor that should not be ignored. Oncogene. 2010;29(8):1093–1102.
Cancer Management and Research downloaded from https://www.dovepress.com/ by 118.70.13.36 on 20-Aug-2020