Overview of the ECE measurements on EAST
YongLiu1,∗,HailinZhao1,TianfuZhou1,XiangLiu1,ZeyingZhu1,XiangHan1,StefanSchmuck2,JohnFessey2,Paul Trimble2,C.W.Domier3,N.C.Luhmann, Jr.3,AngTi1,ErzhongLi1,BiliLing1,LiqunHu1,XiFeng4,Ahdi Liu4,W.L. Rowan5,HeHuang5,P.E.Phillips5, andLorenzoFigini6
1Institute of Plasma Physics, Chinese Academy of Sciences, Hefei 230031, China 2CCFE, Culham Science Centre, Abingdon, Oxon, OX14 3DB, UK
3Department of Applied Science, University of California at Davis, Davis, California 95616, USA 4University of Science and Technology of China, Hefei 230026, China
5Institute for Fusion Studies, University of Texas at Austin, TX 78712, USA 6CNR, Istituto di Fisica del Plasma, Milano 20125, Italy
Abstract.Radiometer systems and a Michelson interferometer, have been operated routinely to detect the
elec-tron cycloelec-tron emission (ECE) from EAST plasmas for diagnosing the local elecelec-tron temperature. A common quasi-optical antenna placed inside the vacuum vessel is employed to collect and focus the plasma emission, and the line of sight is along a radial chord. All of the systems are located in a diagnostic room where the plasma emission is transmitted by overmoded corrugated waveguide. In-situ absolute intensity calibration has been carried out for both the radiometer systems and the Michelson interferometer independently, to ensure that the ECE diagnostic provides an independent electron temperature measurement. In order to diagnose the small-amplitude electron temperature fluctuation, a correlation ECE (CECE) diagnostic has been designed and commissioned recently. The CECE diagnostic employs an independent antenna system which has improved poloidal resolution. A synthetic diagnostic is realized by using the simulation code SPECE to interpret the ECE data in plasmas with non-Maxwellian distribution, and preliminary results imply that the ECE data could be still useful as a localized measurement in plasmas with non-thermal electrons, such as the LHW-heated plasmas on EAST.
1 Introduction
Electron cyclotron emission (ECE) measurements have been widely employed in tokamak plasmas since the 1970s as a powerful diagnostic [1, 2]. Generally, ECE provides the temporal evolution of the local electron temperature with good spatial and temporal resolutions. In addition, in-formation about the electron density, the electron velocity distribution, and the wall reflectivity can also be inferred from the entire ECE spectrum [3, 4].
On the experimental advanced superconducting toka-mak (EAST), the ECE diagnostic has been operated since the first plasma of EAST and was improved continuously since then. There are a few radiometer systems [5, 6] and a Michelson interferometer [7] for conventional ECE mea-surement to diagnose the electron temperature profiles and electron temperature fluctuation driven by macroscopic instabilities. A correlation ECE (CECE) diagnostic has been developed to detect the turbulence associated small-amplitude electron temperature fluctuation. Synthetic di-agnostic is studied by using the forward modeling code SPECE, and this facilitates the explanation of ECE data in plasmas with non-Maxwellian distribution. The con-ventional ECE diagnostics on EAST will be described in Section 2, and Section 3 introduces the CECE diagnostic.
∗e-mail: liuyong@ipp.ac.cn
Results of synthetic diagnostic are given in Section 4. Sec-tion 5 is the summary.
2 Conventional ECE diagnostic
2.1 Antenna and transmission line
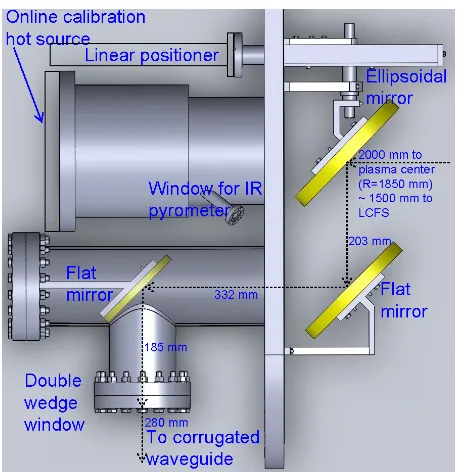
Since 2014, a quasi-optical (QO) antenna has been adopted for collecting and focusing EAST plasma emis-sion along a horizontal line of sight. As shown in Figure 1, the antenna comprises 3 reflectors: an ellipsoidal mirror and two flat mirrors. The ellipsoidal mirror can be rotated facing either the plasma or a hot-load calibration source. The ellipsoidal mirror is located 2000 mm away from the plasma center, and the distance to the waveguide is 1000 mm. The ellipsoidal mirror has an effective focal length of 900 mm, and forms a beam size of roughly 40 mm for a toroidal magnetic field of 2.3 T.
Figure 1. Quasi-optical antenna for the ECE diagnostic on EAST.
in 2015. Figure 2 shows the simulation results of the trans-mission for the single flat window and the double wedge window. The parameters of the double wedge window are: the wedge angleΨis 12.5 degree, the thickness of the thin sided1is 10 mm, and the distance between both windows dwis 1 mm. The material for both the flat window and the double wedge window is high density polyethylene with dielectric constantrof 2.3.
Figure 2. Comparison of the transmission for a single flat win-dow and a double wedge winwin-dow.
A wire grid polarizer is placed between the window and the waveguide to select the extraordinary mode (X-mode) polarization. Low-loss corrugated waveguides with 63.5 mm-id is used. The transmission line (TL) comprises roughly 45 meters of waveguides, and 8 miter bends. Be-cause some bends are not oriented with identical or orthog-onal planes of incidence, the linear polarization is rotated by roughly 63.15 degrees after transmission through the 8 miter bends.
In the diagnostic room, a notch filter is used to prevent the measurement systems from being damaged by elec-tron cycloelec-tron heating (ECH) stray radiation and then the plasma emission is divided into 3 paths by using two wire grid polarizers (see Figure 3). The power ratio for the three paths is 5:4:1. The first two paths are for the radiometer systems, and the remaining one is for the Michelson inter-ferometer.
Figure 3. The layout of the transmission line (TL) in the diag-nostic room.
2.2 ECE measurement systems
2.2.1 Radiometer systems
A 16-channel radiometer system which has a frequency coverage of 98.5-126 GHz has been operated since the first plasma of EAST in 2006 [5]. In 2012, a 32-channel ra-diometer system was designed and commissioned to mea-sure the plasma emission in the frequency range of 104-168 GHz [6], and it uses the #1 output of the TL. This 32-channel radiometer has been upgraded in 2015, and the frequency interval for the lower frequency range upto 120 GHz is reduced to 1 GHz from 2 GHz by introducing 8 channels in the intermediate frequency (IF) part. In or-der to extend the frequency coverage, an independent 8-channel radiometer system covering a frequency range of 97-104 GHz (local oscillator of frequency 90 GHz) was built in 2015, and it uses the #2 output of the TL. With the combination of these radiometer systems, they have a frequency coverage capable of measuring the second har-monic ECE for plasmas with toroidalBthigher than 1.75 T.
The RF bandwidth fRF of the radiometer systems varies from roughly 250 MHz to 500 MHz, and the video bandwidth fV of the systems is upto 400 kHz. This results
in a sensitivity of 4-5.7 % (≈ q
2fV
fRF). This is adequate for
most applications of ECE measurements such as diagnos-ing the electron temperature profile and the electron tem-perature fluctuation driven by MHD instabilities. How-ever, it is not adequate to detect the small-amplitude, high-frequency fluctuations (with typical amplitudes around 1%) driven by micro-instabilities.
0 0.2 0.4 0.6
0 1 2 output (V) linearity test ch1 ch2 ch3 ch4 ch5 ch6 ch7 ch8
4 8 12 16
0 1 2
output (V)
frequency response
8 10 12 14
freq (GHz) 0
1 2
output (V)
0 0.1 0.2
input (mW) 0 1 2 output (V) ch9 ch10 ch11 ch12 ch13 ch14 ch15 ch16 (b) (a) (c) (d)
Figure 4. Tests of IF linearity ((a) and (c)) and frequency re-sponse ((b) and (d)) for the new 16 channels. The IF central frequency of the top is from 4 to 18 GHz, with 2 GHz separation, while the bottom is from 7 to 14 GHz, with 1 GHz separation.
2.2.2 Michelson interferometer
One of JET’s Michelson interferometers was loaned to EAST in 2012, and it has been operated routinely sine the year 2014 [7]. This Michelson interferometer is one of the original systems developed by SPECAC in the 1980s for the ECE measurements in magnetically confined plasmas. This system had not been in operation since the late 1990s, and it has been refurbished when the loan agreement was signed in late 2011.
The system has a spectral resoluton of 2.7 GHz, and a temporal resolution of roughly 33 ms. The instrument is able to measure the ECE spectra from 80 GHz to 350 GHz, and this is mainly limited by the transmission line and the in-situ calibration. This frequency range typically covers the first to fourth ECE harmonic ranges for EAST magnetic field configuration.
2.2.3 In-situ intensity calibration
In-situ absolute intensity calibration has been carried out independently for the radiometer systems and the Michel-son interferometer since 2014 [8]. Two types of hot sources have been developed for the calibration on EAST. One of them (#1) is a copy of the JET hot source [9], and the other one (#2) is the ITER prototype developed by the Institute for Fusion Studies [10]. Source #1 oper-ates at atmosphere, while source #2 needs to be operated in vacuum. Normally, an in-situ calibration was carried
out before an experimental campaign starts by using the hot source #1.
A digital coherent averaging technique and lock-in am-plifier are separately used to measure the weak signal (a few tens µV), and both of the methods require the input signal to be modulated by an optical chopper. The lock-in amplifier gives RMS (root mean square) value of the modulated signal, while the coherent averaging technique results in the peak-to-peak value. The coherent averag-ing technique is more efficient because one can analyze all channels simultaneously.
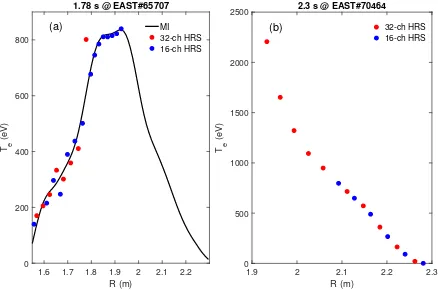
Following the in-situ intensity calibration, the ECE di-agnostic on EAST provides independent measurements of the electron temperature profiles and electron temperature fluctuation. Figure 5 shows the measurement of a few elec-tron temperature profiles. The left figure of Figure 5 is for a discharge at a toroidal magnetic field of 1.8 T. The black line is the electron temperature measured by a Michelson interferometer [7], which can give the profile of the whole plasma region with a temporal resolution of roughly 33 ms, the red closed dots are the electron temperature mea-sured by the existing 32-channel heterodyne radiometer, and the blue closed dots are the electron temperature mea-sured by the newly upgraded 16-channel heterodyne ra-diometer. We can see that at such low magnetic field, the upgraded heterodyne radiometer can give the high field side electron temperature profile. The right figure of Fig-ure 5 is the electron temperatFig-ure profile for a discharge at a toroidal magnetic field of 2.47 T, and the result demon-strates that the radial separation is decreased with the new 48-channel heterodyne radiometer, from∼4 cm to∼2 cm.
1.6 1.7 1.8 1.9 2 2.1 2.2
R (m) 0 200 400 600 800 Te (eV)
1.78 s @ EAST#65707
MI 32-ch HRS 16-ch HRS
1.9 2 2.1 2.2 2.3
R (m) 0 500 1000 1500 2000 2500 Te (eV)
2.3 s @ EAST#70464 32-ch HRS 16-ch HRS
(a) (b)
Figure 5.The electron temperature profiles at toroidal magnetic field of 1.80 T (left) and 2.47 T (right).
3 Correlation ECE diagnostic
wavenumber of the detected fluctuation. As illustrated in Figure 6, the QO antenna comprises a flat mirror and an ellipsoidal mirror. The ellipsoidal mirror is located 800 mm away from the plasma center, and the distance to the waveguide is 616 mm. The ellipsoidal mirror has an eff ec-tive focal length of 390.6 mm. This antenna is integrated for both the CECE diagnostic and an existing Doppler backscatter diagnostic, and the flat mirror is rotatable in the poloidal direction. In contrast to the conventional ECE diagnostic, the heterodyne radiometer part of the CECE di-agnostic is placed a few meters away from the didi-agnostic port.
Figure 6.QO antenna of the CECE diagnostic.
The heterodyne detection part (see Figure 7) is similar to a conventional radiometer system, and a unique aspect is the application of YIG filters. The YIG filters (OM-NIYIG INC) are of tunable central frequency in the fre-quency range of 4-18 GHz, and a 3 dB bandwidth of 100-250 MHz (central frequency dependent). This feature is very important for facilitating the radial correlation. The
sensitivity of this CECE diagnostic (q√1 N
2fV
fRF, whereNis
the number of data points for correlation) can reach around 0.2-0.3% for a correlation analysis using 106data points.
Figure 7.The heterodyne detection part of the CECE diagnostic.
This system has been commissioned in the EAST ex-perimental campaign carried out in 2017. Preliminary re-sults indicate that the broadband electron temperature fluc-tuations are detected in some cases. More tests will be conducted to confirm the observations in future.
4 Synthetic diagnostic
In order to interpret the ECE data in plasmas with non-Maxwellian distribution, the ECE ray-tracing code SPECE [11], developed as a support tool for the oblique ECE diag-nostic at JET, is adopted for simulating the ECE spectrum
in terms of radiative temperature on EAST. The input data for SPECE is described as follows: (i) the magnetic equi-librium is from EFIT, (ii) the electron temperature profile and the electron density profile are respectively provided by the Thomson scattering diagnostic and the reflectom-etry system, (iii) the LOS is described based on the real ECE diagnostic configuration. With the input data, the code solves the radiation transport equation along the ray trajectories in a tokamak plasma. Ray trajectories are com-puted making use of the cold dispersion relation, while the absorption and emission coefficients are obtained solving the relevant fully relativistic dispersion relation valid at high electron temperature. The actual antenna pattern is simulated by means of a multi-rays calculation, and the spatial resolution of the ECE measurements is computed by means of an algorithm that takes properly into account the emission along each ray of the beam.
Figure 8. Example illustrating the spatial localization of 110 GHz ECE for plasmas (B0 = 1.8 T @ 1.85 m) separately with Maxwellian and non-Maxwellian distribution functions: (a) absorption coefficient α(s), (b) optical depth τ(s), (c)G(s) =
ω2
8π3c2Trad(s)α(s)e−τ(s), (d)
R
G(s)ds. Here,sis along the major radius.
(as shown in the small panel at the right side of the Fig-ure 8 (b)), and consequently the absorption of the thermal emission layer is negligible when the emission propagates through the non-thermal resonance layer. Even though the non-thermal emission layer is much broader than the ther-mal emission layer, the intensity is much weaker.
In order to study the influence of the non-thermal elec-trons on the spatial localization of ECE measurement, a parameterR =R Gthermal(s)ds/
R
G(s)dsis defined to de-scribe the contribution of the thermal emission layer (local electron temperature) to the received intensity by an actual ECE diagnostic located in LFS, where the numerator is the integral for the thermal emission layer. The other param-eter is the localization of the non-thermal emission layer, and it is described by the position of the peak value and the FWHM of the non-thermal emission layer.
To qualitatively study the contribution of the thermal emission layer to the total intensity and the localization of the non-thermal emission layer, some of the parame-ters describing the non-thermal electrons are scanned. The simulation results are summarized in Figures 9 and 10. The input data such as the electron temperature profile, the electron density profile, and the magnetic equilibrium for the simulations are from measurements. The main pa-rameters are: central electron densityne0=3.5×10¹⁹m−3, central electron temperatureTe0 =1100 eV, central mag-netic field strength B0 = 1.8 T, the major radius R0 ≈ 1.85 m, the minor radiusa≈0.45 m.
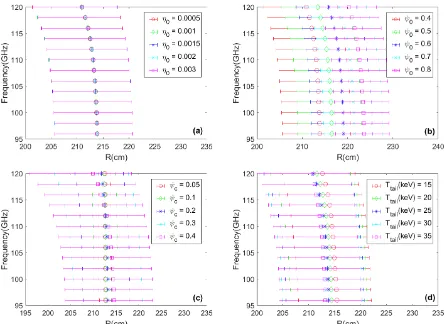
As illustrated in Figure 8 (c), for the frequency range with associated high optical depth and the non-thermal res-onance layer at the HFS is behind the thermal resres-onance layer, the emission is absorbed completely and will not be detected at the LFS. This corresponds to radial range with major radius of roughly 1.6-2.1 m in Figures 9 and 10. Because the non-thermal emission layer is attributed to the third harmonic emission, it is obvious that the in-fluence is stronger at the HFS and the inin-fluenced raidal range goes to LFS deeper as the energy of the non-thermal electrons increase (Figures 9 (d)). For a set of reasonable parameters (η0 = 0.001−0.002, ψ0 = 0.4, ∆ψ = 0.3, Ttail =25−30 keV, these parameters give a good agree-ment between the simulated and the experiagree-mental spectra [12]), the intensity attributed to the thermal emission layer is larger than 70% for the radial range 1.7-2.1 m. For the radial range with major radius larger than 2.1 m, the opti-cal depth becomes smaller. Hence, the emission from the non-thermal resonance layer at the HFS is not absorbed completely and contributes to the observed intensity. This explains why there is a drop for most cases in Figure 9. As the location of the non-thermal electrons (ψ0) changes from plasma core to plasma edge, the number of resonant electrons becomes smaller and the contribution of the non-thermal electrons is smaller (see Figure 9 (b)).
As Figure 10 shows, the localization of the non-thermal emission layer (position and width) is strongly dependent of the radial position and radial distribution of the non-thermal electrons, and the dependence on the frac-tional density and tail energy is weak.
Figure 9. The ratio between intensity attributed to the thermal emission layer and the total intensity for scan of (a) the fractional density (ψ0 = 0.4, ∆ψ = 0.3, Ttail = 25 keV, uk,max = 0.4),
(b) the radial position (η0 =0.001,∆ψ =0.3,Ttail =25 keV,
uk,max =0.4), (c) the radial distribution (η0 =0.001,ψ0 =0.4,
Ttail=25 keV,uk,max=0.4), and (d) the tail energy (η0 =0.001, ψ0=0.4,∆ψ=0.3,uk,max=0.4).
Figure 10. The localization (position defined at the peak value, width defined as the FWHM) of the non-thermal emission layer for scan of (a) the fractional density (ψ0 =0.4,∆ψ=0.3,Ttail=
25 keV,uk,max =0.4), (b) the radial position (η0 =0.001,∆ψ= 0.3,Ttail=25 keV,uk,max=0.4), (c) the radial distribution (η0= 0.001,ψ0 =0.4,Ttail =25 keV,uk,max =0.4), and (d) the tail
energy (η0=0.001,ψ0=0.4,∆ψ=0.3,uk,max=0.4).
5 Summary
fairly good spatial and temporal resolutions. Synthetic di-agnostic using forward modeling is used to interpret the ECE data in plasmas with non-Maxwellian distribution, and preliminary results imply that the ECE data could be still useful as a localized measurement in plasmas with non-thermal electrons, such as the LHW-heated plasmas on EAST.
Acknowledgements
This work was supported by the National Natural Science Foundation of China under Grant No. 11405211, and the Innovative Program of Development Foundation of Hefei Center for Physical Science and Technology. This work was also partly supported by National Magnetic Confine-ment Fusion Science Program of China under Contract Nos. 2015GB101003 and 2015GB103002.
References
[1] A.E. Costley, TFR Group, Phy. Rev. Lett.38, 1477 (1977)
[2] I.H. Hutchinson, D.D. Komm, Nuclear Fusion 17, 1077 (1977)
[3] L. Figini, S. Garavaglia, E. De La Luna, D. Farina, P. Platania, A. Simonetto, C. Sozzi, JET-EFDA Con-tributors, Rev. Sci. Instrum.81, 10D937 (2010)
[4] S. Schmuck, J. Fessey, J.E. Boom, L. Meneses, P. Abreu, E. Belonohy, I. Lupelli, Rev. Sci. Instrum. 87, 093506 (2016)
[5] A. Ti, B.L. Ling, Q.S. Fei, X. Gao, Int. J. Infrared Milli. Waves28, 243 (2007)
[6] X. Han, X. Liu, Y. Liu, C.W. Domier, N.C. Luhmann, Jr., E.Z. Li, L.Q. Hu, X. Gao, Rev. Sci. Instrum.85, 073506 (2014)
[7] Y. Liu, S. Schmuck, H.L. Zhao, J. Fessey, P. Trimble, X. Liu, Z.Y. Zhu, Q. Zang, L.Q. Hu, Plasma Science and Technology18, 1148 (2016)
[8] X. Liu, H.L. Zhao, Y. Liu, E.Z. Li, X. Han, C.W. Domier, N.C. Luhmann, Jr., A. Ti, L.Q. Hu, X.D. Zhang, Rev. Sci. Instrum.85, 093508 (2014) [9] S. Schmuck, J. Fessey, T. Gerbaud, B. Alper, M.N.A.
Beurskens, E. de la Luna, A. Sirinelli, M. Zerbini, JET-EFDA Contributors, Rev. Sci. Instrum. 83, 125101 (2012)
[10] A. Ouroua, J. Beno, A. Bryant, A. Khodak, P. Phillips, W. Rowan, G. Taylor, D. Weeks, IEEE
TRANSACTIONS ON PLASMA SCIENCE 46,
1239 (2018)
[11] D. Farina, L. Figini, P. Platania, C. Sozzi, AIP Conf. Proc.988, 128 (2008)