ISSN: 2319-8753
I
nternational
J
ournal of
I
nnovative
R
esearch in
S
cience,
E
ngineering and
T
echnology
(An ISO 3297: 2007 Certified Organization)
Vol. 2, Issue 10, October 2013
Development of Four Stroke Four Cylinder
HSDI Diesel Engine Test Bed
Sanaur Rehman
1, Khalid Zaidi
2, Mahir Husain
3Asst. Professor, Dept. of Mechanical Engineering, COE/ TMU, Moradabad, U.P, India 1 Professor, Dept. of Mechanical Engineering, ZHCET/ AMU, Aligarh, U.P, India 1 Asst.Professor, Dept. of Mechanical Engineering, COE/ TMU, Moradabad, U.P, India 1
Abstract: The test bed for the HSDI diesel engine is developed in this study. Also in this study the energy balance on
the HSDI diesel engine is done. Energy balance is done at various speeds of the engine. Performance parameters of the engine are calculated on the test bed at various speeds. Calibration of the flowmeters (orificemeter and turboflowmeter) is done in this study. It is found that coolant losses and exhaust losses are high at low loads and other losses like radiative losses are high at high loads. Brake power increases with loads increase in load on the engine. Coolant losses as well as exhaust losses are high at low engine speed and they are small at high engine speed.
Keywords:HSDI diesel engine, energy balance, test bed, performance parameters, energy losses I. INTRODUCTION
A. Direct Injection (DI) Diesel Engine
In diesel engine air is drawn into the cylinder during the suction stroke and compressed to a very high pressure, thus raising the air temperature to a value required to ignite the fuel injected into the cylinder. The usual compression ratios vary from 12:1 to 20:1. [1]In direct injection diesel engine, the fuel is injected into a combustion chamber directly above the piston crown. The combustion chamber design is of open chamber (the disc hemisphere and bowl in piston), which puts most of the clearance volume into a compact space. In medium duty truck diesel engine, it is often necessary to use a swirling air flow rotating about the axis of cylinder, which is created by the suitable design of inlet port and valve, to achieve fuel air mixing and fuel burning rates. The fuel injection nozzle is multihole nozzle, typically with three to five holes. [2]
B. Indirect Injection (ID) Diesel Engine
The smaller diesel engine operate at higher speed the larger diesel engines, hence the time available for mixing the fuel is less and fuel injection and combustion system must achieve faster fuel-air mixing rates. Fuel is injected into this highly turbulent and often rapidly swirling flow in this auxiliary or pre chamber and very high mixing rates are achieved. Combustion starts in the pre chamber, and the resulting pressure rise in the pre chamber forces burning gases, fuel, and air into the main chamber. Since this outflow is extremely vigorous, rapid mixing then occurs in the main chamber as the burning jet mixes with the remaining air and combustion completed. [2]
II. EXPERIMENTAL SET UP
A. Experimental Set Up
The experimental set up for the diesel engine test bed comprises of the following components: • Swaraj Mazda 4-stroke Direct Injection Turbocharger Intercooled Diesel Engine.
ISSN: 2319-8753
I
nternational
J
ournal of
I
nnovative
R
esearch in
S
cience,
E
ngineering and
T
echnology
(An ISO 3297: 2007 Certified Organization)
Vol. 2, Issue 10, October 2013
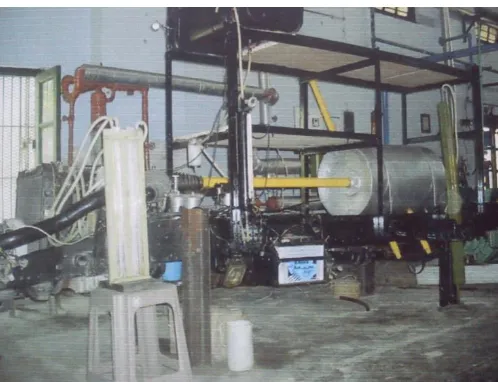
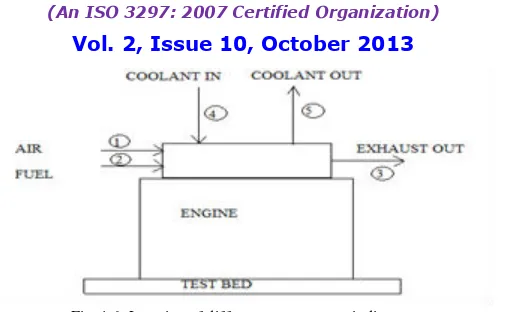
Fig. 1.1 Schematic Diagram of Diesel Engine Test Bed
Fig. 1.2 HSDI diesel engine test bed
1) Dynamometer: The hydraulic dynamometer is used in the present study as shown in the Figure.1.3. A dynamometer
is used to measure the load on the engine. The dynamometer absorbs the power developed by the prime mover. Thepower absorbed by the dynamometer must be dissipated to the ambient air or transferred to cooling water.
ISSN: 2319-8753
I
nternational
J
ournal of
I
nnovative
R
esearch in
S
cience,
E
ngineering and
T
echnology
(An ISO 3297: 2007 Certified Organization)
Vol. 2, Issue 10, October 2013
Fig 1.3 Hydraulic Dynamometer
2) Temperature Sensors:Temperature is most efficiently measured by means of thermocouple. The thermocouple used
in the present study is chromel-alumel type ( K-type). Operating range of chromel-alumel thermocouple is from 0ᴼF to 2300ᴼF. [3]
There are five thermocouples mounted as follows For measuring the inlet coolant temperature. For measuring the outlet coolant temperature. For measuring the exhaust gas temperature.
For measuring the inlet air temperature after turbocharged For measuring inlet air temperature before turbocharged.
3) Fuel tank:There are two fuel tanks, one is of larger diameter and the other one is of smaller diameter. Both the tanks are attached with a glass tube parallel to it from the bottom end. The diameter of glass tube is 6 mm and the diameter of fuel tank is 72 mm.
4) Crank Angle Disc:It is a cast iron disc of 8 inch in diameter mounted on the engine shaft. Three holes of appropriate diameter being 30 degree apart from each other made on the disc. The centre slot represents the TDC of the engine. The slot ahead of the central slot represents the advance and the one to the right represent the 30 degree after TDC.
III. CALIBRATION
A. Calibration
The calibration of all instruments is instrument against a known standard subsequently to reduce error in accuracy. Calibration procedures involve a comparison of the particular instrument with either (1) a primary standard, (2) a secondary standard with a higher accuracy than the instrument to be calibrated or (3) a known input source. [3]
B. Flow meters
ISSN: 2319-8753
I
nternational
J
ournal of
I
nnovative
R
esearch in
S
cience,
E
ngineering and
T
echnology
(An ISO 3297: 2007 Certified Organization)
Vol. 2, Issue 10, October 2013
= 0.3164*(Re)-0.25
(2)
V = (Re* )/(ρd) (3)
Combining above (1), (2) & (3) and putting ∆P = (ρl)g(hl)
We get
Reth = {[2*gρρld2hl]/[(L/d) 2*0.3164]}1/1.75
mth = ρVA= ρA*(Re* )/(ρd)
Putting d = 0.027 mm = 8.57*10-4
kg/m sec L/d = 27.8
L = Length of pipe = 75.06 cm
ρ= 13600kg/m3
ρ= 1000 kg/m3
mth = 17.67*(hl)1/1.75 mact = Cd *17.67*(hl)1/1.75
Where Cd is the Coefficient of discharge
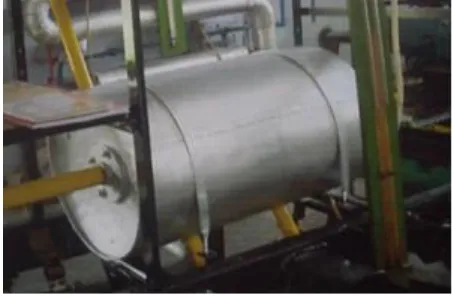
Fig 1.4Turbulent flowmeter for air flow
2) Orificemeter
ISSN: 2319-8753
I
nternational
J
ournal of
I
nnovative
R
esearch in
S
cience,
E
ngineering and
T
echnology
(An ISO 3297: 2007 Certified Organization)
Vol. 2, Issue 10, October 2013
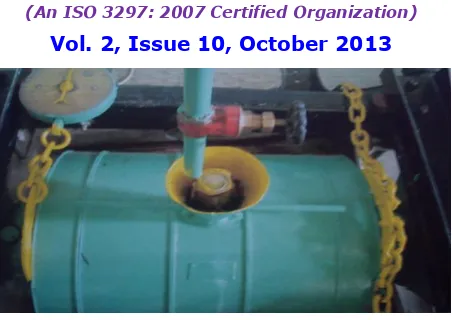
Fig 1.5Orificemeter for coolant flow
Calibration of the orificemeter is done in the following way. We have the relation for volumetric flow rate of coolant as
Qth ={ π*d2*[(2*gc*∆P)/ρw]0.5}/{4*[1-(d/D)4]}0.5
Putting D = 36.2 mm, d = mm ∆P = 13600 * 9.81*hl
ρw= 1000 kg/m3 We get
Qth = 1.859*10-3*hl0.5 Qact = Cd * Qth
Or Rth = (4*ρ * Qth)/(π*d* ) Where
ρw= 1000 kg/m3 = 8.57*10-4
kg/m sec d = 36.2 mm, we get Rth = 4104.13*104* Qth
IV.PERFORMANCE PARAMETERS
Basic engine performance parameters are the following:
A. Brake Power
The power developed by the engine at the shaft is called brake power (BP) and is given as BP = (2*π*N*T/60)
ISSN: 2319-8753
I
nternational
J
ournal of
I
nnovative
R
esearch in
S
cience,
E
ngineering and
T
echnology
(An ISO 3297: 2007 Certified Organization)
Vol. 2, Issue 10, October 2013
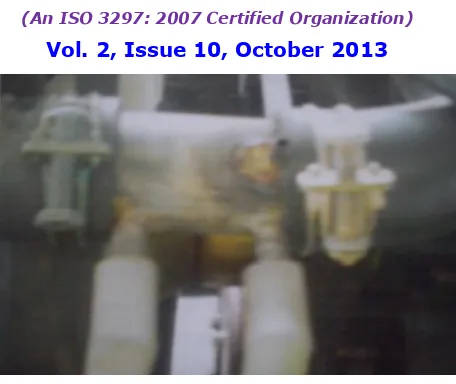
Fig. 1.6 Location of different temperatures indicators
C. Measurement of fuel flow rate
There are two fuel tanks, one is of larger diameter and the other one is of smaller diameter. Both the tanks are attached with a glass tube parallel to it from the bottom end. A scale is kept to measure the fuel level in the glass tube hence in the fuel tank. Fuel starts falling in both the tanks and hence in the glass tube. The fall in the level of fuel in the can be measured with the help of the scale and time is noted for definite fall of level. By knowing the diameter of the fuel tank and the glass tube one can know the fuel consumption per unit time. Mass flow rate of fuel is given as
Mf = (area of tank*density of fuel*length of liquid fall)/time
D. Measurement of Air flow rate
Air flow rate is measured with the help of turbulent flow meter. Air flow rate is given as
Ma = Area*Vth*ρ*Cd Where
Vth= (Rth* )/(ρ*d)
V. ENERGY BALANCE A. Heat released from the combustion of fuel is given as
Qf = Mass flow rate of fuel * Lower calorific value of fuel
B. Heat gained by coolant is given as
Qc= Mass flow rate of coolant*sp heat*temp difference
C. Heat carried away by exhaust is given as
Qe = mass flow rate of exhaust* sp heat*temp difference
D. Brake power available is given as
BP = (2*π*N*T/60)
VI.RESULT AND DISCUSSION
A. Graphs for results obtained when engine running at 1500 rpm
ISSN: 2319-8753
I
nternational
J
ournal of
I
nnovative
R
esearch in
S
cience,
E
ngineering and
T
echnology
(An ISO 3297: 2007 Certified Organization)
Vol. 2, Issue 10, October 2013
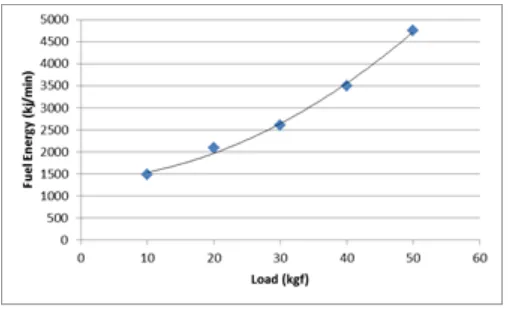
Since the CI engines are quality governed engines i.e., with increase in load on the engine, the air supply remains constant but the fuel supply changes and it increase with load on the CI engine [5] and this can be explained by the Fig.1.7 and Fig. 1.11 at both speeds.
Fig 1.7 Variation of fuel energy with load at 1500 rpm engine speed
ISSN: 2319-8753
I
nternational
J
ournal of
I
nnovative
R
esearch in
S
cience,
E
ngineering and
T
echnology
(An ISO 3297: 2007 Certified Organization)
Vol. 2, Issue 10, October 2013
Fig 1.10 Variation of A/F ratio with engine load at 1500 rpm engine speed
B.Graphs for results obtained when engine running at 2500 rpm
Fig 1.11 Variation of fuel energy with load at 2500 rpm engine speed
ISSN: 2319-8753
I
nternational
J
ournal of
I
nnovative
R
esearch in
S
cience,
E
ngineering and
T
echnology
(An ISO 3297: 2007 Certified Organization)
Vol. 2, Issue 10, October 2013
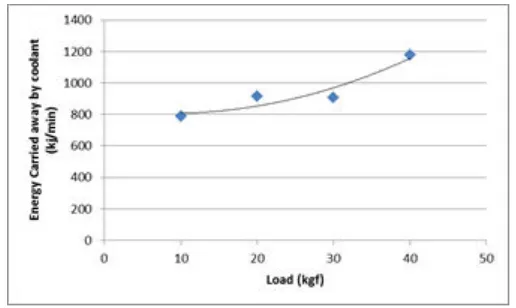
Fig.1.13Variation of Exhaust energy with load at 2500 rpm engine speed
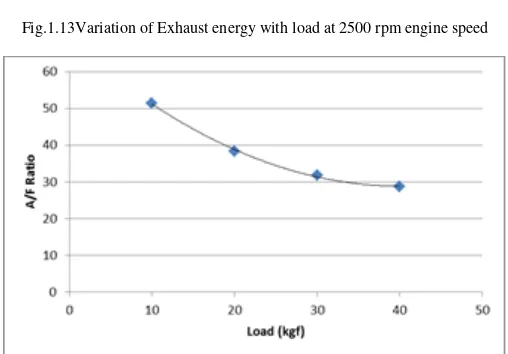
Fig. 1.14 Variation of A/F ratio with engine load at 2500 rpm engine speed
C. Energy or Heat Balance Graphs
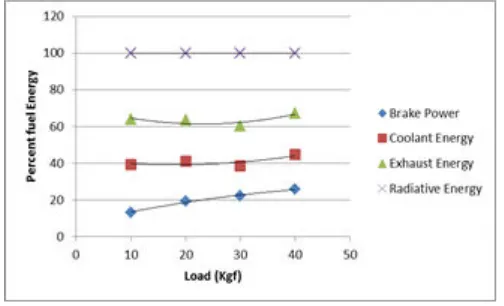
The energy balance within an engine is very complicated. The energy input to the engine goes out in various forms- a part in the form of brake power output, a part goes into exhaust and the rest is taken by the cooling water and lubricating oil. The breakup of fuel energy into these different parts is called heat balance. A substantial part of the friction power (about half) is dissipated between the piston and piston rings and cylinder wall and is transferred as thermal energy to the cooling medium. The remainder of the friction power is dissipated in the bearing, valve mechanism, or drives auxiliary devices and is transferred as thermal energy to the surrounding environment. The heat carried away by the cooling medium consists of heat transferred to the combustion chamber walls from the gases in the cylinder, heat transferred to the exhaust valves and port in the exhaust process. [6]
ISSN: 2319-8753
I
nternational
J
ournal of
I
nnovative
R
esearch in
S
cience,
E
ngineering and
T
echnology
(An ISO 3297: 2007 Certified Organization)
Vol. 2, Issue 10, October 2013
Fig 1.15: Percent fuel energy distribution at variable load and constant speed at 1500 rpm
Fig 1.16: Percent fuel energy distribution at variable loadand constant speed at 2500 rpm
VII.CONCLUSION
In the present study heat or energy balance is done on a four stroke four cylinder turbocharged intercooled DI diesel engine test bed. Energy balance is done at various speeds of the engine. Performance parameters of the engine are calculated on the test bed at various speeds. Calibration of the flowmeters (orificemeter and turboflowmeter) is done in the present study. It is found that coolant losses and exhaust losses are high at low loads and other losses like radiative losses are high at high loads. Brake power increases with increase in load on the engine. Coolant losses as well as exhaust losses are high at low engine speed and they are small at high engine speed.
ACKNOWLEDGMENT
We have a great pleasure in expressing our deep sense of gratitude and indebtedness toProf.Khalid Zaidi, Department of Mechanical Engineering, Aligarh Muslim University, Aligarh. We would like to thank him for his esteemed guidance, encouragement and valuable advice during this paper work.
REFERENCES
[1] Mathur& Sharma, ‘International Combustion Engine’,DhanpatRai Publications (P) ltd, Eighteen Edition, 2008.
[2] Heywood, John. B. ‘Internal Combustion Engines Fundamentals’, Tata-McGraw Hill Edition, 2011.
[3] Holman, J.P. ‘Experimental Methods for Engineers’ 7thEdition, Boston Burr Ridge, McGraw Hill (2001).
[4] Schlichting, Herman, ‘Boundary Layer Theory’, 6th Edition, New York, McGraw Hill (1968).
[5] V. Ganesan, ‘Internal combustion Engine’, 2nd Edition, Tata McGraw Hill (2006).
[6] Edward F. Obert, ‘Fundamentals of Internal Combustion Engines’, Harper & Row Publishers.