ISSN(Online): 2320-9801 ISSN (Print): 2320-9798
I
nternational
J
ournal of
I
nnovative
R
esearch in
C
omputer
and
C
ommunication
E
ngineering
(An ISO 3297: 2007 Certified Organization)
Vol. 3, Issue 5, May 2015
Detecting Text or character in Natural Scenes
with Stroke Width Transform
Hemil A. Patel, Kishori S. Shekokar
M.E. Student, Department of Computer, Sigma Institute of Engineering, Vadodara, Gujarat, India
Head, Department of Computer, Sigma Institute of Engineering, Vadodara, Gujarat, India
ABSTRACT: Detecting text or character in an image of a natural scene, by using the SWT (Stroke Width Transform) the approach of SWT is grouping pixels together in an intelligent way, instead of looking for separating features of pixels. SWT is an image operator that seeks to find the value of stroke width for each image pixel, and describe its use on the task of text detection in natural images. The SWT image operator is local and data dependent. The application receives an RGB image to search in, and returns a new image where the text segments are marked. Due to the features of the SWT, the resulting system is able to detect text anyhow of its scale, direction, font and language.
KEYWORDS: Text Detection, edge detection, Stroke Width Transform (SWT), Connected Component algorithm.
I. INTRODUCTION
Text or character detection in a natural scene is an important part of many Computer Vision tasks. As like, the operation of (OCR) optical character recognition algorithms can be highly improved by first finding the regions of text or character in the image. Text detection in natural scenes is a highly researched field, and there are numerous approaches for solving this problem. Recovering text or character in natural environments provides contextual indication for a wide variety of vision tasks. The performance of image retrieval algorithms depends heavily on the performance of their text detection methods. As like If two book covers of the same design but with different text, prove to be virtually identical without detecting and OCRing the text [1].
(a) (b) Figure 1: (a) natural image (b) text detected images.
ISSN(Online): 2320-9801 ISSN (Print): 2320-9798
I
nternational
J
ournal of
I
nnovative
R
esearch in
C
omputer
and
C
ommunication
E
ngineering
(An ISO 3297: 2007 Certified Organization)
Vol. 3, Issue 5, May 2015
II.RELATED WORK
Text Detection approaches
Current text detection approaches can be broadly categorized into three groups: texture based approach, region-based approach and hybrid approach.
2.1 Texture based approach
Texture-based approaches [5] are similar to the approaches of general object detection with sliding windows. They utilize distinct textural properties of text regions to extract candidate sub-windows and the final outputs are formed by merging these sub-windows. These approaches are able to deal with litter background scenes. But there are always some limitation regions in outputs and they are very time consuming.
2.2 Region-based approach
Region-based approaches [5] attempt to use similarity standard of text, such as colour, size, stroke width, edge and gradient information, pixels are together into connected components (CCs) and non-text CCs are filtered out with geometric hypothesis or conditional random fields (CRFs). These approaches usually have lower computation cost and the outputs can closely cover text regions. However, they may meet great challenges in litter background.
2.3 Hybrid approach
Hybrid approaches [5] seek to introduce textural property of text regions into region-based approach. These approaches take advantages of both region based approaches which can closely cover text regions and texture-based approaches which can estimate of the coarse text location in litter scenes. However, they are also time consuming.
II. PROPOSED WORK
The traditional method of detecting text in natural scenes images with Stroke Width Transform [1, 2], which uses region-based approach for text detection. Most text detection schemes restrict the user to specific languages, scale and direction of the text. Many helpful works have been done using Stroke Width Transform. Region-based approach uses some rules of text, such as color, size, stroke width, edge and gradient information, to gather pixels jointly into connected components (CCs) and non-text CCs are filtered out with geometric hypothesis or conditional random fields (CRFs).Using this method detection of single character is very difficult. However, after reviewing different text detection techniques we find out that the use of hybrid approach with Stroke Width Transform the detection of single character and curvy letters (Arabic fonts, Gujarati fonts) smoothly.
4.1 Detection Algorithm
In Text detection algorithm there are different modules in which the whole system performs different tasks.
Figure 2: Text detection algorithm.
Image
Edge
Detection
SWT
Improve
find letter
candidates
Filtering
Improve Text
line
Aggregation
Word
Detection
Detected
ISSN(Online): 2320-9801 ISSN (Print): 2320-9798
I
nternational
J
ournal of
I
nnovative
R
esearch in
C
omputer
and
C
ommunication
E
ngineering
(An ISO 3297: 2007 Certified Organization)
Vol. 3, Issue 5, May 2015
4.1.1 Edge Map (Edge Detection)
In order to recover strokes, we first compute edges in the image using canny edge detector.
4.1.1.1 Canny Edge Detection
The Canny edge detector is an edge detection operator that uses a multi-stage algorithm to detect a wide range of edges in images. It was developed by John F. Canny in 1986. Canny also produced a computational theory of edge detection explaining why the technique works [9]. The points at which image brightness changes sharply are typically organized into a set of curved line segments termed edges.
Canny edge detection is a four step process.
1. A Gaussian blur is applied to clear any spotted, and free the image of noise. 2. A gradient operator is used for obtaining the gradients' intensity and direction.
3. Non-maximum suppression determines if the pixel is a better candidate for an edge than its neighbours. 4. Hysteresis thresholding finds where edges begin and end.
Canny discovered the optimal edge detection algorithm. An "optimal" edge detector means: Good detection – algorithm should mark as many real edges in the image as possible. Good localization – edges marked should be as near as possible to the edge in the real image.
Negligible response – a given edge in the image should only be marked once, and where possible, image noise should not create false edges.
To satisfy these requirements Canny used the calculus of variations – a technique which finds the function which optimizes a given functional. The optimal function in canny’s edge detector is described by the sum of four exponential terms, but it can be approximated by the first derivative of a Gaussian.
The size of the Gaussian filter: the smoothing filter used in the first stage directly affects the results of the canny algorithm. A smaller filter creates less blurring, and allow detection of small, sharp lines. A larger filter creates more blurring, marking out the value of a given pixel over a larger area of the image. Larger blurring radiuses are more useful for detecting larger, smoother edges.
4.1.2 SWT (The Stroke Width Transform)
The Stroke Width Transform is a local image operator which computes per pixel the width of the most likely stroke containing the pixel [2]. The output of the SWT is an image of size equal to the size of the input image where each element contains the width of the stroke associated with the pixel. We define a stroke to be a contiguous part of an image that forms a band of a nearly constant width, as depicted in Figure 3(a). We do not assume to know the actual width of the stroke but rather recover it.
(a) (b)
(c)
ISSN(Online): 2320-9801 ISSN (Print): 2320-9798
I
nternational
J
ournal of
I
nnovative
R
esearch in
C
omputer
and
C
ommunication
E
ngineering
(An ISO 3297: 2007 Certified Organization)
Vol. 3, Issue 5, May 2015
First, all pixels are initialized with ∞ as their stroke width. Then, we consider the edges as possible stroke boundaries, and we wish to find the width of such stroke. If p is an edge pixel, the direction of the gradient is roughly perpendicular to the orientation of the stroke boundary. Therefore, the next step is to calculate the gradient direction of the edge pixels, and follow the ray = + ∗g ( > 0) until we find another edge pixel q. If the gradient direction at q is roughly opposite to , then each pixel in the ray is assigned the distance between p and q as their stroke width, unless it already has a lower value. If an edge pixel q is not found, or is not opposite to , the ray is discarded. In order to accommodate both bright text on a dark background and dark text on a bright background, we need to apply the algorithm twice: once with the ray direction and once with – .
(a) (b) Figure 4: Filling pixels with SWT values
As shown in Fig. 4 (b), SWT values in more complex situations, like corners, will not be true stroke widths after the first pass described above. Therefore, we pass along each non-discarded ray again, compute median SWT value m of all its pixels, and thenset all the pixels of the ray with SWT values above m to be equal to m.
4.1.3 Finding letter candidates
We now have a map of the most likely stroke-widths for each pixel in the original image. The next step is to group these pixels into letter candidate. This will be done by first grouping pixels with similar stroke width, and then applying several rules to distinguish the letter candidates.
The grouping of the image will be done by using a Connected Component algorithm. In order to allow smoothly varying stroke widths in a letter, we will let two pixels to be grouped together if their SWT ratio is less than 3.0[2]. Now we must detect the connected components which can pass as letter candidates, by applying a set of fairly flexibly rules. These rules are as follows:
1. The variance of the stroke-width within a component must not be too big. This helps with Rejecting foliage in natural images, which are commonly mistaken for text.
2. The aspect ratio of a component must be within a small range of values, in order to reject long and narrow components.
3. The ratio between the diameter of the component and its median stroke width to be less than a learned threshold. This also helps reject long and narrow components.
4. Components whose size is too large or too small will also be ignored. This is done by limiting the length, width, and pixel count of the component.
5. The ratio between the pixel count of the component and the amount of pixels in the bounding box of the component should be within a bounded range. This rejects components that spread over a large space, yet have a small pixel count, and components which cover most of their bounding box.
4.1.4 Grouping letters into text lines
Since single letters are not expected to appear in images, we will now attempt to group closely positioned letter candidates into regions of text.
ISSN(Online): 2320-9801 ISSN (Print): 2320-9798
I
nternational
J
ournal of
I
nnovative
R
esearch in
C
omputer
and
C
ommunication
E
ngineering
(An ISO 3297: 2007 Certified Organization)
Vol. 3, Issue 5, May 2015
Again, we will use a small set of rules to group letters together into regions of text. These rules will consider pairs of letters, and are as follows:
1. Two letter candidates should have similar stroke width. For this reason we limit the ratio between the median stroke-widths to be less than some threshold.
2. The ratio between the heights of the letters and between the widths of the letters must not Exceed 2.5. This is due to capital letters next to lower case letters.
3. The distance between letters must not exceed three times the width of the wider one.
4. Characters of the same word are expected to have a similar color; therefore we compare the Average color of the candidates for pairing.
Finally, text lines are broken into separate words, using a heuristic that computes a histogram of horizontal distances between consecutive letters and estimates the distance threshold that separates intra-word letter distances from inter-word letter distances.
IV.EXPERIMENTAL RESULTS
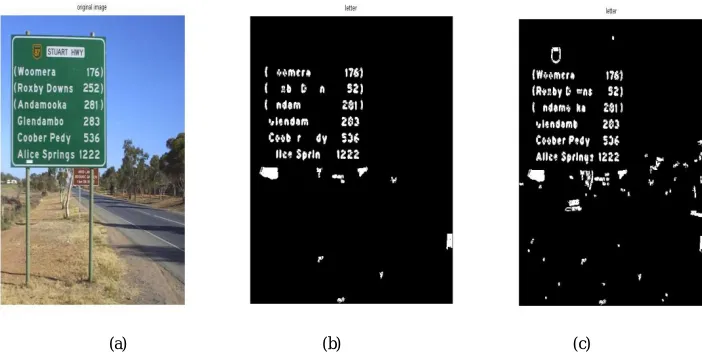
(a) (b) (c)
Figure 5: (a) Original image (b) Existing system output image (c) Proposed system output image
(a) (b) (c)
ISSN(Online): 2320-9801 ISSN (Print): 2320-9798
I
nternational
J
ournal of
I
nnovative
R
esearch in
C
omputer
and
C
ommunication
E
ngineering
(An ISO 3297: 2007 Certified Organization)
Vol. 3, Issue 5, May 2015
Table 3: Performance measurement of text detection.
V.CONCLUSION AND FUTURE WORK
In this present work it has been concluded that Detecting Text or character in Natural Scenes with Stroke Width Transform allows us to apply the method to many fonts and languages. Connected component algorithm is having some predefined rules. Existing algorithm uses two approaches like texture based and Region-based approaches so detection of single character is not possible. The grouping of letters can be improved by considering the directions of the recovered strokes. Using the hybrid approach curvy character and hand written letters can be detected. This may also allow us to detect curved text lines. It allows identifying curvy letters better, such as Gujarati Fonts, Arabic fonts or cursive handwriting. In future using some pre-processing operation, efficiency of the algorithm can be improved.
REFERENCES
1. Gili Werner.” Text Detection in Natural Scene with Stroke Width Transform”, ICBV, February, 2013.
2. B. Epshtein, E. Ofek, and Y. Wexler,“ Detecting text in natural scenes with stroke width transform,” Conference on Computer Vision and Pattern Recognition(CVPR), IEEE, 2010.
3. S. Karthikeyan, VigneshJagadeesh and B.S. Manjunath” Learning bottom-up text attention maps for text detection using stroke width transform”,20th IEEE International Conference on ICIP,2013.
4. AnharRisnumawan, Palaiahankote, Shivakumara, Chee Seng Chan, Chew Lim Tan. “A robust arbitrary text detection system for natural scene images”, Elsevier 2014.
5. Yuning Du, GenquanDuan, Haizhou Ai.” Context-based text detection in natural scenes”, In Proceedings of the ICIP, 19th International Conference, IEEE 2012. 6. Yao Li,Huchuan Lu” Scene Text detection via Stroke Width”,21st International Conference on Pattern Recognition (ICPR), IEEE 2012.
7. Huizhong Chen, Sam S. Tsai, Georg chroth, David M. Chen, RadekGrzeszczuk and Bernd Girod”robust text detection in natural images with edge-enhanced maximally stable extremal regions”,18th IEEE International Conference ,ICIP,2011.
8. ChucaiYi,YingLi Tian” Text String Detection from Natural Scenes by Structure based Partition and Grouping ”,Image Processing, IEEE Transactions,2011. 9. J.Canny,” A Computational Approach to Edge Detection”, IEEE Trans. Pattern Analysis and Machine Intelligence, 1986.
10. MasoudNosrati, RonakKarimi, Mehdi Hariri, Kamran Malekian. “Edge Detection Techniques in Processing Digital Images: Investigation of Canny Algorithm and Gabor Method”. World Applied Programming, Vol (3), Issue (3), 2013.
11. Ramesh R. Manza, Bharatratna P. Gaikwad, Ganesh R.Manza. “Used of Various Edge Detection Operators for Feature Extraction in Video Scene”.UACEE International Journal of Computer Science and its Applications - Volume 2: Issue 2, 2011.
0 0.2 0.4 0.6 0.8 1 Existing System 1 Existing System-2
Result 1 Result 2
Precision Recall
Precision Recall f-measure (%)
Existing System1 0.34213 0.31718 32.91847
Existing System2 0.26137 0.27340 26.72525
Result 1 0.38449 0.39488 38.96167
Result 2 0.23183 0.35738 28.12284
0.00% 20.00% 40.00% 60.00% 80.00% 100.00% Existing System1 Existing System2