Monitoring and Evaluation Study
Report number 1
Evaluation of
baseline data
Michael Edwards and Emmanuel Mutale
The Bartlett School of Planning
University College London
22 Gordon Street
London WC1H 0QB
C O N T E N T S
List of figures and tables i
Acknowledgements ii
Executive Summary 1
1 Scope and Organisation of the report 2
2 Introduction 5
3 Baseline study of key indicators at King's Cross 6
4 Policy Mapping 20
5 Findings, Proposals, and priorities for action 23
References 26
LIST OF FIGURES The King's Cross Partnership SRB area 4
Unemployment in SRB area, Camden and Islington, and London 8
Educational attainment in the SRB area and national 9
Comparative rent for commercial space 12
Police crime figures 18
Logic diagram relating to objective 1 21
Logic diagram relating to objectives 2 and 3 22
Proposed baseline indicators 23
The Bartlett School of planning
The Bartlett School of Planning is part of UCL's multi-disciplinary Faculty of the Built Environment. The School maintains a position as one of the premier planning schools in the UK and Europe. In the most recent Higher Education Funding Council for England teaching quality assessment exercise the Bartlett was awarded 'Excellent' and in the 1996 Research Assessment Exercise attained an international excellent rating of '5'.
The School of Planning offers both undergraduate and graduate programmes in planning, including the Royal Town Planning Institute (RTPI) accredited Mphil in Town Planning and RTPI accredited PhD in Planning.
Acknowledgements
King's Cross Partnership monitoring and evaluation
study: Report number 1
Executive Summary
The King’s Cross Partnership (KXP) was established in 1995 with a grant from the Single Regeneration Budget (SRB) administered by the Government
Office for London (GOL). Its purpose is to regenerate the King’s Cross area
by initiating activities aimed at tackling a range of economic, social and environmental problems in the area.
As a result of competitive bidding, the Bartlett School of Planning at University College London was awarded the contract to carry out, as is expected by the government, an independent impact evaluation and monitoring study of the scheme. The monitoring and evaluation study aims to:
• provide assessments of the impact of the scheme through quantitative and qualitative information;
• attempt to identify whether changes in the SRB area can be wholly, partly or not at all attributed to regeneration activities; and
• present evidence on the extent to which Partnership projects have produced the desired outcomes, and thus assist the Partnership in setting future priorities.
This report, the first in a series, presents a critical evaluation of the baseline
data upon which the SRB bid was made in 1995 and against which changes
that are planned to be delivered by the scheme will be measured or indicated. The opening section gives a brief introduction of the KXP, lists the main aims of this report and outlines the structure of this report. The second section provides the historical context of King’s Cross and a broad but brief overview of the difficult challenge of securing regeneration benefits for everyone. Section three is a critical discussion of the validity and adequacy of baseline data used in the 1995 bid application relative to the scheme’s 7 strategic objectives with suggestions for additional baseline indicators. Section four is an attempt to break down, map and analyse the possible linkages between strategic
objectives, KXP activities and possible outcomes. As well as stating the main finding and priorities for action, a comprehensive set of indicator measures and possible sources of information are given section 5.
The main finding is that the baseline data are patchy leading to the conclusion that the SRB bid was not based on any systematic analysis or account of the characteristics, dynamics, the potential and the needs of the area in the mid-1990s. There is not much scope now for collecting data for 1995/96 to re-construct the missing data from the original baseline. But because of the need to establish a link between the scheme today and at inception, it is proposed to write a short report based on desk research of the social, business and
1. Scope and organisation of the report
The King’s Cross Partnership is a cooperation set up by public, private and voluntary sector 'partners' to undertake and coordinate urban regeneration activities in the King's Cross area of London (Figure 1). The founding partners were the London Boroughs of Camden and Islington, the two railway
companies Railtrack and London and Continental Railways (LCR), the
community and other public sector. The partners came together to bid for funds from the government's Single Regeneration Budget and were successful in their bid on the second attempt, receiving funding of £37.5m for a 7-year programme of work to start in April 1996.
The systematic establishment of a baseline picture of conditions in the area, and the establishment of a system of independent monitoring, were envisaged from the outset. Some initial work was done by the staff of the local authorities and by staff of the Partnership in assembling a statistical portrait of the locality in its context but rather little has been done in subsequent years and only in 1999 did the Partnership invite tenders for a programme of independent monitoring and evaluation.
A team at UCL was, as a result, contracted to undertake the study of which this report is the first product.
The aim of this report is to present a critical evaluation of the baseline data against which the Partnership and those to whom it reports evaluate what has changed and what has been achieved.
The report aims to generate informed discussion and then decisions on a number of key issues:
• What has the Partnership been trying to achieve? In other words what are the desired outcomes from its work?
• Has it been taking actions which could be expected to lead to these desired outcomes? In other words is it producing the most appropriate outputs? • To what extent can success or failure in achieving these outcomes be
assessed by comparing the situation at the outset (the baseline) with the situation later?
• With this aim in mind, does the Partnership have the most appropriate (or at least an adequate) set of data about the baseline situation? Are any key data missing or likely to be seriously inaccurate or are there measures which would be better indicators of what it is desired to measure?
This report has been circulated in draft to the staff and Board of KXP and GOL. This circulation has generated very few comments. These comments have been reflected in the present version which thus constitutes an agreed plan of work. Wider consultations and further evidence may, however, suggest
revisions in future.
(or some other date in the early-to-mid 90s) but which has not yet been used;
(ii) through the collation of data for the present period from organisations which hold it, where retrospective coverage is not possible;
(iii) through direct survey during 2000 as part of the UCL research programme or by other organisations.
The structure of this report is as follows:
2. Introduction: challenges, opportunities and conflicts. A
discussion of the locality and of the SRB scheme in context, outlining some of the key issues.
3. Baseline study of key indicators at King's Cross - offers an
overview of the validity of objective-indicator relationship, identifies indicator gaps and offers suggestions on filling these gaps.
4. Policy mapping (Logic diagrams) - analysis of cause and effect
in regeneration.
2. Introduction.
King’s Cross – Challenges, Opportunity and Conflict
King's Cross poses a very special challenge. Its character is essentially the result of massive investment and innovation in the nineteenth century followed by equally heavy disinvestment and blight in the twentieth century.
Prolonged blight has stemmed from the failure of railway investment for much of this century, the switch of freight away from city railheads and chronic indecision about the area by public authorities for the last half century. This blight has discouraged construction investment (except for massive social house building between the wars and since the 50s) and discouraged building maintenance making the area one of the more decrepit in England.
The King's Cross area thus became distinctive for its sustained low property values, vacant spaces and run-down character. Strong local communities developed alongside a very distinctive set of enterprises - small and medium units in charitable, non-profit, campaigning and social fields, business
enterprises servicing central London culture and catering, cement batching, waste processing and so on.
While other run-down areas of London - Covent Garden, Clerkenwell,
Bankside, Docklands - turned around, attracted investment and 'regenerated' during the 70s, 80s and 90s, King's Cross tended to remain relatively
unaffected. The area and its people bore the costs of disrepair and decay but also got benefits in being sheltered from some of the displacement and 'gentrification' pressures which mounted elsewhere from the 70s through the 90s. The local situation was badly affected by the disinvestment in the council housing stock through most of the post-war period.
The area thus attracts both odium and affection - odium from large investors, those who seek modernisation, commercial expansion and so on; affection from those who benefit from its cheap space, its strong communities, its historic building assemblages, vibrant sub-cultures, cultural resources, cheap bars and restaurants.
The prospect of an end to uncertainty about the railway infrastructure, of being again the high point of the UK railway network and an even stronger primary node in the structure of Central London is therefore a much bigger
transformation than would be the case elsewhere: the transformation would be from very low to very high on the scale of commercial value. The area is thus one with strong latent conflicts of interest as it begins a transition to a new expected status.
The creation of the King’s Cross Partnership, and its statements of aims, represent a strong commitment to the management of this transition in such a way as to gain benefits for all concerned - to secure and improve the position of vulnerable residents alongside new ones, to foster the growth of existing
The monitoring of the work of the Partnership is thus of double importance - for internal and for external consumption and debate. Internally the Partnership, the partners and the government need continually to evaluate the effectiveness of what is being done. Externally the Partnership needs to be able to give an account of itself in a national and international context as a pioneer in urban management.
3 Baseline Study of key indicators at King’s Cross
In establishing a baseline, a number of appropriate quantitative and qualitative measures are selected to define the benchmark position at or just prior to the scheme being initiated forming the basis for future updates. At selected milestone dates, the baseline position is updated and the updated situation assessed relative to target outputs. One main aim of this comparison is to assess whether measured outputs from regeneration activities (e.g. training weeks delivered, business start-ups supported) have in fact led to the desired outcomes (e.g. higher levels of employment or more business activity).
Output measures as a tool for evaluation are inadequate by themselves in that they often do not say whether regeneration activities contribute to the attainment of strategic objectives, expected and desired ends. Outcome or impact
measures on the other hand seek to establish the extent to which strategic objectives are being achieved. For example, an output measure stating the number of street lights installed says nothing about the level of (or indeed a community’s anxiety about) crime.
The process of validating baseline data involves judgements (often with a necessarily subjective element) informed by expert opinion of the indicators used in establishing the baseline, or empirical evidence showing that indicators used measure what is intended (Streiner and Norman 1989). In summary, both output and outcome (impact) measures should be:
• scientifically sound and technically robust, • easily understood,
• sensitive to change, • measurable and
• capable of easy update.
The extent to which each of the measures satisfies these criteria differs from one measure to another. This study adopts, where relevant, all those measures proposed by the Department of the Environment (DETR 1998a) but also draws in additional relevant measures.
A discussion of key baseline indicators at the end of 1995 (immediately before the launch of the scheme in April 1996) provides a context of the conditions in the SRB area valuable in understanding not only the dimensions of
regeneration challenges but also the opportunities and resources available to resolve those challenges. The discussion is organised under seven sub-sections corresponding to the seven strategic objectives. This section offers an initial analysis of the validity of objective-indicator relationship, identifies
3.1 Enhance the employment prospects, education and skills of local people, particularly the young and those at a disadvantage, and promote equality of opportunity
The link between poverty and unemployment is well established with the result that unemployment measures have been one key indicator in regeneration programmes whose central aim is to tackle problems associated with poverty and deprivation (Pacione 1990). It should be noted, however, that poverty can also arise among:
• the economically inactive (especially those over retirement age or who are unable to seek work through disability or ill health)
• those in work who either cannot work enough hours to earn a living or suffer low pay.
It is especially important in London to note that a relatively high income is required to support an average standard of living because of the relatively high prices of housing, transport and some services. This is a problem affecting all households. Baseline data on unemployment is thus only one part of the data which would be needed to indicate the extent of poverty.
According to the King’s Cross Challenge Fund Bid presented in 1995,
unemployment among residents in the SRB area was estimated at 23% against an average of 15% across the two boroughs of Camden and Islington, and 11% across Greater London. Disaggregated according to age, youth unemployment was 33% as compared to joint borough average of 17%. As a proportion of the entire workforce in the area, 29% of ethnic minority residents were unemployed compared to a joint borough average of 21% (King’s Cross Challenge Fund Bid 1995).
A number of factors may contribute to high levels of unemployment:
(a) demand deficiency - where there simply is not enough demand for labour to employ everyone, especially in a recession;
(b) friction in the labour market - where a lot of people are changing jobs with gaps between working periods;
(c) structural problems - where parts of the economy are shrinking as others expand. This is a major contributor to Inner London unemployment. Many of the sectors which used to employ King's Cross people have declined, especially manufacturing and distribution industry jobs and have been replaced with office-type employment. The pivotal role King’s Cross played as a distribution centre for fish, coal and other bulky commodities has declined for decades (Thorne 1997). Jobs in mail and newspaper transport have largely gone from the locality too. Camden lost 40% of its manufacturing employment over 1981-87 and 200,000 square metres of industrial floor space between 1971-86
Set against these declines has been the rapid growth of service sector jobs, led by public services in the 1970s and private services in the 80s and 90s. The service economy of London, including central London, has expanded greatly with jobs across a wide spectrum from those demanding advanced degrees, through retail and transport work to low-skill manual work in hotels, cleaning and security. If the presence of jobs were enough, all King's Cross residents could be employed. Possible reasons for unemployment in these
circumstances could include:
• 1. caring responsibilities which prevent employment • 2. complete disability or sickness
• 3. other reasons for not seeking work
• seeking work but unable to compete successfully... • 4. because of lack of skills sought by employers
• 5. wage expectations which the market does not match (which can be reinforced by a 'benefit trap' in some cases)
• 6. language problems
• 7. discrimination by employers.
The baseline data so far available gives no clues as to the relative contribution of these factors to the high unemployment in the SRB area. Most of the policy initiatives pursued so far appear to have been aimed at perceived skill deficits (4) language problems (6) and to some extent child care needs (1). Action has also been targeted to a substantial extent at schools and young people rather than at older workers.
The high representation of people with health problems in the 1991 census, suggests that this may account for some of the low levels of employment
London, 1995
0 5 10 15 20 25
SRB Area Camden & Islington Greater London
Source : King’s Cross Challenge Fund Bid 1995
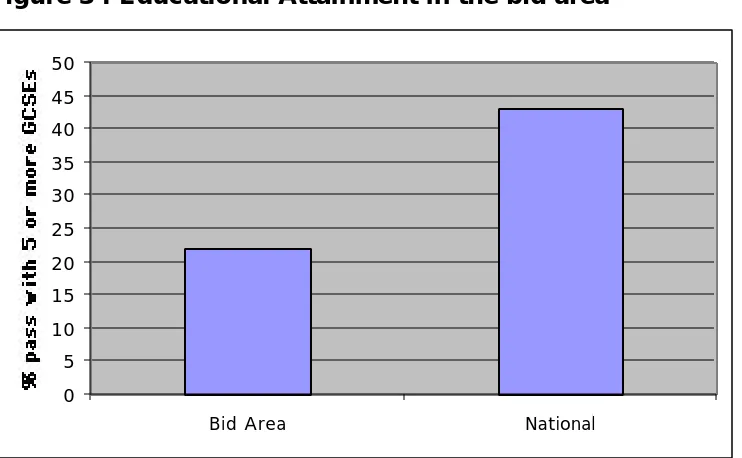
Figure 3 : Educational Attainment in the bid area
0 5 10 15 20 25 30 35 40 45 50
Bid Area National
Source : King’s Cross Challenge Fund Bid 1995
The challenge for regeneration is to reduce unemployment especially among the young and ethnic minority groups who are disproportionately represented among the unemployed compared to Greater London average, and improve educational attainment to inner London levels (King’s Cross Partnership 1999). The minority proportion in 1991 was about 27-32% depending on whether those of Irish birth are included as a minority or as part of the white majority. In relation to the first objective, baseline indicators used relate only to the levels of unemployment and number of GCSE passes. Both fail to reflect the exact intent of the objective – to enhance residents’ employment prospects, education and skills. No indicator to explicitly measure changes in skill level is included. Skill audits would provide an indicator of the available and changing skill levels in the SRB area. The use of unemployment levels and GCSE passes assumes a final outcome of employment and entry for GCSE. The objective, however, is aimed at enhancing chances of employment and to improve on the education and skills regardless of whether the final outcome is employment or entry for GCSEs. One indicator which would provide a measure for improved job
opportunities is to gauge any positive changes in those looking for employment for example, invitation to interviews or securing a job. The selection of relevant educational baseline measures should therefore cover all key stages (KS) of compulsory education. National assessment data should be available for KS1 and KS2 for primary education, KS3 and KS4 for secondary education. These additional baseline indicators are needed to capture all intermediate changes and to establish changes in skill levels.
differences in pupil performance.
With respect to social disadvantage however, there is in regeneration theory a ready acceptance to link poverty with failure and in doing so, there is the danger of forgetting those pupils for whom the bitter experience of poverty and
deprivation is a stimulus to hard work and success. Social disadvantage should therefore be treated as a double-edged sword which in some pupils reproduces failure and yet in others success through hard work. The use of the blanket term ‘disadvantaged’ in the first objective hides the diversity of the causes and degree of disadvantage experienced by different groups of people in the community – a subject explored further below.
Where pupils attend schools outside the SRB area, it would be relevant to examine the numbers, reasons and household characteristics of such pupils. Other useful information would include attendance and exclusion measures as well as any other initiatives such as literacy/numeracy projects. For school focused initiatives, it would be desirable to explore their impact from the viewpoint of both the staff and pupils. Additional important evidence should also be sought by interviews with other stakeholders such as the Partnership, senior school managers and focus groups as has been used successfully elsewhere (Sammons and Taggart 1998). From 1998, all schools have been sent Autumn Package data and Panda reports which provide contextualisation of their performance and could prove a useful source of information from 1998 onwards. Given that the SRB scheme is now in its fourth year and where published data exists it will be necessary to collect data retrospectively for example, national assessment measures, Ofsted reports, school action plans, scheme inputs/output measures, school attendance/exclusion levels etc. In all this it must be borne in mind that the SRB has neither the powers nor the resources to transform the fundamental performance of the school system, especially in just a few years and it would be quite wrong to criticise it for failing to do this. However, these characteristics of schools and pupils are a crucial part of the overall situation and thus a necessary part of the study.
Strategic objectives 1 and 5 relate to the promotion of equality in employment opportunity by enhancing employment prospects, education and skills of the disadvantaged, and the promotion of initiatives which would benefit ethnic minorities among whom there is high unemployment. It is therefore important that the scheme monitors and evaluates the question of equity in the
educational outcomes by ethnic group in which evidence of under-achievement (but also excellence in some ethnic groups) exists (Gillborn and Gipps 1996; Ofsted 1999) and a growing concern about institutional racism highlighted by the Lawrence Inquiry (MacPherson’s Law Commission Report). Institutional effects on educational outcomes should be balanced with the subjects’ own input in influencing those outcomes. Care should be taken not to reduce students to passive objects who have no part to play in shaping their own lives – thus laying all blame on institutional structures (Mac an Ghaill 1999). With respect to objectives 1 and 5, all indicators (where possible) should be
An adequate baseline study would try to quantify the composition of the
unemployed and under-employed population and, through special surveys, the relative importance of the various barriers to employment.
3.2 Encourage sustainable economic growth and wealth creation by improving the competitiveness of the local economy, including support for existing businesses
The Partnership considers those activities which support investment in economic activity as crucial to the success of all aspects of regeneration objectives.
Businesses (including public sector enterprises, charities and non-profit bodies, of which King's Cross has a strong group) will tend to benefit from changes which lower their costs and from changes which increase their revenues. Either or both of these changes will improve their efficiency, enable them to compete better and, where relevant, make higher profits.
Many of these changes are national or regional trends (e.g. wage rates, interest rates etc). Locally-specific factors could include
negative (cost) factors like...
• premises costs (rents, UBR)
• any special local problems in recruiting or retaining staff • costs of crime or crime-prevention
• costs and inconvenience of parking, loading, access and positive (profit) factors including...
• accessibility for customers and staff
• benefits from co-location of activity- intensity of pedestrian flow etc • general reputation of the area as a destination
• attractive features of the buildings and the area - 'sense of place'
Figure 7 later in the report illustrates the relationships in some of these factors. While the area is still blighted, it will be difficult for certain businesses to locate or remain in the area, and also to attract tourists. Through physical
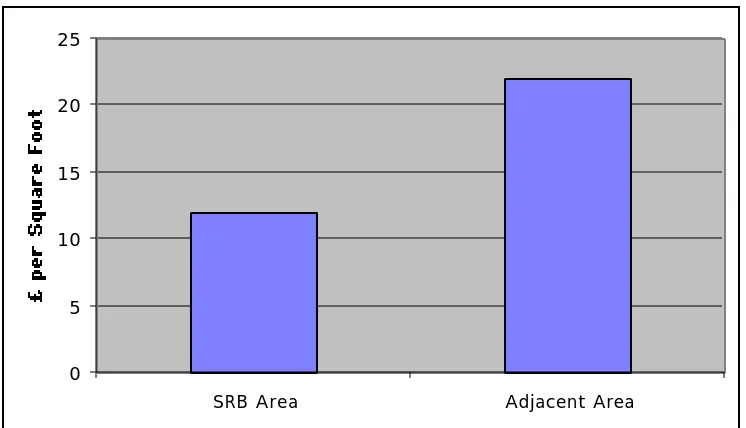
0 5 10 15 20 25
SRB Area Adjacent Area
Source : King’s Cross Challenge Bid Fund 1995
Existing baseline measures focus on commercial property rental values and vacancy rates as the only measures for economic growth and wealth creation. Vacancy levels are a reasonably good indicator of the level of activity. Rents, however, are not: high rents may indicate a growing pressure of demand relative to supply, but they are not of themselves a good thing since they represent higher costs for firms and can trigger some firms into moving away, and thus lead to the business version of 'gentrification' which has been so controversial in Covent Garden and parts of Docklands. The best outcome from a business activity point of view is to have the volume of activity expanding while unit costs (rents etc) remain competitively low.
If it succeeds, the scheme could well be a model of how to regenerate an area without displacing established residential and business communities. A local economy should not necessarily be construed as a homogeneous entity competing against another entity external to the locality. Additional indicators disaggregated at sector level would be useful in gauging the sustainability and competitiveness of the various sectors of the local economy. For example, high wage rates may make the SRB area a less profitable location for certain
industries but will promote others through increased disposable income.
Another indicator useful in determining the competitive edge of the bid area is to sample incoming investors' views on the bid area in relation to other areas open for their investment. Answers to the question on whether increased knowledge of the area influenced investment decisions are useful in gauging the potential benefits of ‘place marketing’.
enterprises in the area. Focus and the London Chamber of Commerce and Industry (LCCI) conduct periodic surveys which might also be helpful. The concepts of sustainability and competitiveness in strategic objective 2 embody characteristics with a potential to work against each other and have been counterpoised as rival goals ( Chatterton 1999). For example, improving accessibility through road building may improve the economic competitiveness of an area resulting in more jobs but it may also result in increased traffic levels and pollution. The government’s view of sustainable development is set out in four broad objectives (DETR 1998b):
• maintenance of high and stable levels of economic growth and employment;
• social progress which recognises the needs of everyone; • effective protection of the environment; and
• prudent use of natural resources.
The Partnership also regards environmental improvement as crucial to the sustainable growth and competitiveness of the local economy (Strategic Objective 3). The challenge for evaluation is to develop or select additional indicators to reflect the broad objectives of sustainable development so that gains made in one objective area do not hide losses in another. Because competitiveness is a relative measure, it will also be necessary to establish a baseline of similar indicators for other areas to be used as comparators. All of these indicators should be 'knitted together' in a periodic evaluation of the health of activity in the SRB area.
The effect of good transport networks on the competitive ability of the local economy in the scheme will need careful monitoring. It is hypothesized that:
Improving the transport facilities between two regions can be expected to be of the greatest economic benefit to that region which is inherently most efficient in producing and marketing products and services (Blonk 1979, cited by Cooper in Bruton 1984 : p155).
It is deduced from the above thesis that it is King’s Cross’ strength - by way of superb transport links - which makes it vulnerable to competition from other areas.
3.3 Protect and improve the environment and infrastructure and promote good design, mixed development and landscaping in line with the Secretary of State for the Environment’s Quality Initiative
poor urban fabric, blight and decay. For example, almost 7 kilometres of street furniture and an equivalent of 5 hectares of building façades and public areas were estimated to be needing improvement. A further characteristic is a
substantial amount of vacant or poorly used land - significantly the railway lands encompassing a total area of about 45 hectares, of which 20 hectares were available for redevelopment, with another 3 hectares in other areas. The challenge is to improve the physical conditions of the area so as to retain and open new development sites for inward investment.
Appropriate measures here are:
(a)physical measures of the condition of stock, and
(b)survey data on perceptions of the area’s quality among residents, businesses, visitors and potential investors.
3.4 Improve housing and housing conditions for local people through physical improvement, better maintenance, improved management and greater choice and diversity
Another aspect of physical regeneration is in the improvement of housing – an important social objective whose funding allocation at 17.5% of challenge funds is only surpassed by the funding for economic regeneration activities. The concentration of social housing in the SRB area is characteristic of most British Inner Cities. Some of the first London County Council flats can be seen at Churchway. Also represented is the work of many distinguished architects for example, Lubetkin. Many housing associations have also been active notably, the St Pancras Housing Trust at Somers Town. Notwithstanding the rich range of purpose-built flats, in small and large estates, local authority housing as in most inner city regeneration projects was described in the early 90s as poor and also associated with high levels of unemployment and crime related to drugs and prostitution. According to the Challenge Fund Bid (1995), 40-45% of housing belonging to the local authority and housing associations needed environmental or security repairs, and that 20% of local authority housing was managed by tenants as Tenants Management Organisations (TMOs). However, major investment from non-SRB sources has now transformed a number of these housing estates in both Boroughs.
Housing conditions in the private rental sector, although constituting only 10% of housing stock and mostly concentrated between Gray’s Inn and King’s Cross Roads and the north side of Pentonville Road, are some of the worst according to the 1991 Census.
King’s Cross presents a potentially superb opportunity for dense city centre living. Mixed use areas like this, with superb public transport, can offer a kind of housing opportunity much favoured by some –perhaps a growing number of – people across Europe. This sort of housing location can radically reduce dependence on cars, cutting car use and even the growth of car ownership. A survey of UK first-time home buyers found that 15% expressed a preference for city living. A desire to live close to shops and other services was also
expected international station at St Pancras will both add distinct new elements to the demand for housing.
If the aim were simply to enlarge and improve the housing stock, the challenge would be a simple one since market forces alone would probably bring this about. The challenge is a demanding one because of the need to upgrade conditions for existing people, provide new capacity for new people without displacing low-and middle-income residents. The aim should be to ensure a successful mix of development (private and social housing under various management structures and tenure mixed with commercial sites) so that the benefits of regeneration are not lost due to people relocating out of the area. Although the fourth strategic objective is aimed at the improvement of housing through greater choice, better management and maintenance, baseline
information only gives the level of public housing in need of improvement and the proportion under Tenant Management Organisations (TMOs) – one of the innovations to devolve housing management to the community. Local authority house waiting lists and house allocation policy will provide an index of changes in demand for public housing. While the number of homeless people provides a measure of housing need, account should be taken of the various reasons why people are on the streets so that adjustments are made for those who would otherwise be housed but for their choice to be on the streets.
No indication is given of the level of housing problems in private
accommodation within which the 1991 Census revealed a considerable level of deprivation (Edwards 1997). Equally there are no indicators to ‘measure’ better management or indeed to reflect the variety of tenure arrangements available in the SRB area. One contributing factor to the general disrepair of housing is overcrowding on which the baseline is again silent. Housing is linked to changing household structures and income levels.
The combined effect of all investments in the SRB area will tend to push property values up much faster than in London generally. Baseline indicators against which such improvements in value can be measured would provide a basis for estimating the windfall gain which could be retained within the area to secure the objectives of the Partnership. Changing house prices and rents are therefore a necessary baseline measure. As the SRB area gets regenerated (physical environment improves, blight and uncertainty are lifted, CTRL station opens, more job opportunities etc) the prognosis is of increasing pressure on the limited housing supply. Keeping resources within the SRB area will be even more important if only to boost the provision of a range of housing choices for the local population so that the regeneration impact is not lost by
physical condition of the area, the crowding and tenure arrangements and then supplement this with direct survey information on occupants and their
experiences, demographic and economic position and views on housing
arrangements, local facilities etc. Alongside this we need to maintain records of changes in rents and prices and housing benefit payments.
3.5 Promote initiatives of benefit to ethnic minorities
Baseline information on objective 5 is limited to unemployment levels and is inadequate as a datum for observing the impact of regeneration on minority groups. Although the Partnership’s theme on this objective ‘A place for all communities’ is inclusive, strategic objective 5 from which it derives is
concerned with the promotion of initiatives of benefit to ethnic minorities and therefore exclusive. We later briefly discuss some of the merits and demerits of targeted objectives. At 27% the ethnic minority groups represent a
considerable proportion of the population in the SRB area(King’s Cross Challenge Fund Bid 1995) and their exclusion limits the success of regeneration and poses a possible threat to social stability. Any group of people which feels left out can destroy the fabric and spirit of a community (A Community Vision 1999).
Unemployment is high among young people from ethnic minority groups. Although the ethnic minority groups in the scheme constitute a rich diversity of human resource, their participation in regeneration may be limited in so far as there is general exclusion of some of them from mainstream activity. Brownill and Darke (1998 : p6) similarly observe that ‘exclusion and inclusion have political dimensions and again these are mediated by race and gender’. Promoting initiatives of benefit to ethnic minorities is the Partnership’s stated fifth objective and it is therefore valuable that the Partnership has resolved that wherever possible, all baseline data are classified to reflect the ethnic
composition of the subjects. Arguing for the explicit inclusion of issues of race and gender in regeneration Brownill and Darke (1998 : p1) assert, ‘…the diversity of experience among the population in areas on the receiving end of policy must lead to diverse routes to regeneration’. The implication of this diversity in establishing baseline measures is that, within the SRB area, there will be different causes and experiences of issues related to employment, education, housing, business, health and safety etc which have to be taken into account. The disaggregation of baseline data by ethnicity is only one
dimension which objective 5 addresses and the subject of a critical review by Loftman and Beazley (1998).
According to the SRB bidding guidance, ethnic monitoring must be undertaken to look at the extent to which members of ethnic minority groups are receiving benefits from the challenge fund assisted activities.
While the Partnership is committed to equal opportunities targets within the other objectives, only 1% of the total challenge funding was allocated to specific projects aimed at addressing the needs of ethnic minorities (King’s Cross
to ethnicity, this is restricted to demography and unemployment only. A
repertoire of indicators are necessary to reflect ethnic factors in issues related to housing, education, business, politics, sport, etc and also to enable the
monitoring and evaluation of various initiatives aimed for the benefit of ethnic minority groups.
Specifically targeted objectives have advantages and disadvantages, Brownill and Darke (1998 : p10) observe that although targeting is important to
respectively keep and get ethnicity and gender on the regeneration agenda, ‘initiatives that only benefit one ethnic group can reinforce divisions, create resentment and attract the resistance of regeneration professionals’. The variety of ethnic minority groups therefore, poses a challenge for regeneration. Although race relations in the SRB area are reported by some to have been relatively good, tensions have sometimes arisen between different ethnic groups. These tensions may be worsened by regeneration objectives which target benefits to certain groups and not others. The Partnership needs to be aware of these problems and balance targeted and universal initiatives
depending on the issues involved. For example, with respect to empowerment and confidence building, Taylor (1995) argues that it might be more effective if individuals initially worked with people they can identify with. The relative distribution of power or access to power between different ethnic groups and hence the ability to influence regeneration varies between different
communities. The selection of appropriate baseline information will assist in observing the dynamics of power in the SRB area to identify which groups have influence and how that relates to outcomes.
The Partnership has decided to pay less attention to objective 5 as a distinct set of programmes and instead focus on ensuring that all programmes contribute to reducing disadvantage flowing from ethnicity.
3.6 Tackle crime and improve community safety
Economic decline, physical conditions of blight, poverty and selected crime tend to reinforce each other with the decline in the economy of the area being the probable trigger for this condition. As the economy declines, physical blight, poverty and crime set in further eroding business confidence in an area. That the SRB area has attracted drug users, dealers and suppliers and has had a high incidence of prostitution is in part explained by the opportunity presented by the presence of secluded and disused property, the availability of cheap hotel accommodation and the massive concentration of customers round the station.
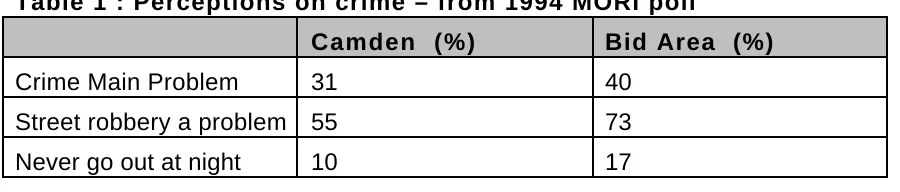
Camden wide. Finally, while only 10% of the borough wide population said they never went out at night, the proportion for the bid area was 17%.
Table 1 : Perceptions on crime – from 1994 MORI poll
Camden (%) Bid Area (%)
Crime Main Problem 31 40 Street robbery a problem 55 73 Never go out at night 10 17 Source : King’s Cross Challenge Fund Bid 1995
Figure 5 : Police Crime Figures
0 20 40 60 80 100 120
Drug arrests
Street robbery
Violence against person
Burglary
Bid Area Met Area
Source : King’s Cross Challenge Fund Bid 1995
Available benchmark indicators on crime are based on peoples’ perceptions and reported statistics and both make analysis difficult. For example,
perceptions of crime risks are different from actual risks. A survey of businesses and households about their fears of crime, may not be an accurate reflection of actual crime levels. On the other hand, crime statistics may be a useful indicator of the spatial variation in the incidence of reported crime, but they also fail to reflect the actual levels of crime due to a number of factors. For example, the level of reported crime is likely to be affected by the community’s attitude towards the police, itself dependent on the extent to which the community
expects to get help. In communities with little confidence in the police or judicial system, there might be a tendency for victims not to report crime. Cultural
influences will also determine which crimes are reported within particular communities or families. Unless perpetrators addresses are known, crime statistics only tell us that the offence was committed in the SRB area while the perpetrator may or may not be local. One should therefore not be quick to criminalise the local population. Policy and practice within the police force is yet another factor which affects crime statistics. Notwithstanding these
shortcomings, measures on the fear of crime and reported crime still constitute key baseline indicators and discussions with police statisticians are needed to clarify exactly what the figures mean.
3.7 Enhance the quality of life, health and capacity to contribute to regeneration of local people, including the provision of cultural and sports opportunities
The need for improved primary health care facilities, the high level of premature deaths and TB notifications and inadequate sports facilities were some of the key indicators used to define the baseline in relation to objective 7(King’s Cross Challenge Fund Bid 1995). While reiterating the need for improved health care facilities, the King’s Cross Delivery Plan (1999) also reports the lack of health care facilities specialising in the health problems and issues associated with drug users, prostitutes and homeless people. The Delivery Plan also reports that 60% of the people attending drug misuse facilities in Camden and Islington are not registered with a General Practitioner (GP) and that it is also generally a problem for people living in the bid area to register with a GP.
Crucial to achieving a long term transformation of the area is the involvement of the local communities. Baseline information asserts that this is hindered by the lack of effective mechanisms to harness the talents of 200 community
organisations in the bid area.
There are two quite distinct senses of ‘community’, both relevant to the Partnership’s work. In one sense the word simply refers to the citizens – the individuals – whether or not they are organised in groups or interact with each other. Members of ‘the community’ have rights to be heard, to participate, to benefit from public policy etc whether or not they are active. In the other sense ‘communities’ are the groupings of formal or informal kinds in which people may take part: friendship and family networks, tenants’ and residents’ associations, churches, political parties, lobby groups and so on. Only small proportions of people may be active in any one of these, and many will be active outside the local area. But the community groups are very important as a primary channel through which active citizens express their needs, creativity or fears, manage collective resources and interact with government.
The Partnership has invested in community development work to strengthen and support group activity and the effectiveness of this work will be observed as part of the study.
Strategic objective 7 on enhancing the quality of life is all-embracing and is connected to all other six objectives. A community’s quality of life is inextricably linked to their employment status which in turn is a factor of economic activity. The ambience of an area, safety and security, social facilities all play a part in determining the quality of life. The difficulty however is that ‘quality’ is a subjective measure whose definition is influenced by people’s varying experiences. It is therefore difficult to get a standardised measure across communities. At best one will be able to get a general profile of quality perceptions between different communities and over time.
4 Policy Mapping (Logic Diagrams)
The foregoing discussion poses a number of particular challenges for
monitoring and evaluation. There is baseline information on the profile of the area but it is not comprehensive. Of the available information, the bias is
towards universal quantitative measures masking the diversity of the community structure and experiences in the SRB area. Despite some valuable work by officers in the boroughs of Camden and Islington and the Partnership in gathering, and in some cases updating census, employment and other
statistics, the Partnership does not have adequate information (quantitative or qualitative) or analysis which the complex task of monitoring and evaluation needs.
Understanding the link between SRB activities, baseline indicators and
outcomes is crucial to a successful evaluation. It is often argued that indicators used in baseline information are inappropriate and the link between these and regeneration activities is not well understood. Baseline data for this scheme are patchy and in some cases fail to address the expected or desired objective. The present situation in the SRB area is a total outcome of the combined action of numerous factors, notably:
• decisions and uncertainties about the Channel Tunnel Rail Link (CTRL); • decision and uncertainties about Thameslink, LUL and other rail projects; • changes in planning policy and practice locally and more widely;
• changes in supply and demand conditions in London labour and property markets;
• changes in housing finance, policy and practice; and • changing macro-economic conditions.
Because of the strong synergy among the Partnership activities and outcomes, a particular kind of study is needed to attribute cause and effect to the greatest possible degree and we offer for discussion a series of ‘maps’ of these logical chains of cause and effect upon which the Partnership’s actions are implicitly or explicitly based. Analysis of this kind should, in our experience, help in:
• identifying gaps in the indicators which the Partnership is tracking;
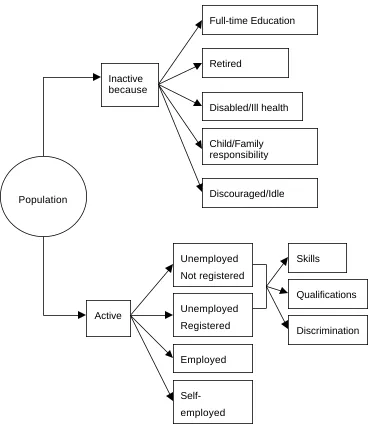
Figure 6 : Logic Diagram relating to objective 1- enhancing employment
Figure 6 illustrates that in terms of economic activity, the population can be subdivided into those that are active and inactive. A variety of reasons may account for people’s economic inactivity as illustrated. Although people may be economically active and therefore available for work, there will still be those who remain unemployed for a variety of reasons while others are in
employment or self-employed. The focus for policy as well as many other
Population
Inactive because
Full-time Education
Retired
Disabled/Ill health
Child/Family responsibility
Discouraged/Idle
Active
Unemployed
Not registered
Employed
Self-employed Unemployed
Registered
Skills
Qualifications
at the expense of other groups.
Figure 7 : Logic Diagram relating to objectives 2 and 3
-sustainable economic growth, environment and infrastructure.
(Other combinations possible too)
The central objective to the regeneration programme in King’s Cross is to reverse the economic decline of the area and to attract new investment by improving the environment, upgrading the transport system and tackling crime. The net effect of all these activities is that some existing firms will benefit from these improvements while others will lose out. As the place regenerates, it will attract more upmarket firms leading to rising rents, rates, tighter parking control and rising wages. These will exert a financial burden on those firms that have benefited from cheap space and low wages and may force these to contract,
Place
Business operating costs fall
Business revenues rise
Business contracts, fold up, or move away Business
operating costs rise
Business revenues fall
Business grows locally, moves away, or creates jobs New firms set up
Physical Attraction
Less Crime
Better Transport
fold up or relocate, while other firms survive, growing locally or moving away depending on whether they can compete in the new conditions of King’s Cross.
5 Findings, Proposals, and priorities for action
Our main finding from a quick initial study of the baseline for King's Cross is that the SRB bid was not based on any systematic analysis or account of the
characteristics, the dynamics, the potential and the needs of the area in the mid-90s. It was based on an assembly of projects and desirable policies with
relatively little research backup. Furthermore the research backup material based on the 1991 census and other available data which was prepared when the Partnership started work seems not to have been much disseminated or used.
Based on a detailed analysis of several logic diagrams (see section 4 for a few examples) each relating to one or more strategic objective, a set of baseline indicators are proposed to supplement those output measures proposed by the DETR for the monitoring and evaluation of SRB projects. The strong inter-relationships between the strategic objectives and outcomes means that some indicators are likely to be used as measures for more than one objective. Instead of linking indicators to specific objectives with the risk of repetition, we have opted to present these in sets linked to broad themes, though they have been discussed objective-by-objective in the main text.
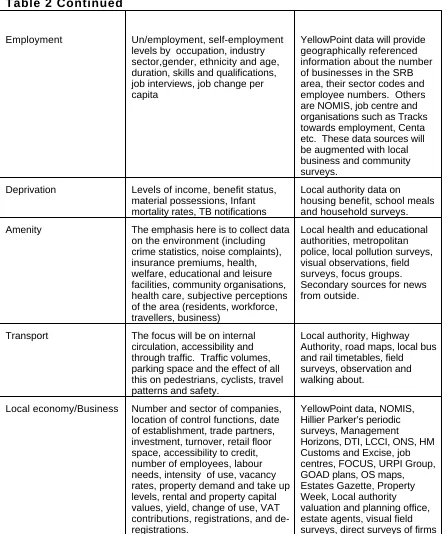
Table 2: Proposed baseline indicators
TOPIC DATA REQUIREMENTS SOURCES OF INFORMATION
Demography Population level and ethnic and
gender mix, household structure, age groups
Although of limited present currency, 1991 census data forms the core of most baseline data supplemented by local authority information, field surveys and mover tracking.
Education and Skills National KS1-KS4 attainment, GCSEs, number of school-going children, number of schools, staff turnover, literacy and numeracy scores, pupil mobility, eligibility for free school meals, exclusions, attendance, pupil
dissatisfaction,further or higher education, skills training, Adult experiences
Housing Tenure, internal facilities,
overcrowding, state of repair, rent levels, arrears, waiting list, transfer requests, council tax, housing benefit, council tax rebates, house prices, mortgage rates, house sales, period of residence, homeless people
Table 2 Continued
Employment Un/employment, self-employment
levels by occupation, industry sector,gender, ethnicity and age, duration, skills and qualifications, job interviews, job change per capita
YellowPoint data will provide geographically referenced information about the number of businesses in the SRB area, their sector codes and employee numbers. Others are NOMIS, job centre and organisations such as Tracks towards employment, Centa etc. These data sources will be augmented with local business and community surveys.
Deprivation Levels of income, benefit status,
material possessions, Infant mortality rates, TB notifications
Local authority data on
housing benefit, school meals and household surveys.
Amenity The emphasis here is to collect data
on the environment (including crime statistics, noise complaints), insurance premiums, health, welfare, educational and leisure facilities, community organisations, health care, subjective perceptions of the area (residents, workforce, travellers, business)
Local health and educational authorities, metropolitan police, local pollution surveys, visual observations, field surveys, focus groups. Secondary sources for news from outside.
Transport The focus will be on internal
circulation, accessibility and through traffic. Traffic volumes, parking space and the effect of all this on pedestrians, cyclists, travel patterns and safety.
Local authority, Highway Authority, road maps, local bus and rail timetables, field surveys, observation and walking about.
Local economy/Business Number and sector of companies, location of control functions, date of establishment, trade partners, investment, turnover, retail floor space, accessibility to credit, number of employees, labour needs, intensity of use, vacancy rates, property demand and take up levels, rental and property capital values, yield, change of use, VAT contributions, registrations, and de-registrations.
YellowPoint data, NOMIS, Hillier Parker’s periodic surveys, Management
5.1 Priorities for action
In our judgement it would be a waste of the resources available to go to the great length necessary to build the baseline picture for 1995/6 when the
Partnership started work. Only on a very few variables do we consider that data would be readily available. Otherwise elaborate and costly retrospective
surveys would be required and with limited chances of success.
On the other hand the lack of any integrated account of local conditions in the early 90s is a very serious gap, making it almost impossible to evaluate how conditions have changed and limiting our understanding of the extent to which this project links up to the past. Accordingly we propose to pursue the following priorities in the coming months:
1. To write a short account of social, business and environmental conditions in the scheme in the early 90s, drawing on data already available in the baseline, other census, official and research data.
Otherwise, to stick to our original workplan which provides for:
2. meetings with key actors in the public, private and voluntary sectors, from December 1999 to March 2000. This process will generate some new information to extend and enrich the 1999/2000 baseline.
3. preparing for survey work we shall be doing in the spring and summer of 2000. Within this we plan to prioritise:
(a)Households and what they can tell us about their economic and social position, housing and employment experiences and needs;
(b)enterprises (including businesses, public and non-profit employers) in the area, and what we can learn from them about their experiences, especially their labour market practices and their property and property-market experience; and
(c) schools and what we can learn from them and their members.
References
A Community Vision, 1995. Thames Gateway London Community Network
and Docklands Forum.
Blonk, W. A. G. (Ed.), 1979. Transport and Regional Development : An
International Handbook. Saxon House, Aldershot.
Brownill, S and Darke, J., 1998. ‘Rich Mix’ – Inclusive strategies for urban
regeneration. The Policy Press and the Joseph Rowntree Foundation.
Bruton, M. J., 1984. (Ed.), The Spirit and Purpose of Planning, Second
Edition. Hutchinson, London.
Chalmers, L. 1997. King’s Cross : Past, Present and Future. . pp.13-17. Vision for London.
Chatterton, P. 1999. Urban and Regional Regeneration Bulletin. Website
http://curdsweb1.ncl.ac.uk/urb/ default.asp Dated 15 October 1999.
DETR, 1998a. SRB Challenge Fund Guidance Manual. London.
DETR, 1998b. Sustainability Counts – A Consultation paper on a set of
‘headline’ indicators of sustainable development.
Cooper, B., 1984. Transport Planning, in Bruton (1984), pp.151-169.
Edwards, M., (1998) 'Impact and cost benefit analysis' in Urban
Regeneration: evaluation as a tool for policy development Eds. S. Aaronovitch and T. Agethangelou. London, Local Economic Policy Unit (LEPU) of South Bank University,
Gillborn, D. and Gipps, C., 1996. Recent Research on the Achievements of
Ethnic Minority Pupils. London, HMSO
Loftman, P. and Beazley, M., 1998. Race and Regeneration : A review of
the SRB Challenge Fund, London.
Mac an Ghaill, M., 1999. Ethnicity, Social class and schooling. Philip Allan Updates Conferences. A-Level Sociology Conference held in Westminster Central Hall, London, on Wednesday 1 December 1999.
Ofsted, 1999. Raising the attainment of minority ethnic pupils. London :
Central Office for Information.
Pacione, M. 1990. Urban Problems : An applied Urban Analysis. Routledge,
London.
Robson, B. et al., 1994. Assessing the Impact of Urban Policy. Inner Cities
Research Programme, HMSO, London.
Parkes, M. 1990. King’s Cross Railway Lands. King’s Cross Railway Lands
Group.
Sammons, P. and Taggart, B. 1998. Making Belfast Work : Raising
Streiner, D. L. and Norman, G. R. 1989. Health Measurement Scales – A
practical guide to their development and use. Oxford University Press.
Taylor, M. 1995. Unleashing the potential : Bringing residents to the centre of
regeneration. York, Joseph Rowntree Foundation.
Thorne, R.. 1997. The History of the King’s Cross Area, in Vision for London,