Predicting Consumer Behaviour in Digital
Market: A Machine Learning Approach
Adebola Orogun1, Bukola Onyekwelu2
Lecturer, Adekunle Ajasin University, Akungba-Akoko. Ondo State. Nigeria.1 Lecture, Elizade University, Ilara-mokin. Ondo State. Nigeria.2
ABSTRACT: In recent times, customer behaviour models are typically based on data mining of customer data, and each model is designed to answer one question at one point in time. Predicting customer behaviour is an uncertain and difficult task. Thus, developing customer behaviour models requires the right technique and approach. Once a prediction model has been built, it is difficult to manipulate it for the purposes of the marketer, so as to determine exactly what marketing actions to take for each customer or group of customers. Despite the complexity of this formulation, most customer models are actually relatively simple. Because of this necessity, most customer behaviour models ignore so many pertinent factors that the predictions they generate are generally not very reliable. This paper aims to develop an association rule mining model to predict customer behaviour using a typical online retail store for data collection and extract important trends from the customer behaviour data.
KEYWORDS: Association rule mining, Apriori, digital market, consumer behavior, Machine learning.
I. INTRODUCTION
Digital marketing is the marketing of products or services using digital technologies, mainly on the Internet, which includes mobile phones, display advertising, and any other digital medium(Parsons et al., 1998), (Jerry et al.2002). This term is mostly referred to data-driven marketing. Currently, digital marketing has changed the way brands and businesses use technology for marketing. As digital platforms are increasingly incorporated into marketing plans and everyday life, and as people use digital devices instead of visiting physical shops, digital marketing applications are becoming more prevalent and efficient (Yasmin et al. 2015), (ige et. Al 2019). Digital marketing techniques such as search engine optimization (SEO), search enginemarketing (SEM), influencer marketing, content automation, campaign marketing, etc have been greatly researched on in literature. Consumers are constantly connected digitally all the time, through their smart devices, tablets, gaming consoles and every application, service and channel accessible through these devices. Retail banks use big data analytics for fraud prevention. Big data analytics is the process of examining large and varied data sets (big data) to uncover hidden patterns, unknown correlations, market trends, customer preferences and other useful information that can help organizations make more-informed business decisions. Chen et al. (2014) refer to big data as the ever-increasing data deluge in terms of volume, variety, velocity and complexity that is being generated in today’s digital eco-system. Big data sets are generated around customers based on their online purchase behaviour, website clicks, social media activities log, smart connected devices, geo-location attributes, etc. Sophisticated analytics solutions for big data provide new approaches to addressing some of the key marketing imperatives and delivering impressive results. (Sagiroglu et al. 1998).
format, to either inform or prepare data for further analysis (EMC Education Service, 2015). It uses two primary techniques, namely data aggregation and data mining to report past events. It presents past data in an easily digestible format for the benefit of a wide business audience. Descriptive Analytics helps to describe and present data in a format which can be easily understood by a wide variety of business readers. As data-driven businesses continue to use the results from Descriptive Analytics to optimize their supply chains and enhance their decision-making powers, Data Analytics will move further away from Predictive Analytics towards Prescriptive Analytics or rather towards a ―mash-up of predictions, simulations, and optimization. Customer behaviour modelling identifies behaviours among gro―mash-ups of customers to predict how similar customers will behave under similar circumstances. This paper is geared towards solving this modelling problem of predicting customer behaviour across digital platform. Customer Behaviour Modelling is the formulation of a mathematical construct to represent the common behaviours observed among particular groups of customers in order to predict how similar customers will behave under similar circumstances. Customer behaviour models are typically based on data mining of customer data, and each model is designed to answer one question at one point in time (Tadajewski 2009, Sheth 1985, Fullerton 2013). The large amount of data is a key resource to be processed and analyzed for knowledge extraction that enables support for cost-savings and decision making. Data mining brings a set of tools and techniques that can be applied to processed data to explore hidden knowledge or patterns in data. This hidden knowledge provides personnel with decision support for making sensitive decisions. The prime goal of the data mining process is to extract information from a data set and transform it into an understandable structure for further use (Fayyad et al.1996). For an expression given as;
x
f
y
(eqn 1)wherex (set of independent variables) and observed y (dependent variable).
Data mining provides information about the nature of f. The parameter ―x‖ can be seen as customer attributes or
behaviour while ―y‖ represents the trends between attributes respectively. Data mining tells how ―x‖ is related to ―y‖. Data mining find key dimensions in Health care, Customer relationship management and Fraud or Anomaly detection (Koh et al. 2005). Association Rule Mining (ARM), one of the common tasks of data mining, is a fundamental data mining technique that exhaustively looks for hidden patterns in large datasets. An association rule (AR) is a pair (X, Y) of sets of attributes, denoted by X → Y, where X is the antecedent and Y is the consequent of the rule X → Y. The rule states that if X happens, then Y does happen (Han et al. 2007). Association rule mining aspires to obtain out motivating correlations, recurrent patterns and relations among sets of items in the operation databases. They are interpretable, and suggest interactions between risk factors. This paper seeks to solve customer behaviour prediction problem using association rule mining via analysis using Apriori algorithm. The performance evaluation of these algorithm on customer behavior obtained will be carried out.
II. LITERATURE REVIEW
analytics. A range of recently published research literature on business intelligence (BI); predictive analytics; and data, text and web mining is reviewed to explore their current state, issues and challenges learned from their practice. In
Gupta et al.(2012), analysis of customer behaviour using data mining techniques was carried out. Achieving customer satisfaction is no longer satisfied with a simple listing of marketing contacts, but wants detailed information about customers, past purchase as well as prediction of future purchases. This paper discusses a business and technological overview of data mining and outline how to optimize Customer profitability through data mining application, along with sound business processes and complement technologies, data mining can reinforce and redefine Customer relationship. In Nejad, et al.(2012), data mining techniques was used to increase efficiency of customer relationship management (CRM) process. This study shows that it is possible to improve CRM efficiency, to have an effective and rapid response to customer needs, by integrating CRM and data mining techniques. Thus in achieving this, the authors investigate major concepts of CRM and data mining in this study. The authors believe that using data mining techniques in CRM can improve CRM's efficiency. Using data mining organizations can identify the customer's data patterns. So, it enables the business owners to better offer of their services and products. Tiagoet al.(2014) did a study on digital marketing and social media. Currently, a significant portion of the associated research is focused more on the customer than on the firm in light of digital marketing. This study adopts the perspective of the firm to facilitate an understanding of digital marketing and social media usage as well as its benefits and inhibitors. To redress the shortcoming of over reliance on customer behaviour than the firm, this study adopts the perspective of the firm to facilitate an understanding of digital marketing and social media usage as well as its benefits and inhibitors. In Leeflang et al.(2014), Challenges and solutions for marketing in a digital era was presented. A great deal of attention has been focused on the tremendous opportunities digital marketing presents, with little attention on the real challenges companies are facing going digital. In this study, the authors present these challenges based on results of a survey among a convenience sample of 777 marketing executives around the globe. Haastrup et al. (2014) presented Customer Behaviour Analytics and Data Mining. Through analysis of customers’ behavior, accurate profiles are being generated by specifying needs and interest and allowing business to give customers what they want it, when they want, leading to a better customer satisfaction thereby keeping them to come back for more. While large-scale information technology has been evolving separate transaction and analytical systems, data mining provides the link between the two. The paper makes a comparative study of
Association Rule Mining, Rule Induction Technique and Apriori Algorithm in market base analysis.
III. METHODOLOGY
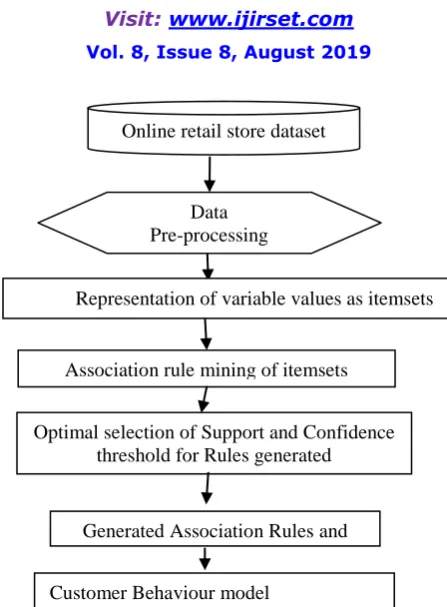
Figure 1: Customer behaviour prediction model using rule mining approach architecture.
Dataset Description
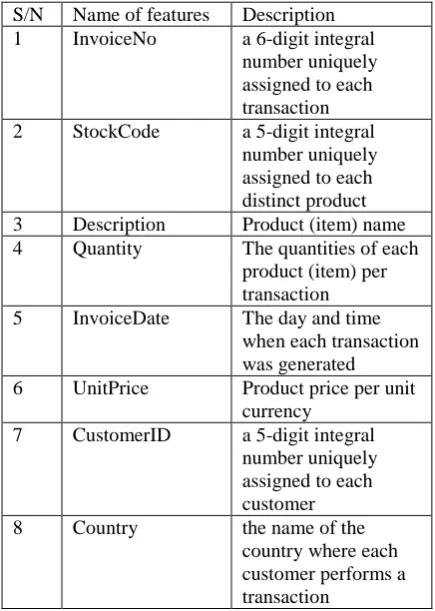
The dataset is a structured transnational data set which contains all the online customer transactions occurring between 01/12/2010 and 09/12/2011 for an international based and registered non-store online retail. The company mainly sells unique all-occasion gifts. Many customers of the company are wholesalers. The online retail purchase data has customer behaviour data with 8 attributes that have both continuous and symbolic attributes. The first attribute invoice number holds nominal value, a 6-digit integral number uniquely assigned to each transaction. If this code starts with letter 'c', it indicates a cancellation. The second attribute is stock code describing the product (item) code. It holds nominal value, a 5-digit integral number uniquely assigned to each distinct product. The third gives the description of product (item) name while the fourth is the quantity of purchase of each item per transaction. The fifth attribute is the invoice date and time of each transaction. Unit price: which is the product price per unit price is the sixth attribute. The seventh attribute is the Customer ID or Customer number, a 5-digit integral number uniquely assigned to each customer. The last attribute holds the name of Country where customer resides.Table 1 shows the different behavioural features.
Data Pre-processing
Association rule mining of itemsets
Customer Behaviour model
Optimal selection of Support and Confidence threshold for Rules generated
Generated Association Rules and Patterns
S/N Name of features Description 1 InvoiceNo a 6-digit integral
number uniquely assigned to each transaction 2 StockCode a 5-digit integral
number uniquely assigned to each distinct product 3 Description Product (item) name 4 Quantity The quantities of each
product (item) per transaction 5 InvoiceDate The day and time
when each transaction was generated 6 UnitPrice Product price per unit
currency 7 CustomerID a 5-digit integral
number uniquely assigned to each customer 8 Country the name of the
country where each customer performs a transaction
Table 1: Online retail store transaction dataset description
Data pre-processing
The dataset has 3 numeric and 8 nominal data type. All data fields are converted to uniform format which is numeric for efficient analysis. Feature selection is an important step in the pre-processing stage. The feature selection method used is the Filter method.
After the uniform representation of the variables as numeric values, feature selection process will be carried out on the input variables to investigate significance of the input variables to the output. The feature selection technique to be used is the correlation coefficient analysis as shown in equation below.
2 2 2 2
* *
B B n V V n
B V B V n r
i i
i
i (eqn 2)
Where r = Pearson correlation coefficient, Vi is variable (attribute) state value, B is target behaviour of the customer, n
is total number of transactions (data points) in the data.
Analysis of algorithms
Finding interesting and rare patterns in the dataset is based on association analysis. Association analysis is a set of tools used to find valuable relationships in a large set of data. This analysis is based on Apriori principle which states that ―if an itemset is frequent, then all of its subsets are frequent‖. Association rules suggest that a strong relationship exists between two items. An illustration is shown with an example in table extracted from the raw data. The association rule is a pair (X, Y) of sets of symptoms defined as;
Y
The rule states that if the set of customer behaviour feature(s) on the antecedent part (X) occurs, then the behaviour states on the consequent part (Y) does happen. In general, a set of behaviour feature items, such as X or Y, which are disjoint, is the behavior feature item set. In table 2,a hypothetical six rows table of 7 features is shown.
S / N
Behaviour Features item set
0 1 1 2 1 3 7 1 4 8 1 1 2 1 2 2 1 3 2 1 4 1 1 5 3 1 6 1 1 7 1 1 8 1 1 7 1 2 4 1 1 1
1 2 3 3 5 1 4 8 1 1 2 1 2 1 1 3 2 1 4 3 1 5 3 1 6 1 1 7 1 1 8 1 1 7 2 2 4 1 2 1
1 2 1 3 3 1 4 1 1 1 1 1 2 3 1 3 1 1 4 1 1 5 2 1 6 2 1 7 1 1 8 1 1 7 3 2 4 2 3 1
1 2 3 3 4 1 3 7 1 1 3 1 2 1 1 3 2 1 4 2 1 5 2 1 6 1 1 7 1 1 8 1 1 7 2 2 4 1 4 1
1 2 2 3 3 1 3 4 1 1 2 1 2 3 1 3 1 1 4 2 1 5 4 1 6 1 1 7 2 1 8 2 1 7 3 2 4 2 5 1
1 2 2 3 3 1 3 4 1 1 3 1 2 1 1 3 2 1 4 3 1 5 3 1 6 2 1 7 1 1 8 1 1 7 1 2 4 1 Table 2: Sample table of processed online store dataset
Frequent items sets are lists of items (feature values) that commonly appear together. For instance, from Table 3.3 some frequent items are {11}, {11,132}, {11,161}, {171,11}, {171,181}, {11, 241}, {181,241}. From the sample list an association rule such as 171
181 can be found. This means that if network feature item 132 occurs then there is a good chance of having 11 present. There are two most important of concepts used to select frequent items, namely support and confidence. The support of an itemset is the percentage of the dataset that contains this itemset.From table 2, the support of {11} is 6/6. The support of {171,11} is 5/6 because of the six records, four contained both 11 and 171. Support applies to an itemset, so a minimum support can be defined and only the itemsets that meet that minimum support are gotten. The confidence is defined for an association rule like {171}
{11}. The confidence for this rule is defined as support({171,11})/support({11}). From table 3.3, the support of {171, 11} is 5/6. The support for item 1 is 6/6, so the confidence for features 171
11 is 5/6 = 0.8333. That means that approximately 83% of the items in the sample dataset containing feature 11 and 171, the rule is correct.Apriori algorithm
meeting the minimum support level will be removed. This procedure will be repeated until all sets are pruned out. Generation of the patients’ itemsets is carried out by setting a function to create an initial set, and scan the dataset looking for items that are subsets of transactions. Steps for scanning the dataset are described as;
Listing 1: Apriori algorithm
Step 1: While the number of customer attribute items in the set is greater than 0: Step 2: Create a list of customer attribute itemsets of length k
Step 3: Scan the dataset to see if each customer attribute itemset is frequent Step 4: Keep frequent attribute itemsets to create itemsets of length k+1
The step 3 (Scan dataset) in Algorithm 1 which is an iterative process is further describes as;
For each transaction in tran the dataset: For each customer attribute itemset, cus: Check to see if pat is a subset of tran If true, increment the count of cus For each customer attribute itemset:
If the support meets the minimum, keep this item Return list of frequent attribute itemsets
Association Rules Generation and Patterns
In generating the association rules and network behaviour patterns, an itemset is quantified as frequent if it meets minimum support level. There is a unique measurement for association rules. This measurement is called the confidence. Optimal selection of support and confidence threshold is done to achieve efficient mining results. Confidence (C) of the rule (X → Y) is the percentage of records in a dataset containing X that also contain Y and is defined by;
X
Y
X
Y
X
conf
sup
sup
(eqn 4)The property of association rules is used to reduce the number of rules.
Association Rule Base Syntax
This stage describes the integrity constraints imposed on a dataset for the generation of frequent itemsets and association rules. The rules generated from the frequent pattern mining describe the network behaviour (either normal or malicious attack) of the network. The rules are generated from frequent itemset mining algorithm. Schemas are defined for each frequent itemset and association rule generated. Let,
L[ ]: [fronzenset([ ])], [support] (eqn 4)
Equation (4) is the conforming frequent itemset schema, where L[ ] is the list number, fronzenset( ) is the list of frozen frequent itemsets and [support] is the support value of each list of frozen frequent itemset.
For Example:
L[0]:[frozenset([item]),..., frozenset([item])], [support]
L[1]:[frozenset([item1,item2]),..., frozenset([item 1, item 2])], [support]
L[2]: [frozenset([item 1, item 2, item 3]), ..., frozenset([item 1, item 2, item 3])], [support]
Thus,
L[n]: [frozenset([item 1,.., item n+1]), ..., frozenset([item 1,.., item n+1])], [support]
Also let,
Equation (5) is the conforming association rules schema, where R[ ] is the Rule number, fronzensetX( ) is the list of frozen itemsets on the antecedent part, fronzensetY( ) is the list of frozen itemsets on the consequent part and conf: (value) is the confidence threshold of each rule.
IV. RESULTS
The implementation of the model is done in Python development environment. Python is a great language for data mining applications because it has clear syntax and easy to implement big data analysis requiring large datasets. Another rationale for choice of this tool is that Python also has an interactive shell, which allows for viewing and inspection of elements during implementation. The model evaluation is carried out based on execution time and generated association rules.
Finding Frequent Itemsets implementation
The implementation of the frequent itemsets is carried out using apriori algorithm. The algorithm needs a minimum support level and a data set as input. The algorithm generates a list of all network feature itemsets with one item. The transaction data set is then be scanned to see which itemsets meet the minimum support threshold. For generating frequent pattern itemset, some helper functions are created prior to implementing the algorithm. This helper functions will create an initial set and scan the dataset searching for items that are subsets of transactions in the database. A file is created using the Python IDLE and saved as apriori.py, the following code snippet is entered. An implementation using a simple sample of a hypothetical dataset ([11, 13, 14], [12, 13, 15], [11, 12, 13, 15], [12, 15]) from the big dataset will be used in the preceding steps for purpose of easy illustration.
Listing 2
fromnumpy import * defloadDataSet():
return [[11, 13, 14], [12, 13, 15], [11, 12, 13, 15], [12, 15]] def createP1(dataSet):
P1 = []
for transaction in dataSet: for item in transaction: if not [item] in P1: P1.append([item]) P1.sort()
return map(frozenset, P1) defscanD(D, Pk, minSupport): ssCnt = {}
fortid in D: for pat in Pk: ifpat.issubset(tid):
if not ssCnt.has_key(can): ssCnt[pat]=1 else: ssCnt[pat] += 1
numItems = float(len(D)) retList = []
supportData = {} for key in ssCnt:
support = ssCnt[key]/numItems if support >= minSupport: retList.insert(0,key)
supportData[key] = support returnretList, supportData
created and a scan is carried out in the dataset to see if these one itemsets meet the specified minimum support requirements. The itemsets that meet the minimum requirements become L1. Then L1 gets combined to become P2 and P2 will get filtered to become L2.
Filtering out the sets is implemented in the following code snippet as shown in listing 3.
Listing 3:
defaprioriGen(Lk, k): #creates Pk retList = []
lenLk = len(Lk) fori in range(lenLk): for j in range(i+1, lenLk):
L1 = list(Lk[i])[:k-2]; L2 = list(Lk[j])[:k-2] L1.sort(); L2.sort()
if L1==L2: #if first k-2 elements are equal retList.append(Lk[i] | Lk[j]) #set union returnretList
defapriori(dataSet, minSupport = 0.5): P1 = createP1(dataSet)
D = map(set, dataSet)
L1, supportData = scanD(D, P1, minSupport) L = [L1]
k = 2
while (len(L[k-2]) > 0): Pk = aprioriGen(L[k-2], k)
Lk, supK = scanD(D, Pk, minSupport) #scan DB to get Lk supportData.update(supK)
L.append(Lk) k += 1
return L, supportData
The code snippet in listing 3 contains two functions:apriori() and apriori(). The main function is apriori() which calls aprioriGen() to create network feature itemsets: Pk. The function aprioriGen() takes a list of frequent itemsets, Lk, and the size of the itemsets, k, to produce Pk. For example, it will take the itemsets {0}, {1}, {2} and produce {0,1} {0,2}, and {1,2}.
The apriori() function takes up a dataset and a support number to generate a list of customer behaviour feature itemsets. This works by first creating P1 and then taking the dataset and turning that into D, which is a list of sets. The map function is used to map set() to every item in the dataSet list. Next, the scanD() from listing 4.1 is called to create L1 and placed inside a list, L. List L will contain L1, L2, L3,..., Ln. Subsequent lists, L2, L3,..., Ln is fetched using the ―while‖ loop which creates larger lists of larger itemsets until the next-largest itemset is empty.
Setting support of 70% (0.7) generates four frozensets after the preceding command is entered in the Python shell.
Association Rules Mining implementation
Similar to frequent itemset generation in the previous stage, association rules are generated for each frequent itemset. If a rule doesn’t meet the minimum confidence requirement, then subsets of that rule also won’t meet the minimum. This property of association rules is used to reduce the number of rules under review. First, frequent itemset is found. Next is the creation of list of sets with one item on the right-hand side and test. Then, the remaining rules are merged to create a list of rules with two items on the right-hand side. This sort of approach is known as level-wise. The following code snippet which implements the mining of rules is added to fpgrowth.py file.
Listing 4:
defgenerateRules(L, supportData, minConf=0.7): bigRuleList = []
forfreqSet in L[i]:
H1 = [frozenset([item]) for item in freqSet] if (i> 1):
rulesFromConseq(freqSet, H1, supportData, bigRuleList, minConf) else:
calcConf(freqSet, H1, supportData, bigRuleList, minConf) returnbigRuleList
defcalcConf(freqSet, H, supportData, brl, minConf=0.7): prunedH = [] #create new list to return
forconseq in H:
conf = supportData[freqSet]/supportData[freqSet-conseq] #calculates confidence ifconf>= minConf:
print (freqSet-conseq,'-->',conseq,'conf:',conf) brl.append((freqSet-conseq, conseq, conf)) prunedH.append(conseq)
returnprunedH
defrulesFromConseq(freqSet, H, supportData, brl, minConf=0.7): m = len(H[0])
if (len(freqSet) > (m + 1)): #further merging
Hmp1 = aprioriGen(H, m+1) #create Hm+1 new netwk-feature set Hmp1 = calcConf(freqSet, Hmp1, supportData, brl, minConf) if (len(Hmp1) > 1): #need at least two sets to merge
rulesFromConseq(freqSet, Hmp1, supportData, brl, minConf)
The code snippet in listing 4 contains three functions. The function, generateRules(), is the
main command, which calls rulesFromConseq() and calcConf(). The other two functions, rulesFromConseq() and calcConf(), generate a set of network feature rules and evaluate those rules, respectively. The generateRules() function takes three inputs: a list of frequent itemsets, a dictionary of support data for those itemsets, and a minimum confidence threshold.
Performance Analysis
In this research, three evaluation criteria are used due to their widespread relevance in most related literature. They include number of frequent itemsets, rules generated, and execution time (in seconds). Figure 2 shows the chart of number of frequent itemsets against minimum support.
The chart in Figure 2 shows a decrease in total number of frequent itemsets mined as minimum support threshold is increased. A sharp decline was recorded from a support of 0.1 to 0.2 and gradually declined up to 0.3 threshold. The curve almost ran parallel to the horizontal axis from a support of 0.4 to 1. Figure 3 shows a chart of number of association rules mined based on minimum confidence thresholds (from 10% to 100%) respectively.
Fig. 3: Chart showing number of customer behavioural rules mined based on minimum confidence thresholds It can be observed that the mined rules trend is a negatively sharp declining slope curve. At confidence threshold of 30% to 100%, no mined rule was recorded. Highest number of rules mined is generated at minimum confidence threshold of 10% to 20%. This shows that as the confidence level is increased, optimal rule mining occurs thereby producing strong rules with efficient confidence. The strongest rules have rule confidence of approximately 100%.
V. CONCLUSION
This paper was able to identify frequent itemsets customer behaviour features patterns and mining association rules between frequent purchase behaviour on an online store.The results from the frequent pattern mining shows that optimum rule generation occurred at minimum support and confidence thresholds of 0.1 and 0.2.
This paper was able to design and implement a of association rule mining model for customer behaviour prediction. It discovered interesting frequent customer behaviour purchasing patterns that occurred in the online retail store dataset and mined strong association rules. The performance of this model is greatly affected by the quality and dimensionality of the dataset used and nature of feature set. Overall optimum performance of the model is peaked at minimum support and confidence thresholds of 0.1 and 0.2 respectively.
REFERENCES
1. Bose, R. (2009). Advanced analytics: Opportunities and challenges. Industrial Management & Data Systems 109(2):155-172. DOI: 10.1108/02635570910930073
2. Chen, M., Mao, S. & Liu, Y. (2014). Big Data: A review. Mobile NetwAppl, Mobile Networks and Applications, Springer-Verlag New York, Inc. Secaucus, NJ, USA. Volume 19 Issue 2, Pages 171-209 DOI 10.1007/s11036-013-0489-0
3. Eichinger, F., Nauck, D.D., &Klawonn, F. (2006). Sequence Mining for Customer Behaviour Predictions in Telecommunications.for marketing in a digital era. European Management Journal, 32(1),pp 112. https://doi.org/10.1016/j.emj.2013.12.001
4. EMC Education Service (2015). Data Science Big Data Analytics: Discovering, Analyzing, Visualizing and Presenting Data Published by John Wiley Sons, Inc. ISBN: 978-1-118-87613-8, January 2015, 432 Pages
5. Fayyad, U., Piatetsky-Shapiro, G. and Smyth, P. (1996) From Data Mining to Knowledge Discovery: An Overview. In: Advances in Knowledge Discovery and Data Mining, AAAI/MIT Press, Cambridge.Pp 37-5
7. Gupta, G. & Aggarwal, H. (2012). Improving Customer Relationship Management Using Data Mining. International Journal of Machine Learning and Computing, Vol. 2, No. 6, December 2012. Pp 874-878
8. Haastrup, A. V., Oladosu, O. A., Okikiola, F. M., Oladiboye, O. E., &Ishola, P. E. (2014). Customer behaviour analytics and data mining. American Journal of Computation, Communication and Control 2014; 1(4): 66-74
9. Hair Jr, J. F. (2007). Knowledge Creation in Marketing: The Role of Predictive Analytics. European Business Review 19(4):303-315. DOI: 10.1108/09555340710760134
10. Han, J., Cheng, H., Xin, D. & Yan, X. (2007). Frequent pattern mining: current status and future directions. Data Mining Knowledge Disc (2007) 15:55–86 DOI10.1007/s10618-006-0059-1
11. Hauser, W. J. (2007) "Marketing analytics: the evolution of marketing research in the twenty‐ first century", Direct Marketing: An International Journal, Vol. 1 Issue: 1, pp.3854, https://doi.org/10.1108/17505930710734125
12. Ige A.O, Akingbesote A.O, Orogun A.O. (2019). Trust appraisal in a conventional e-market environment: A review. Canadian Open Information Science and Internet Technology Journal. Vol. 1, No. 1, April 2019, pp. 1 -9
13. Jagdish N. Sheth and Chin Tiong Tan, Singapore: Association for Consumer Research, Pages: 5-7.
14. Jerry, W. &Vijan, M.(2002). Digital Marketing, Symphonya, Emerging Issues in Management, n. 1, 2002,,http://symphonya.unimib.it/article /view/2002.1.04wind.mahajan. pp. 43-54
15. Kiani, G. R. (1998),"Marketing opportunities in the digital world", Internet Research, Vol. 8 Issue 2 pp. 185 – 194
16. Koh, H. C. & Tan, G. (2005). Data Mining Applications in Healthcare. Journal of Healthcare Information Management — Vol. 19, No. 2. Pp 64-72.
17. Leeflang, P. S., Verhoef, P. C., Dahlström, P., &Freundt, T. (2014). Challenges and solutions for marketing in a digital era, European Management Journal 32 (2014) 1–12
18. Nejad, M. B., Nejad, E. B. &Karami, A. (2012). Using Data Mining Techniques to Increase Efficiency of Customer Relationship Management Process. Research, In Journal of Applied Sciences, Engineering and Technology 4(23): 5010-5015, 2012 ISSN: 2040-7467
19. Parsons, A., Zeisser, M. &Waitman, R. (1998). Organizing today for the digital market tomorrow. Journal of interactive marketing volume 12 / number 1 / winter 1998
20. Sagiroglu,S. &Sinanc, D. (2013). Big Data: a Review. International Conference on collaboration technologies and systems. IEEE 2013. 21. Sheth, J. N. (1985) ,"History of Consumer Behavior: a Marketing Perspective", in SV - Historical Perspective in Consumer Research: National
and International Perspectives, eds.
22. Sismeiro, C. & Bucklin, R. E. (2004). Modeling Purchase Behavior at an E-Commerce Web Site: A Task-Completion Approach. Journal of Marketing Research 41(3):306-323. DOI: 10.1509/jmkr.41.3.306.35985
23. Tadajewski, M. (2009). A History of Marketing Thought, Ch 2 in Contemporary Issues in Marketing and Consumer Behaviour,Elizabeth Parsons and Pauline Maclaran (eds), Routledge, pp 24-25
24. Tiago, B. & Manuel, J. (2014). Digital marketing and social media: Why bother? Business Horizons 57(6):703-708. DOI: 10.1016/j.bushor.2014.07.002